| Param | Original file | Final file |
|---|---|---|
| Filename | modeM0/AS1G06_117T01_9000001046_07607cztM0_level2.evt | modeM0/AS1G06_117T01_9000001046_07607cztM0_level2_quad_clean.evt |
| Size (bytes) | 1,606,858,560 | 236,168,640 |
| Size | 1.5 GB | 225.2 MB |
| Events in quadrant A | 8,453,554 | 1,506,708 |
| Events in quadrant B | 9,034,513 | 1,531,255 |
| Events in quadrant C | 17,519,237 | 1,418,656 |
| Events in quadrant D | 12,381,557 | 1,393,073 |
| Mode SS | |||
|---|---|---|---|
| Quadrant | BADHDUFLAG | Total packets | Discarded packets |
| A | 0 | 386 | 0 |
| B | 0 | 386 | 0 |
| C | 0 | 386 | 0 |
| D | 0 | 386 | 0 |
| Mode M0 | |||
|---|---|---|---|
| Quadrant | BADHDUFLAG | Total packets | Discarded packets |
| A | 0 | 38673 | 5 |
| B | 0 | 39779 | 6 |
| C | 0 | 65200 | 4 |
| D | 0 | 50082 | 6 |
| Mode M9 | |||
|---|---|---|---|
| Quadrant | BADHDUFLAG | Total packets | Discarded packets |
| A | 0 | 22 | 0 |
| B | 0 | 22 | 0 |
| C | 0 | 22 | 0 |
| D | 0 | 22 | 0 |
| Quadrant | Total seconds | Saturated seconds | Saturation percentage |
|---|---|---|---|
| A | 18904 | 127 | 0.671815% |
| B | 18903 | 195 | 1.031582% |
| C | 18904 | 2534 | 13.404570% |
| D | 18903 | 1230 | 6.506904% |
Noise dominated data is calculated using 1-second bins in cleaned event files. If a bin has >2000 counts, and if more than 50% of those come from <1% of pixels, then it is considered to be noise-dominated and hence unusable.
| Quadrant | # 1 sec bins | Bins with >0 counts | Bins with >2000 counts | High rate bins dominated by noise | Noise dominated (total time) | Noise dominated (detector-on time) | Marked lightcurve |
|---|---|---|---|---|---|---|---|
| A | 21070 | 18910 | 1 | 1 | 0.00% | 0.01% |  |
| B | 21070 | 18910 | 22 | 22 | 0.10% | 0.12% |  |
| C | 21070 | 18909 | 2206 | 2206 | 10.47% | 11.67% |  |
| D | 21070 | 18910 | 1043 | 1043 | 4.95% | 5.52% |  |
Top three noisy pixels from each quadrant. If the there are fewer than three noisy pixels in the level2.evt file, extra rows are filled as -1
| Pixel properties | Quadrant properties | ||||||
|---|---|---|---|---|---|---|---|
| Quadrant | DetID | PixID | Counts | Sigma | Mean | Median | Sigma |
| A | 0 | 226 | 20662 | 41.92 | 2190 | 2143 | 441.7 |
| A | 12 | 194 | 19456 | 39.19 | 2190 | 2143 | 441.7 |
| A | 3 | 1 | 17870 | 35.6 | 2190 | 2143 | 441.7 |
| B | 10 | 245 | 119275 | 278.86 | 2208 | 2149 | 420.0 |
| B | 0 | 219 | 113256 | 264.53 | 2208 | 2149 | 420.0 |
| B | 0 | 214 | 80192 | 185.81 | 2208 | 2149 | 420.0 |
| C | 9 | 68 | 8304930 | 17436.08 | 2050 | 2060 | 476.2 |
| C | 8 | 229 | 1158850 | 2429.27 | 2050 | 2060 | 476.2 |
| C | 4 | 254 | 41522 | 82.87 | 2050 | 2060 | 476.2 |
| D | 2 | 136 | 2550174 | 5041.41 | 2069 | 2002 | 505.4 |
| D | 13 | 104 | 567164 | 1118.14 | 2069 | 2002 | 505.4 |
| D | 2 | 152 | 551594 | 1087.34 | 2069 | 2002 | 505.4 |
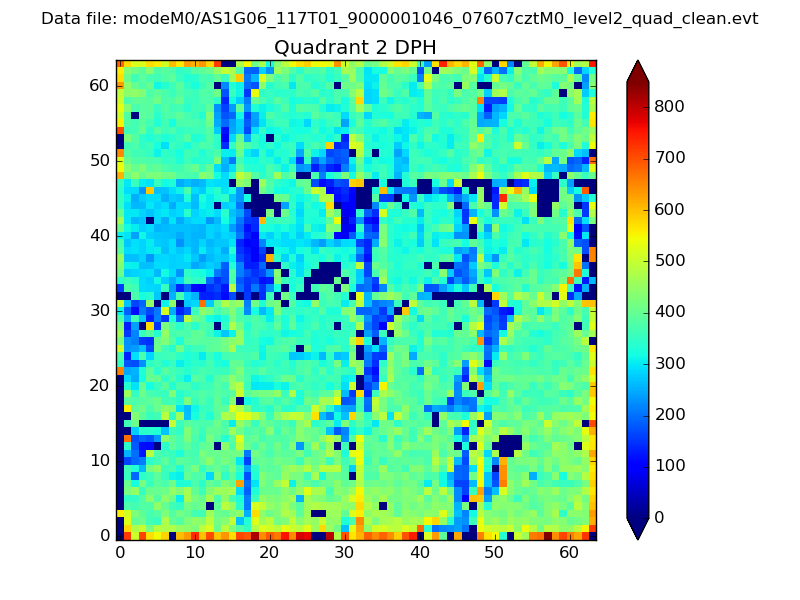
Histogram calculated using DETX and DETY for each event in the final _common_clean file
| Quadrant A | 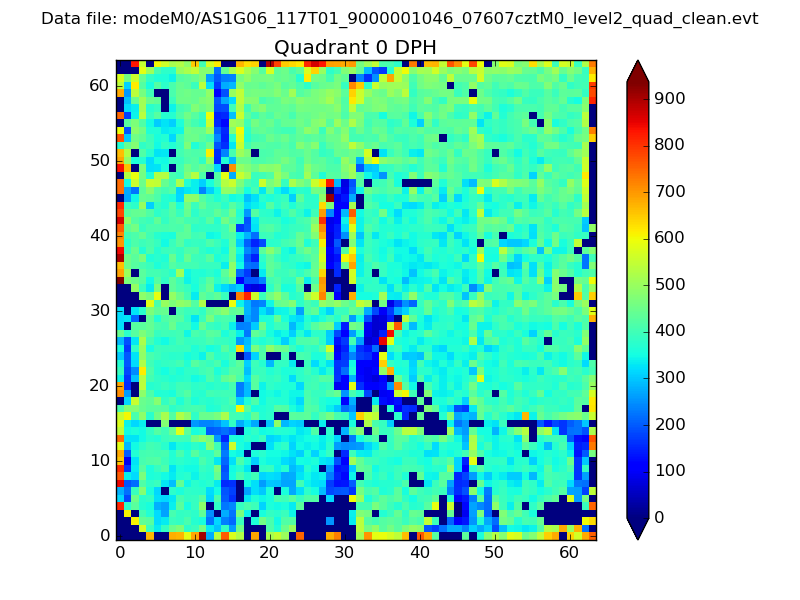 |
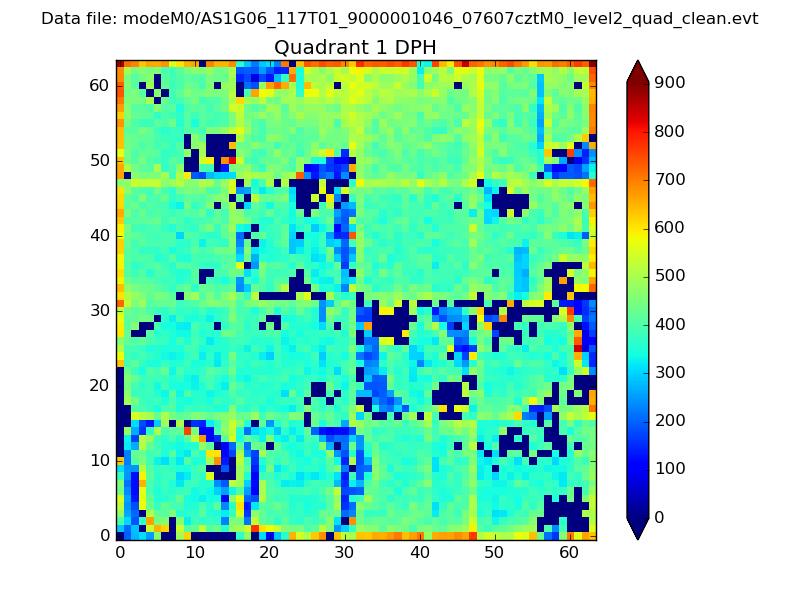 |
Quadrant B |
|---|---|---|---|
| Quadrant D | 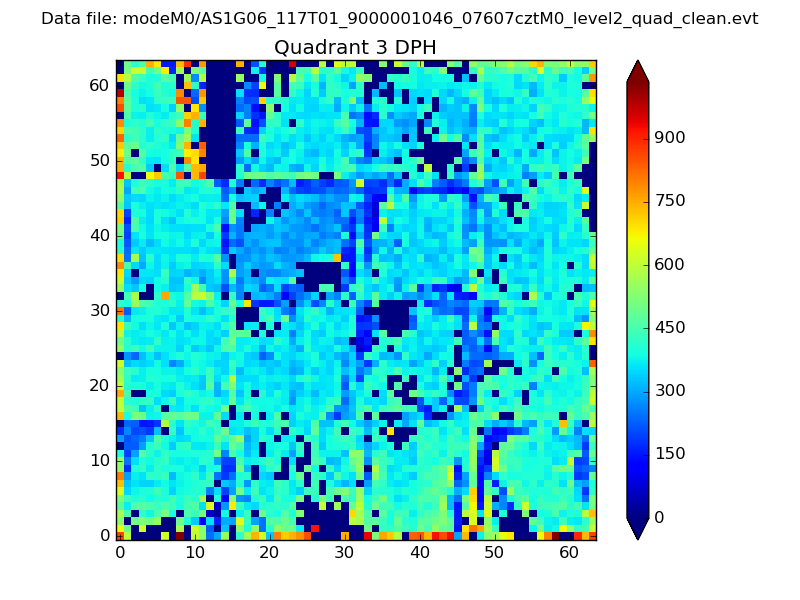 |
 |
Quadrant C |
| Plot type | Count rate plots | Images |
|---|---|---|
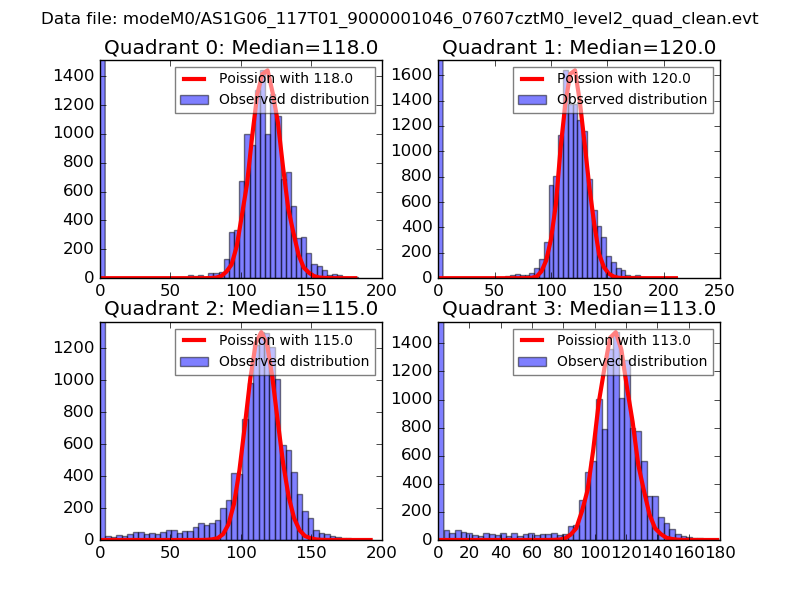
| Comparison with Poisson distribution Blue bars denote a histogram of data divided into 1 sec bins. Red curve is a Poisson curve with rate = median count rate of data. |
 |
 |
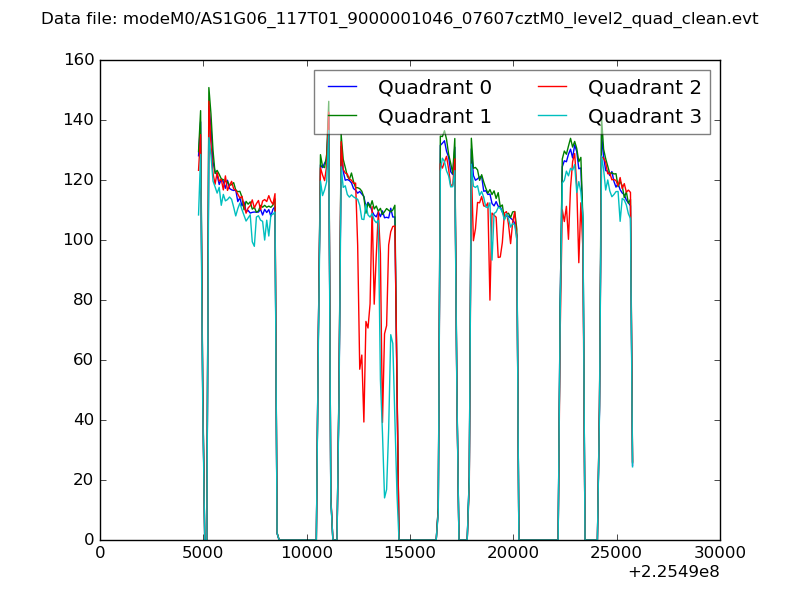
| Quadrant-wise count rates Data is divided into 100 sec bins |
 |
|
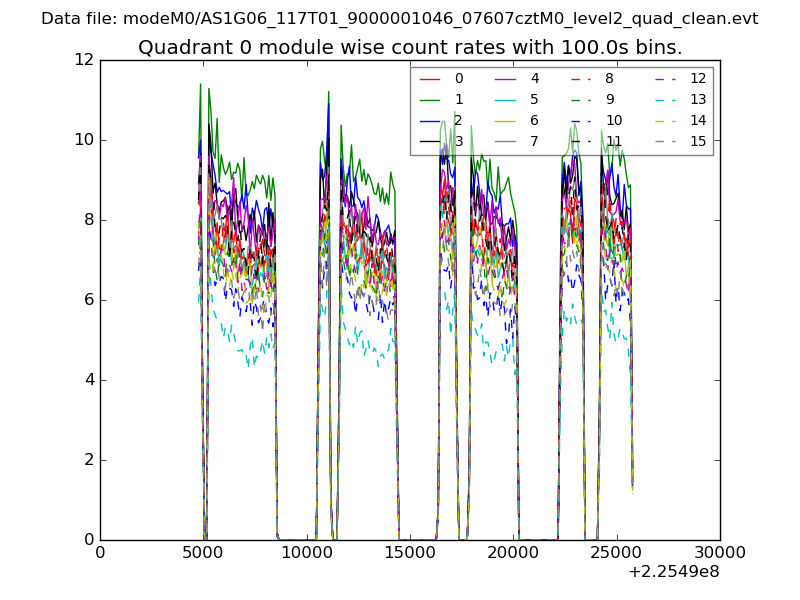
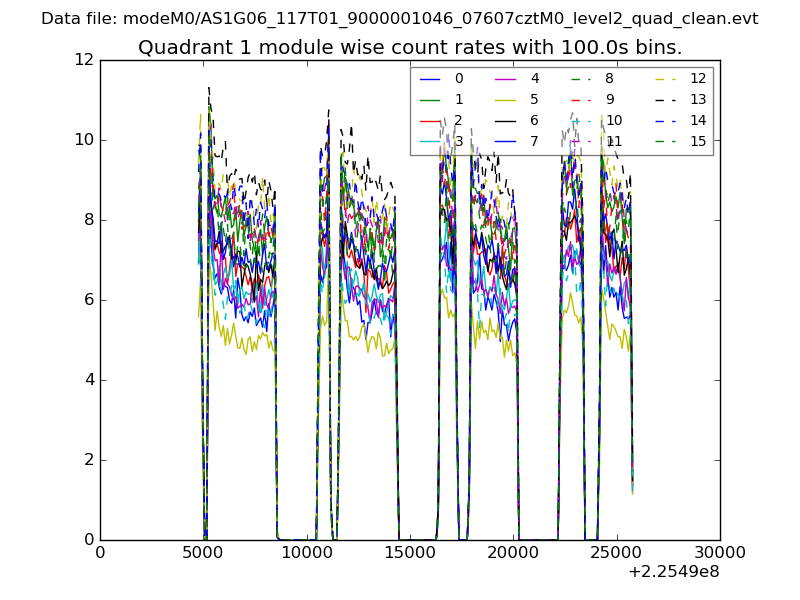
| Module-wise count rates for Quadrant A Data is divided into 100 sec bins |
 |
 |
| Module-wise count rates for Quadrant B Data is divided into 100 sec bins |
 |
 |
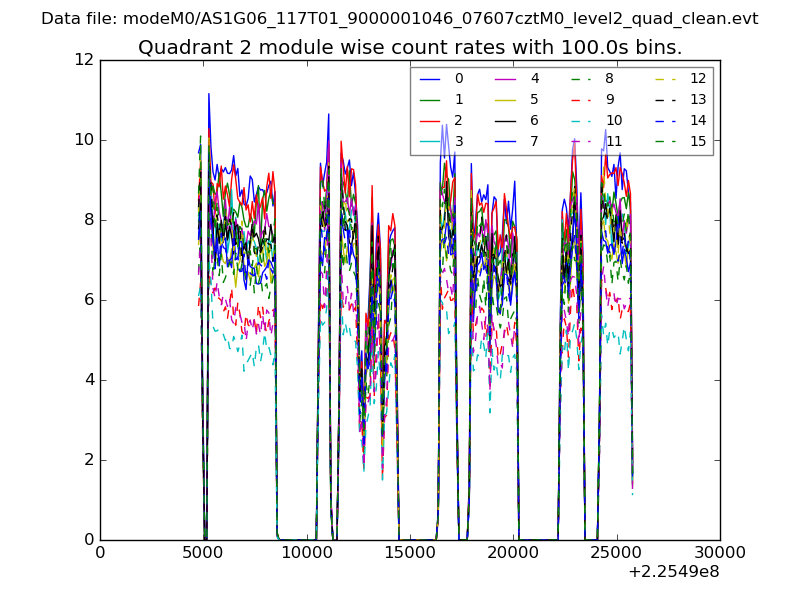
| Module-wise count rates for Quadrant C Data is divided into 100 sec bins |
 |
 |
| Module-wise count rates for Quadrant D Data is divided into 100 sec bins |
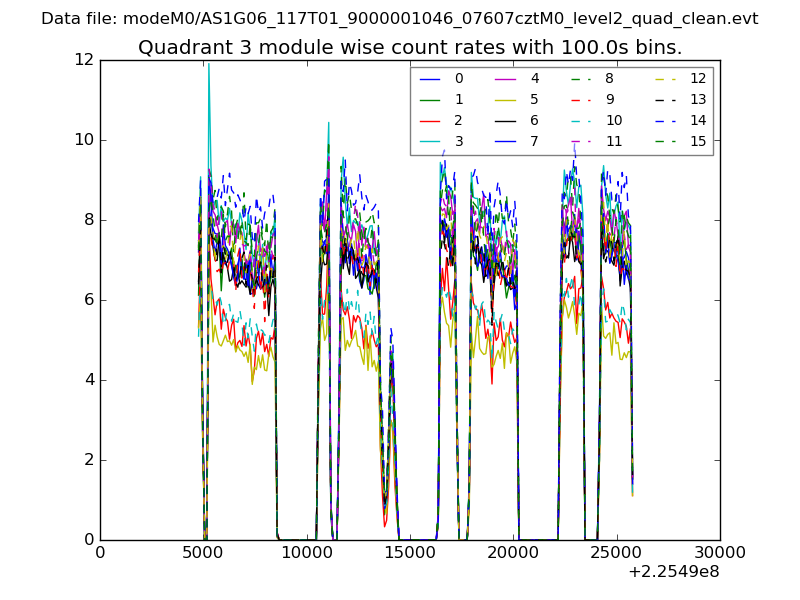 |
 |
| Parameter | Plot |
|---|---|
| CZT HV Monitor | 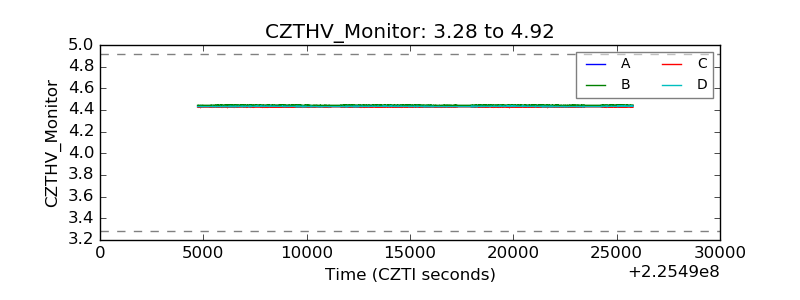 |
| D_VDD | 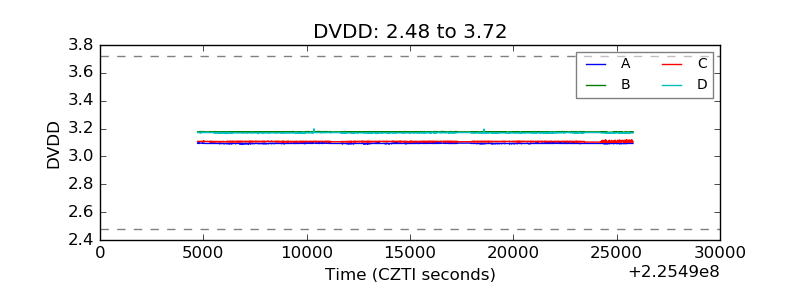 |
| Temperature 1 | 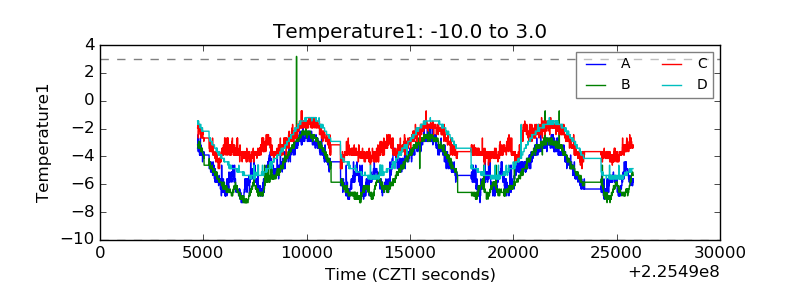 |
| Veto HV Monitor |  |
| Veto LLD | 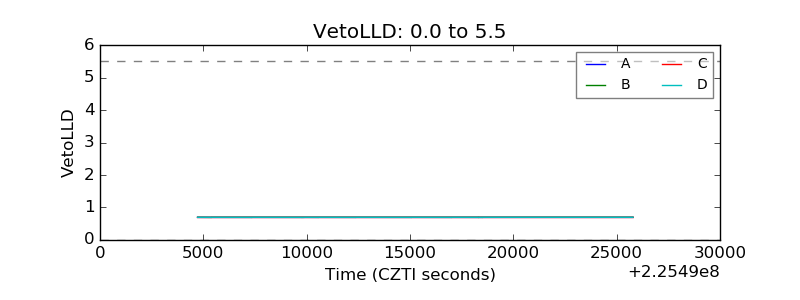 |
| Alpha Counter | 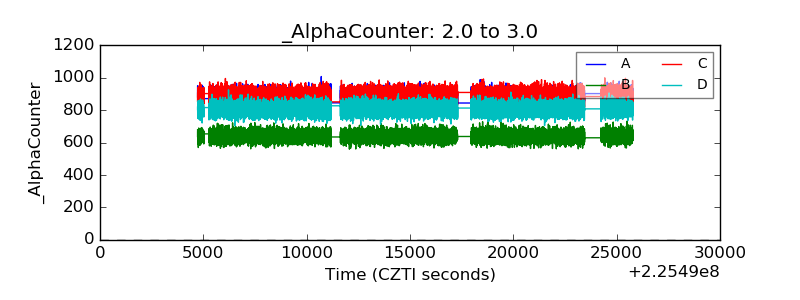 |
| _CPM_Rate | 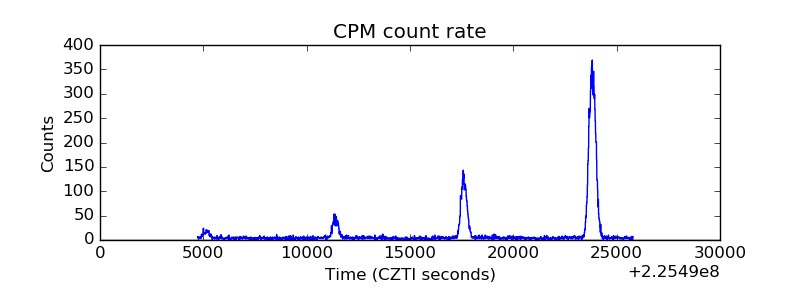 |
| CZT Counter | 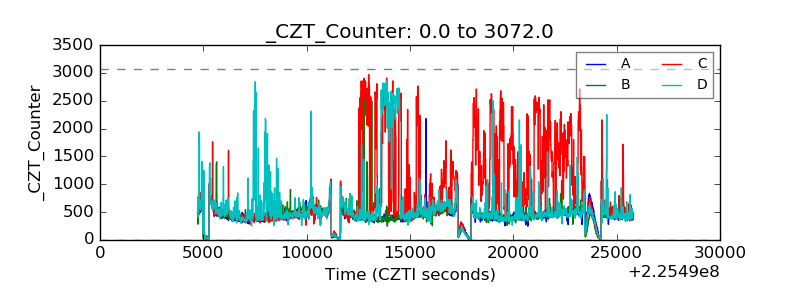 |
| +2.5 Volts monitor |  |
| +5 Volts monitor |  |
| _ROLL_ROT | 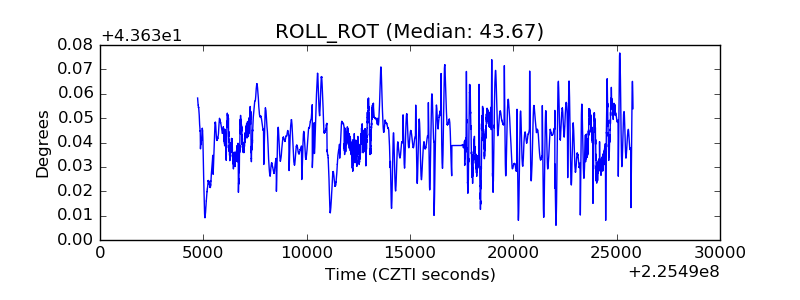 |
| _Roll_DEC | 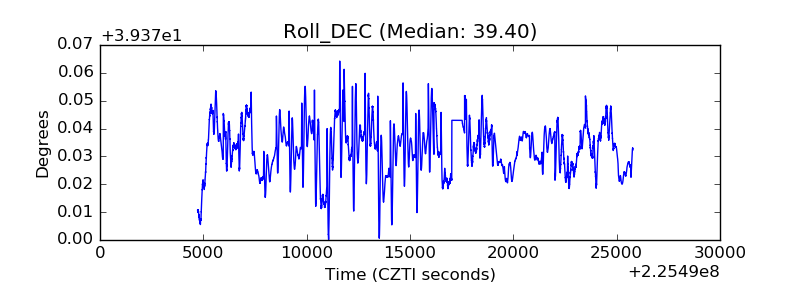 |
| _Roll_RA |  |
| Veto Counter | 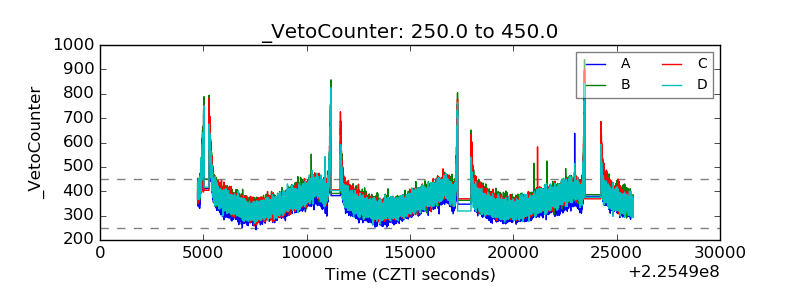 |