| Param | Original file | Final file |
|---|---|---|
| Filename | modeM0/AS1G06_117T01_9000001046_07608cztM0_level2.evt | modeM0/AS1G06_117T01_9000001046_07608cztM0_level2_quad_clean.evt |
| Size (bytes) | 528,235,200 | 97,551,360 |
| Size | 503.8 MB | 93.0 MB |
| Events in quadrant A | 3,238,033 | 622,987 |
| Events in quadrant B | 3,465,931 | 632,277 |
| Events in quadrant C | 4,177,302 | 616,886 |
| Events in quadrant D | 4,632,468 | 585,584 |
| Mode SS | |||
|---|---|---|---|
| Quadrant | BADHDUFLAG | Total packets | Discarded packets |
| A | 0 | 146 | 0 |
| B | 0 | 146 | 0 |
| C | 0 | 146 | 0 |
| D | 0 | 146 | 0 |
| Mode M0 | |||
|---|---|---|---|
| Quadrant | BADHDUFLAG | Total packets | Discarded packets |
| A | 0 | 14534 | 3 |
| B | 0 | 14969 | 2 |
| C | 0 | 17220 | 2 |
| D | 0 | 18731 | 7 |
| Mode M9 | |||
|---|---|---|---|
| Quadrant | BADHDUFLAG | Total packets | Discarded packets |
| A | 0 | 18 | 0 |
| B | 0 | 18 | 0 |
| C | 0 | 18 | 0 |
| D | 0 | 18 | 0 |
| Quadrant | Total seconds | Saturated seconds | Saturation percentage |
|---|---|---|---|
| A | 7130 | 89 | 1.248247% |
| B | 7130 | 109 | 1.528752% |
| C | 7130 | 256 | 3.590463% |
| D | 7128 | 420 | 5.892256% |
Noise dominated data is calculated using 1-second bins in cleaned event files. If a bin has >2000 counts, and if more than 50% of those come from <1% of pixels, then it is considered to be noise-dominated and hence unusable.
| Quadrant | # 1 sec bins | Bins with >0 counts | Bins with >2000 counts | High rate bins dominated by noise | Noise dominated (total time) | Noise dominated (detector-on time) | Marked lightcurve |
|---|---|---|---|---|---|---|---|
| A | 8875 | 7132 | 0 | 0 | 0.00% | 0.00% | 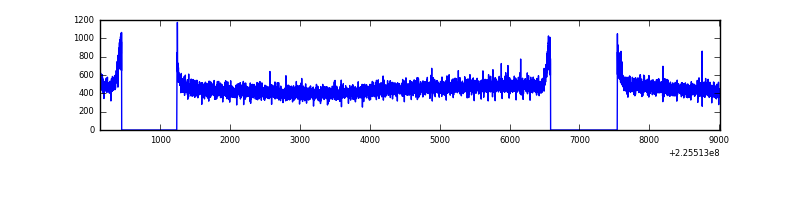 |
| B | 8875 | 7132 | 9 | 9 | 0.10% | 0.13% | 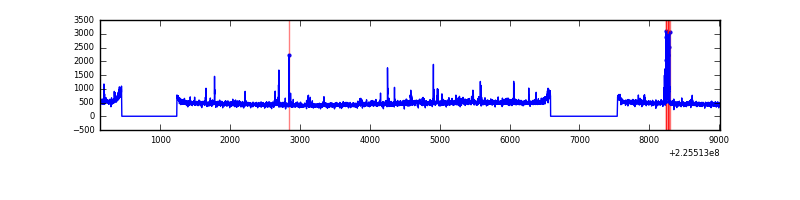 |
| C | 8875 | 7130 | 127 | 127 | 1.43% | 1.78% | 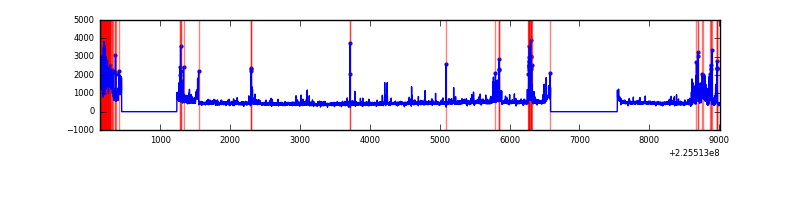 |
| D | 8875 | 7132 | 299 | 299 | 3.37% | 4.19% | 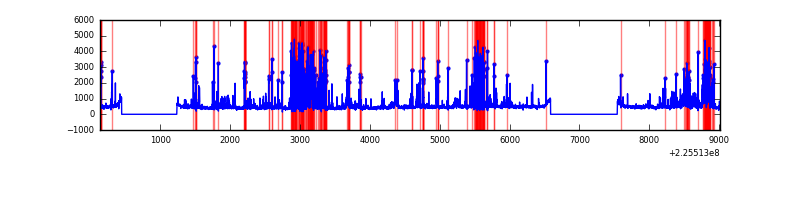 |
Top three noisy pixels from each quadrant. If the there are fewer than three noisy pixels in the level2.evt file, extra rows are filled as -1
| Pixel properties | Quadrant properties | ||||||
|---|---|---|---|---|---|---|---|
| Quadrant | DetID | PixID | Counts | Sigma | Mean | Median | Sigma |
| A | 3 | 1 | 9459 | 50.69 | 837 | 818 | 170.4 |
| A | 0 | 226 | 7853 | 41.27 | 837 | 818 | 170.4 |
| A | 12 | 194 | 7574 | 39.63 | 837 | 818 | 170.4 |
| B | 10 | 247 | 52509 | 319.28 | 843 | 821 | 161.9 |
| B | 0 | 219 | 51360 | 312.19 | 843 | 821 | 161.9 |
| B | 0 | 229 | 30105 | 180.89 | 843 | 821 | 161.9 |
| C | 9 | 68 | 874494 | 4642.61 | 806 | 811 | 188.2 |
| C | 4 | 254 | 129146 | 681.95 | 806 | 811 | 188.2 |
| C | 8 | 128 | 15814 | 79.72 | 806 | 811 | 188.2 |
| D | 13 | 104 | 1136566 | 5850.79 | 795 | 769 | 194.1 |
| D | 2 | 136 | 311177 | 1598.99 | 795 | 769 | 194.1 |
| D | 5 | 233 | 62827 | 319.67 | 795 | 769 | 194.1 |
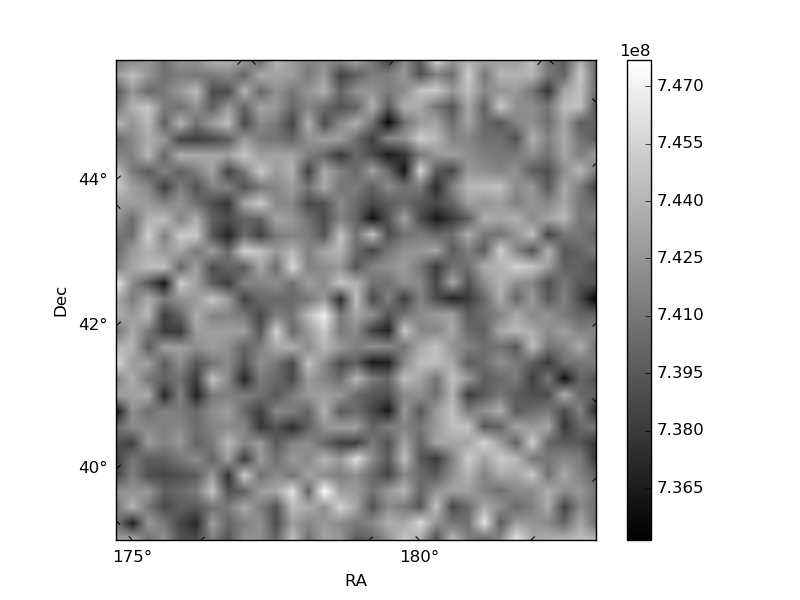
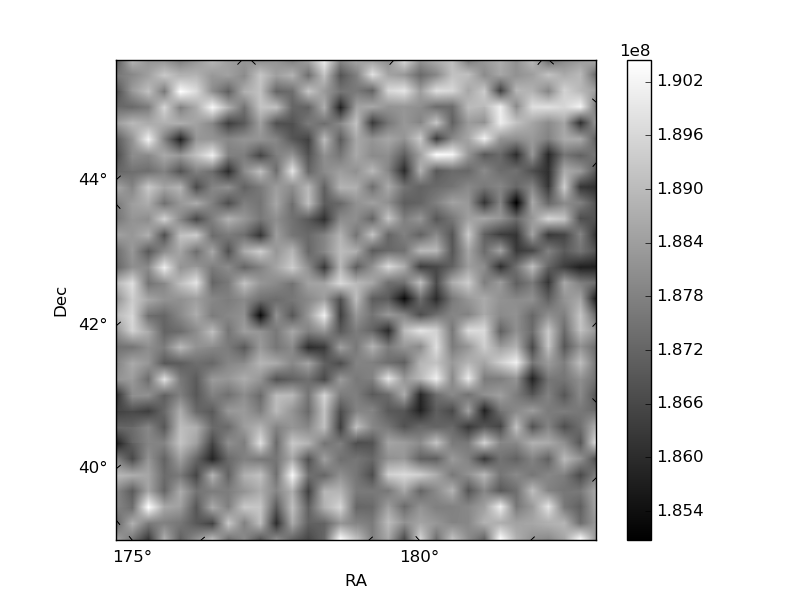
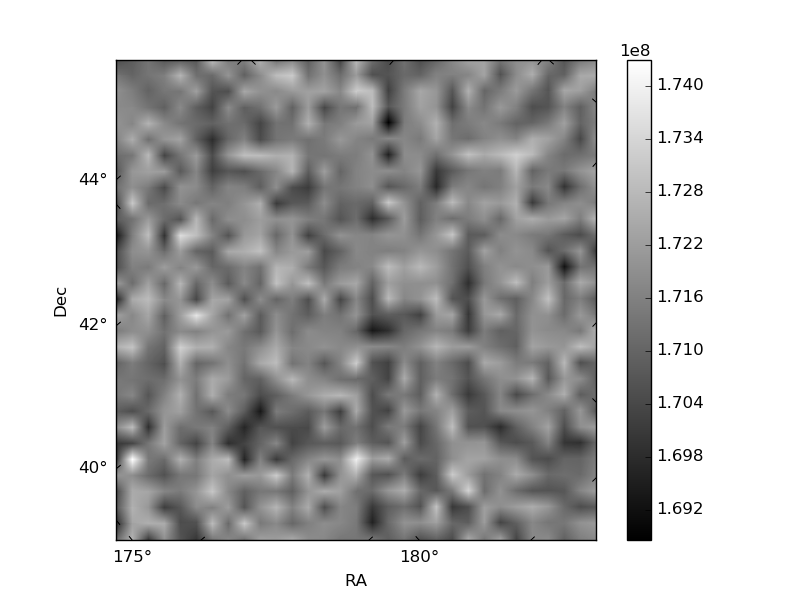
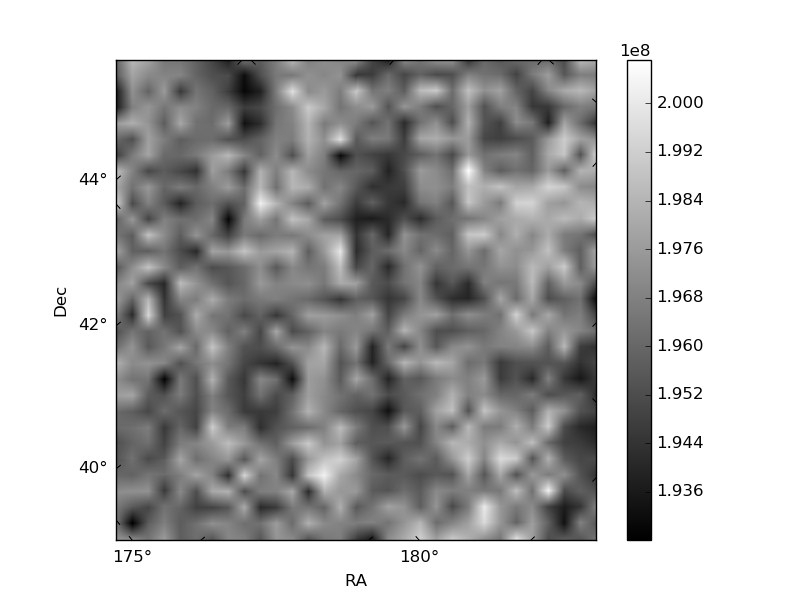
Histogram calculated using DETX and DETY for each event in the final _common_clean file
| Quadrant A | 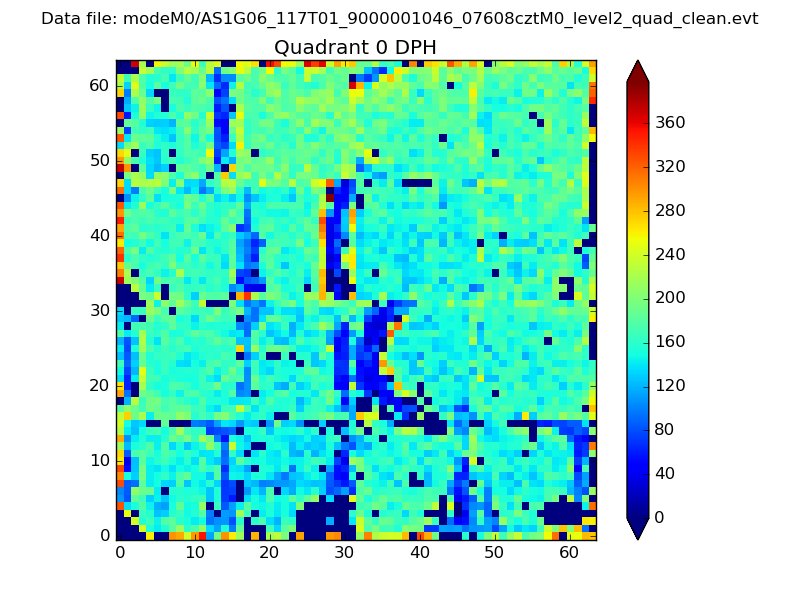 |
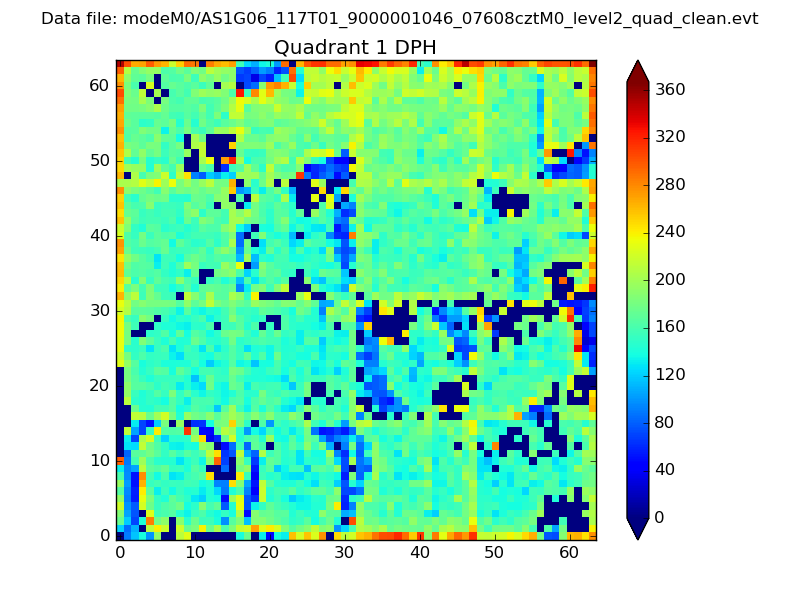 |
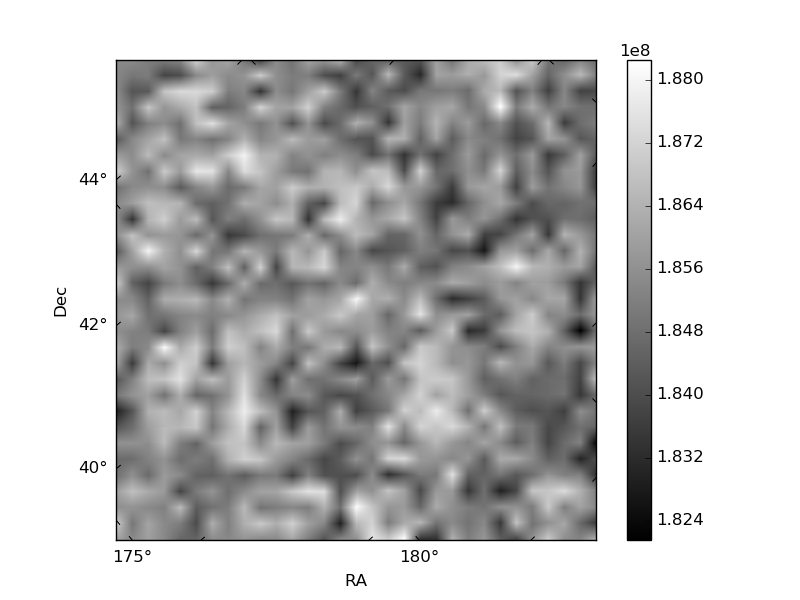
Quadrant B |
|---|---|---|---|
| Quadrant D | 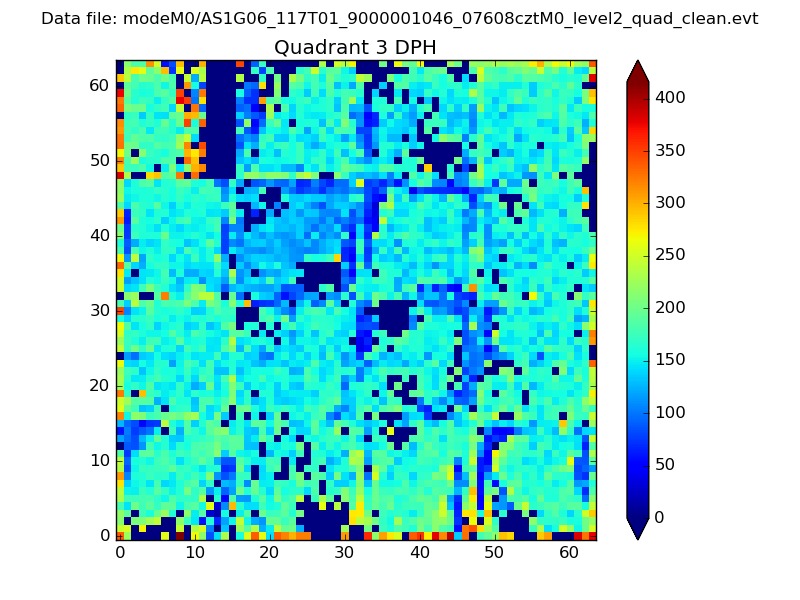 |
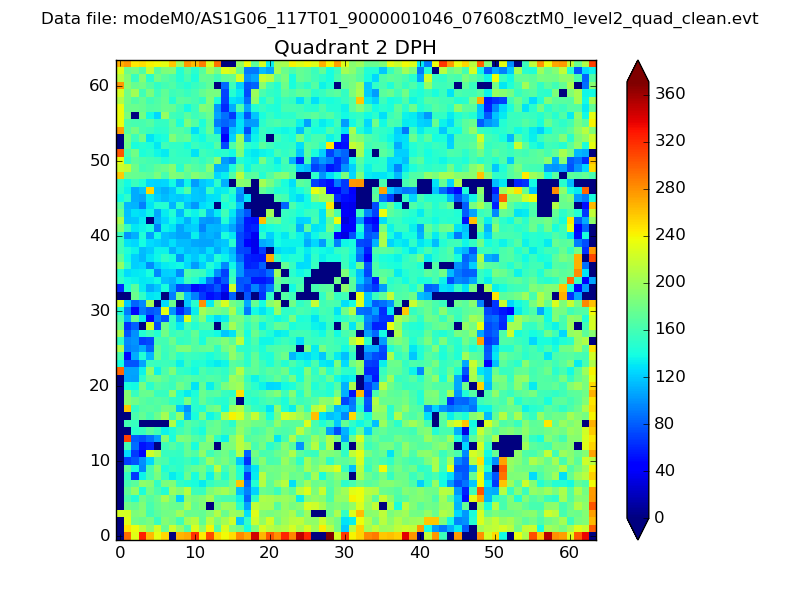 |
Quadrant C |
| Plot type | Count rate plots | Images |
|---|---|---|
| Comparison with Poisson distribution Blue bars denote a histogram of data divided into 1 sec bins. Red curve is a Poisson curve with rate = median count rate of data. |
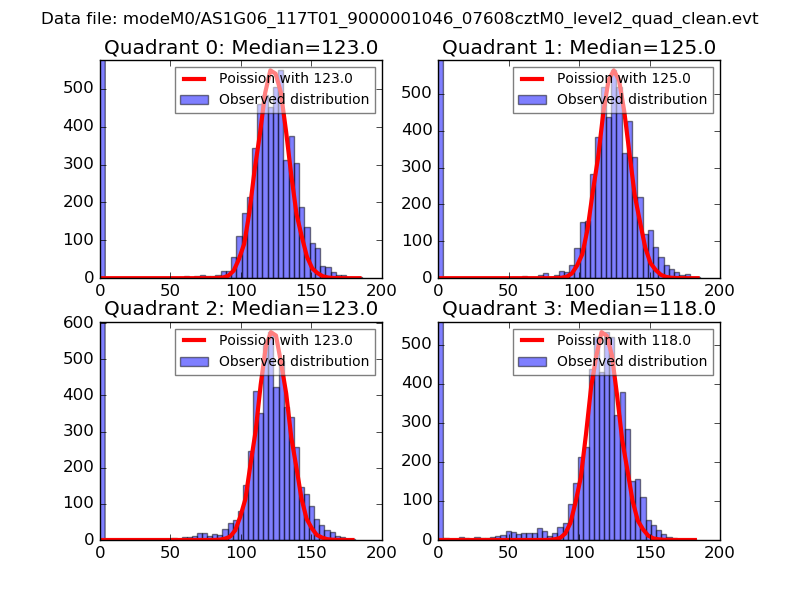 |
 |
| Quadrant-wise count rates Data is divided into 100 sec bins |
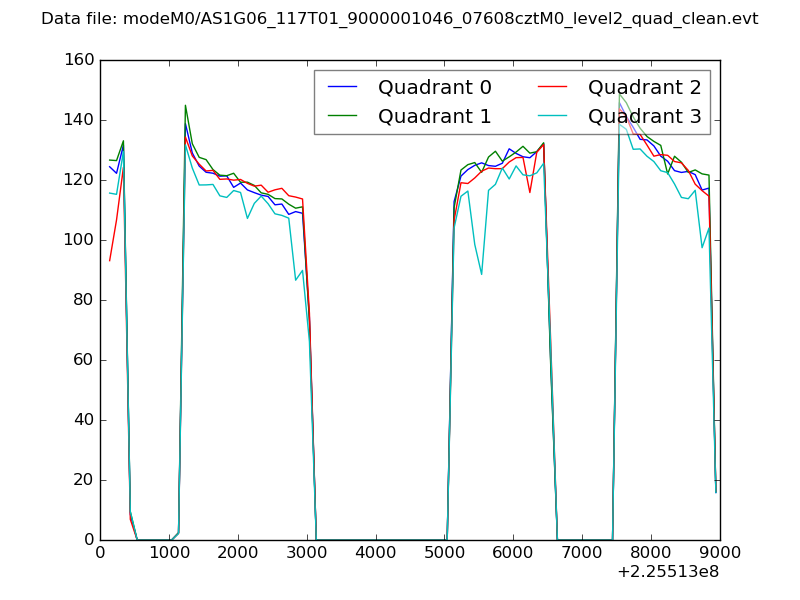 |
|
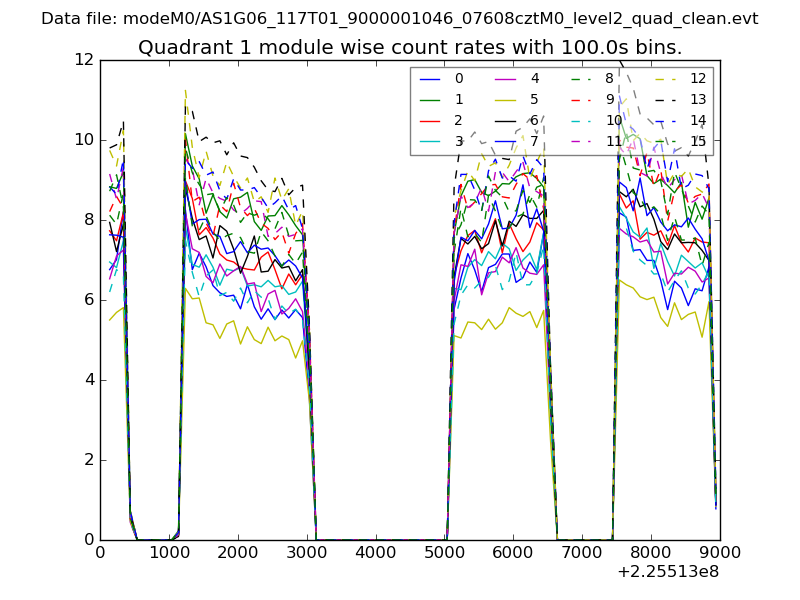
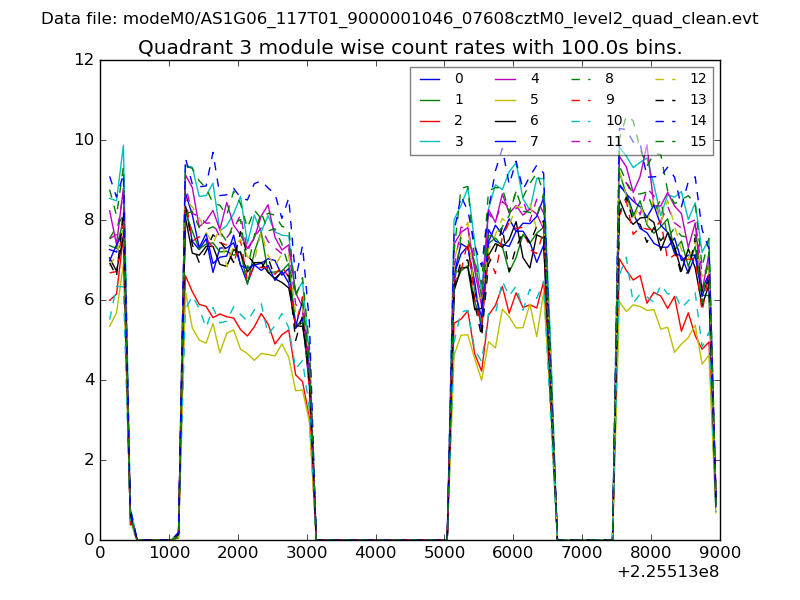
| Module-wise count rates for Quadrant A Data is divided into 100 sec bins |
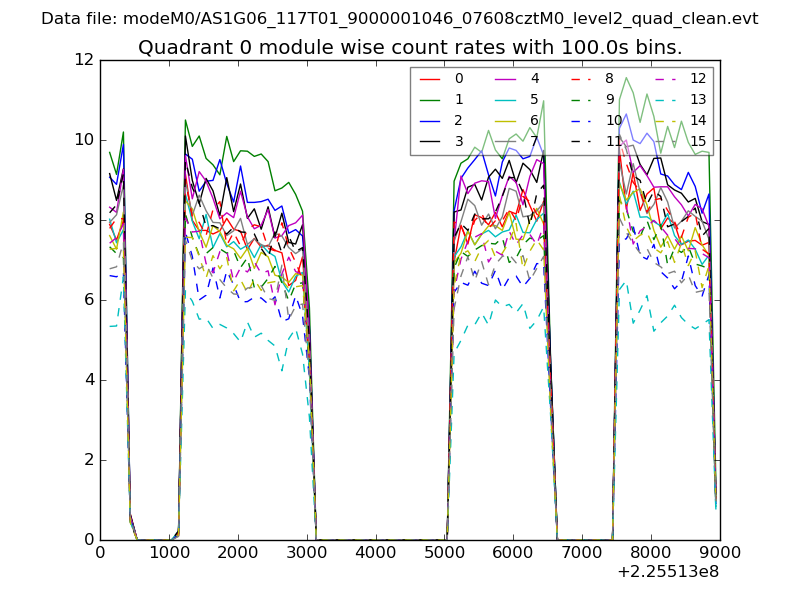 |
 |
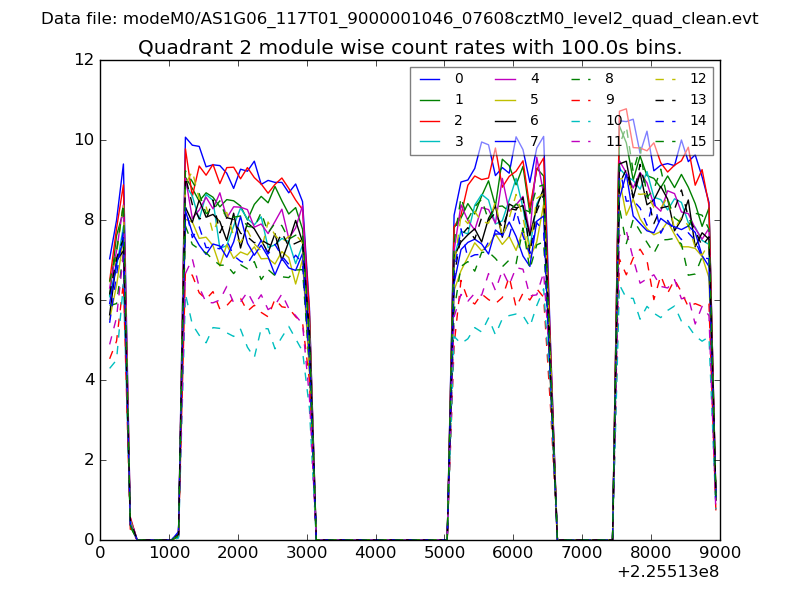
| Module-wise count rates for Quadrant B Data is divided into 100 sec bins |
 |
 |
| Module-wise count rates for Quadrant C Data is divided into 100 sec bins |
 |
 |
| Module-wise count rates for Quadrant D Data is divided into 100 sec bins |
 |
 |
| Parameter | Plot |
|---|---|
| CZT HV Monitor | 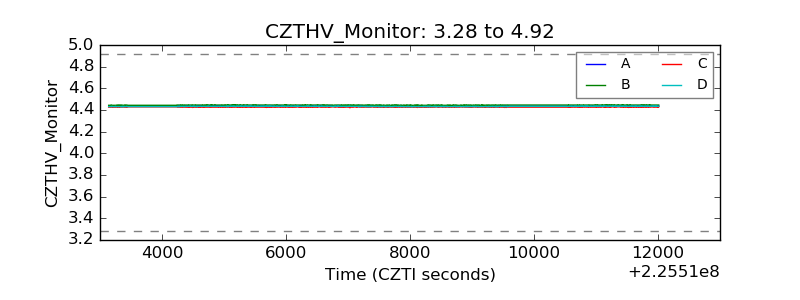 |
| D_VDD | 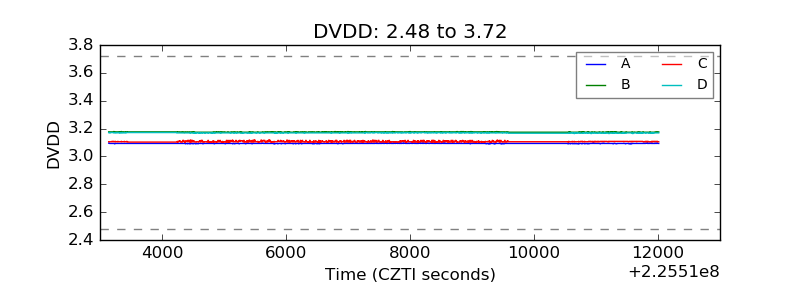 |
| Temperature 1 | 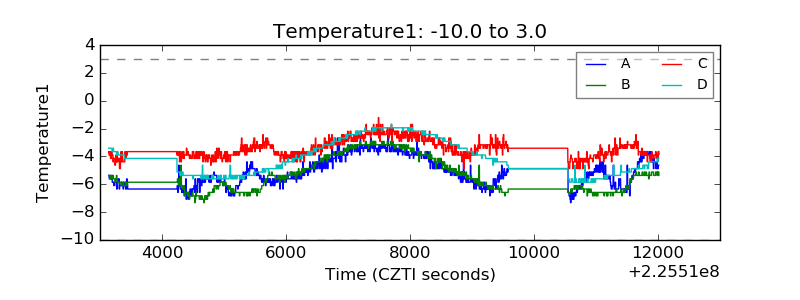 |
| Veto HV Monitor | 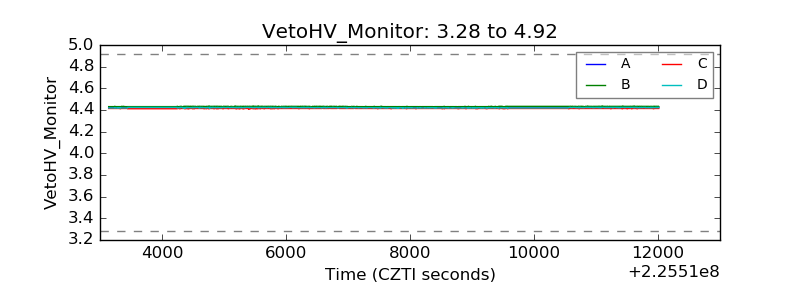 |
| Veto LLD | 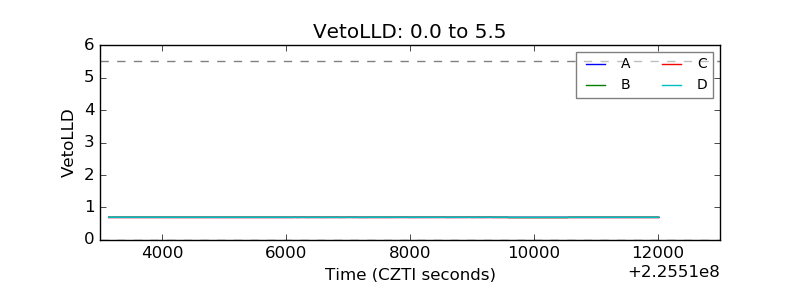 |
| Alpha Counter | 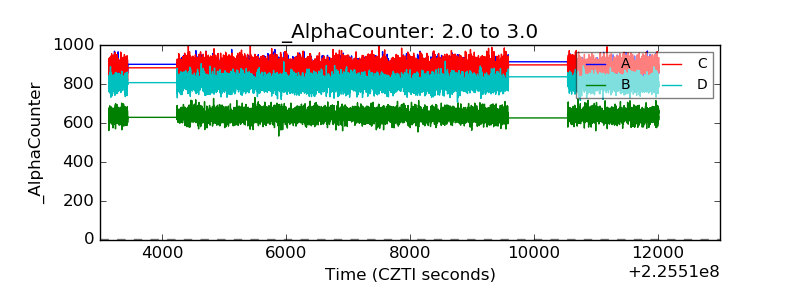 |
| _CPM_Rate | 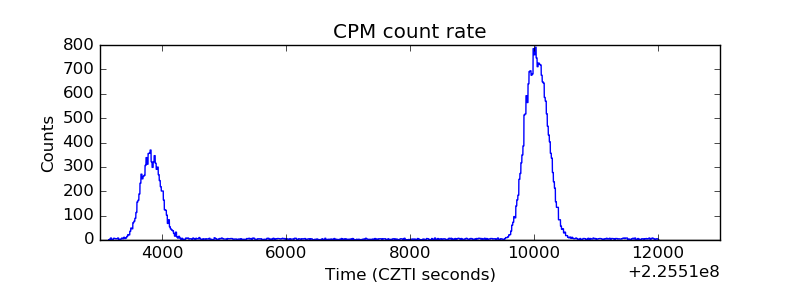 |
| CZT Counter | 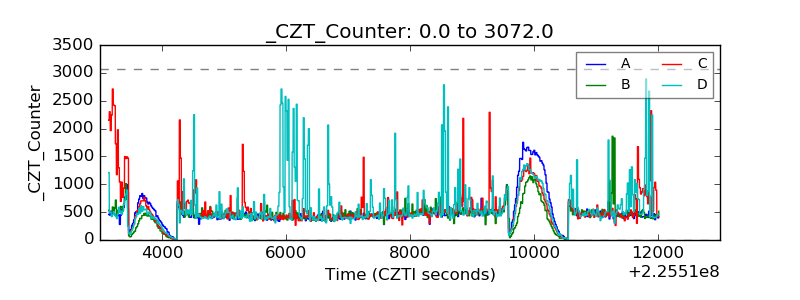 |
| +2.5 Volts monitor | 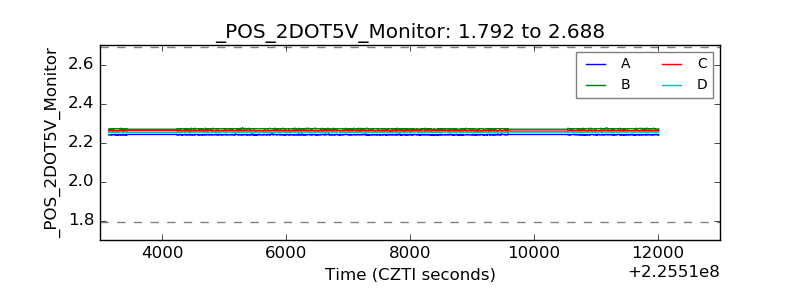 |
| +5 Volts monitor |  |
| _ROLL_ROT | 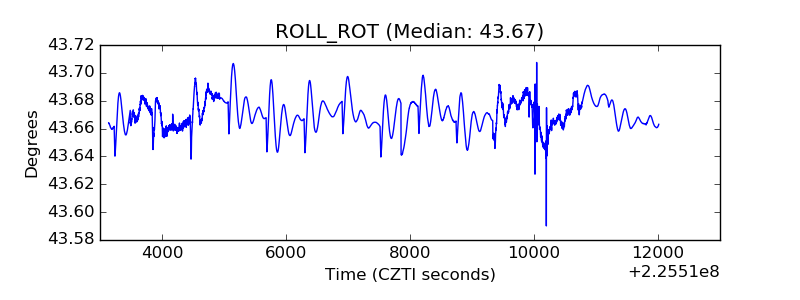 |
| _Roll_DEC |  |
| _Roll_RA | 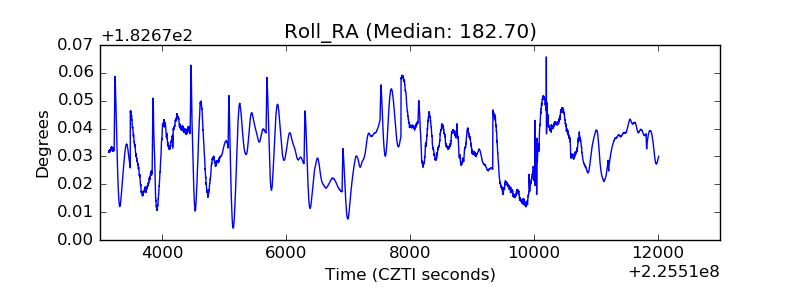 |
| Veto Counter | 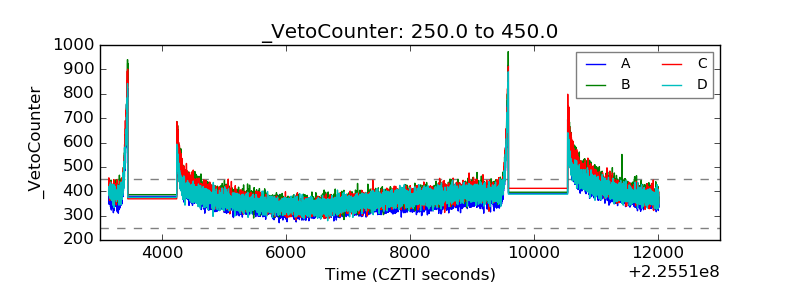 |