| Param | Original file | Final file |
|---|---|---|
| Filename | modeM0/AS1G06_117T01_9000001046_07610cztM0_level2.evt | modeM0/AS1G06_117T01_9000001046_07610cztM0_level2_quad_clean.evt |
| Size (bytes) | 535,999,680 | 85,714,560 |
| Size | 511.2 MB | 81.7 MB |
| Events in quadrant A | 3,142,785 | 543,418 |
| Events in quadrant B | 3,247,290 | 552,037 |
| Events in quadrant C | 5,139,111 | 518,784 |
| Events in quadrant D | 4,248,151 | 513,230 |
| Mode SS | |||
|---|---|---|---|
| Quadrant | BADHDUFLAG | Total packets | Discarded packets |
| A | 0 | 136 | 0 |
| B | 0 | 136 | 0 |
| C | 0 | 136 | 0 |
| D | 0 | 136 | 0 |
| Mode M0 | |||
|---|---|---|---|
| Quadrant | BADHDUFLAG | Total packets | Discarded packets |
| A | 0 | 13720 | 3 |
| B | 0 | 13913 | 2 |
| C | 0 | 19876 | 2 |
| D | 0 | 17137 | 2 |
| Mode M9 | |||
|---|---|---|---|
| Quadrant | BADHDUFLAG | Total packets | Discarded packets |
| A | 0 | 14 | 0 |
| B | 0 | 14 | 0 |
| C | 0 | 14 | 0 |
| D | 0 | 15 | 0 |
| Quadrant | Total seconds | Saturated seconds | Saturation percentage |
|---|---|---|---|
| A | 6715 | 39 | 0.580789% |
| B | 6715 | 52 | 0.774386% |
| C | 6715 | 532 | 7.922561% |
| D | 6715 | 255 | 3.797468% |
Noise dominated data is calculated using 1-second bins in cleaned event files. If a bin has >2000 counts, and if more than 50% of those come from <1% of pixels, then it is considered to be noise-dominated and hence unusable.
| Quadrant | # 1 sec bins | Bins with >0 counts | Bins with >2000 counts | High rate bins dominated by noise | Noise dominated (total time) | Noise dominated (detector-on time) | Marked lightcurve |
|---|---|---|---|---|---|---|---|
| A | 7840 | 6716 | 0 | 0 | 0.00% | 0.00% | 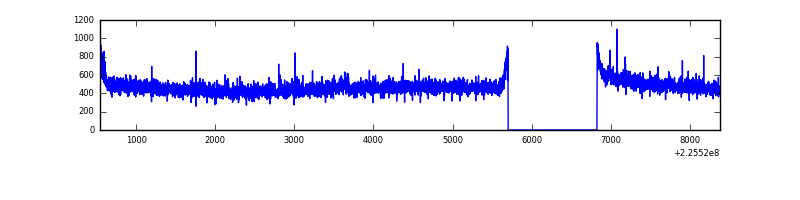 |
| B | 7840 | 6716 | 8 | 8 | 0.10% | 0.12% | 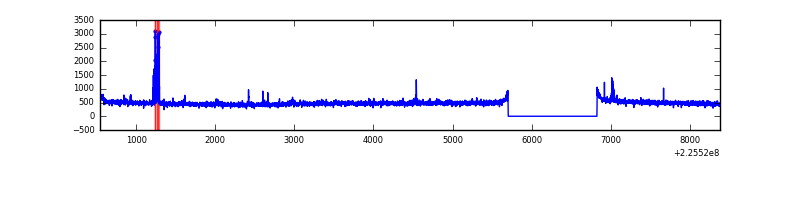 |
| C | 7840 | 6716 | 441 | 441 | 5.62% | 6.57% | 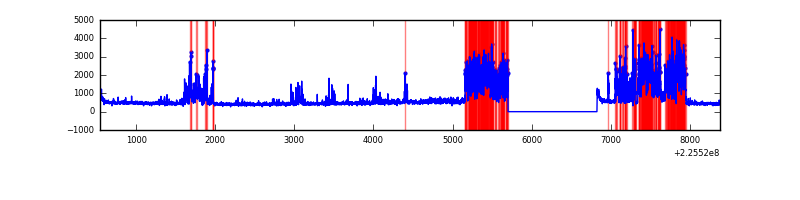 |
| D | 7840 | 6716 | 212 | 212 | 2.70% | 3.16% | 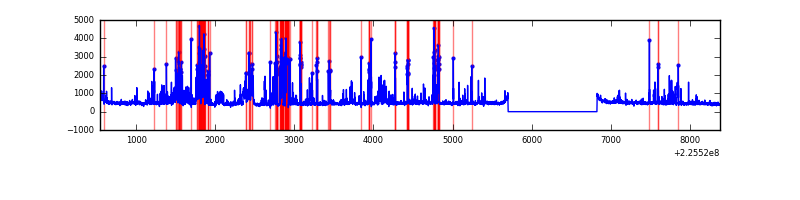 |
Top three noisy pixels from each quadrant. If the there are fewer than three noisy pixels in the level2.evt file, extra rows are filled as -1
| Pixel properties | Quadrant properties | ||||||
|---|---|---|---|---|---|---|---|
| Quadrant | DetID | PixID | Counts | Sigma | Mean | Median | Sigma |
| A | 0 | 128 | 16831 | 96.57 | 809 | 792 | 166.1 |
| A | 3 | 1 | 14155 | 80.46 | 809 | 792 | 166.1 |
| A | 0 | 226 | 7687 | 41.51 | 809 | 792 | 166.1 |
| B | 10 | 247 | 49490 | 316.56 | 808 | 789 | 153.8 |
| B | 0 | 219 | 18143 | 112.8 | 808 | 789 | 153.8 |
| B | 4 | 81 | 16480 | 101.99 | 808 | 789 | 153.8 |
| C | 9 | 68 | 2146170 | 12128.23 | 761 | 765 | 176.9 |
| C | 4 | 254 | 20062 | 109.09 | 761 | 765 | 176.9 |
| C | 13 | 61 | 5860 | 28.8 | 761 | 765 | 176.9 |
| D | 13 | 104 | 918143 | 4850.54 | 768 | 743 | 189.1 |
| D | 2 | 136 | 269351 | 1420.2 | 768 | 743 | 189.1 |
| D | 2 | 14 | 60073 | 313.69 | 768 | 743 | 189.1 |
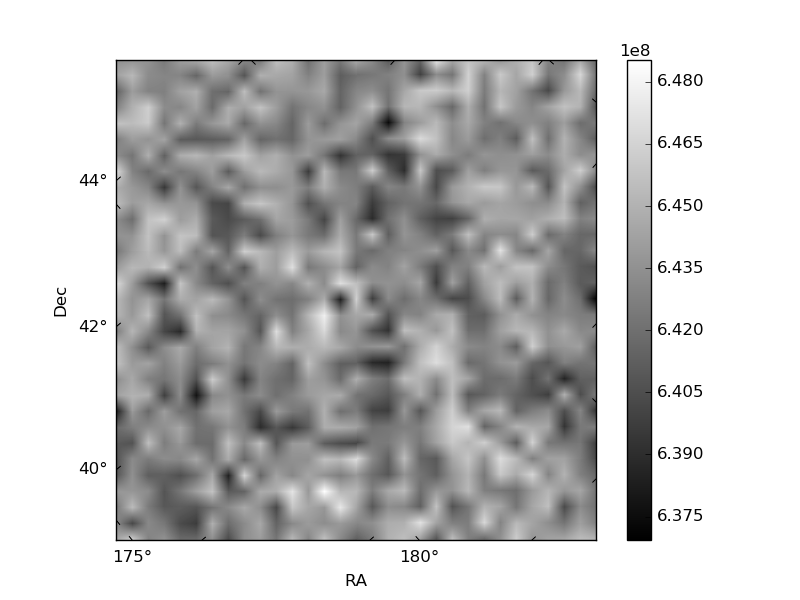
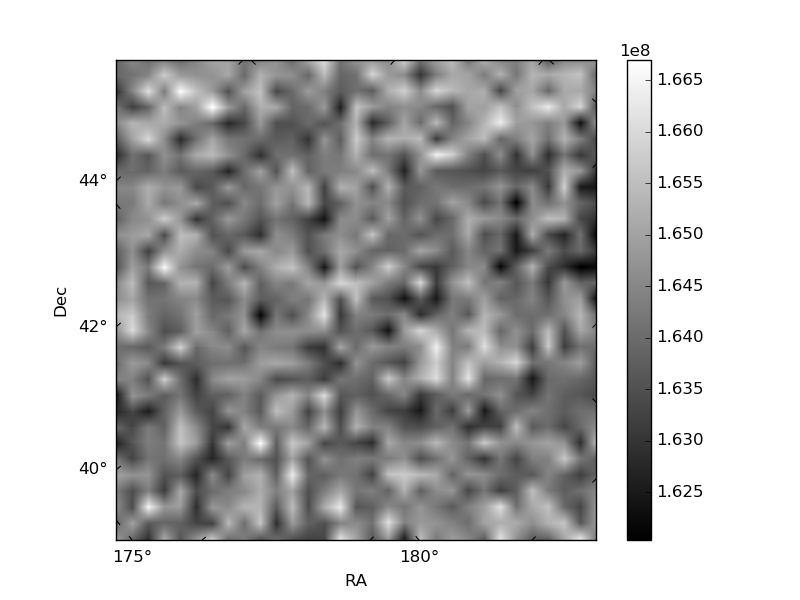
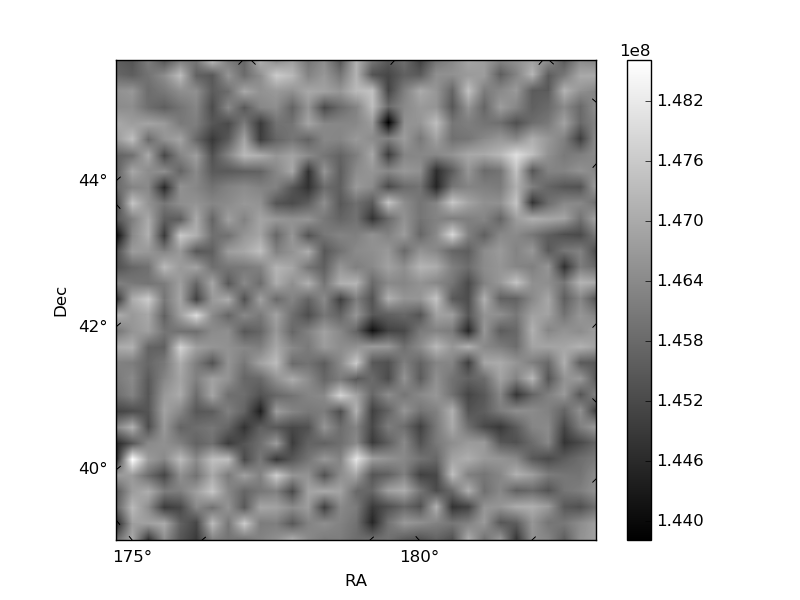
Histogram calculated using DETX and DETY for each event in the final _common_clean file
| Quadrant A | 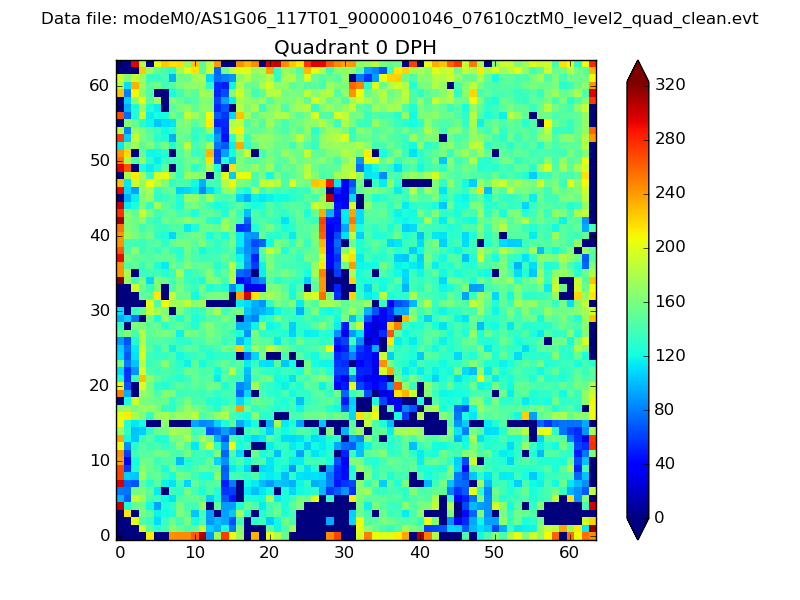 |
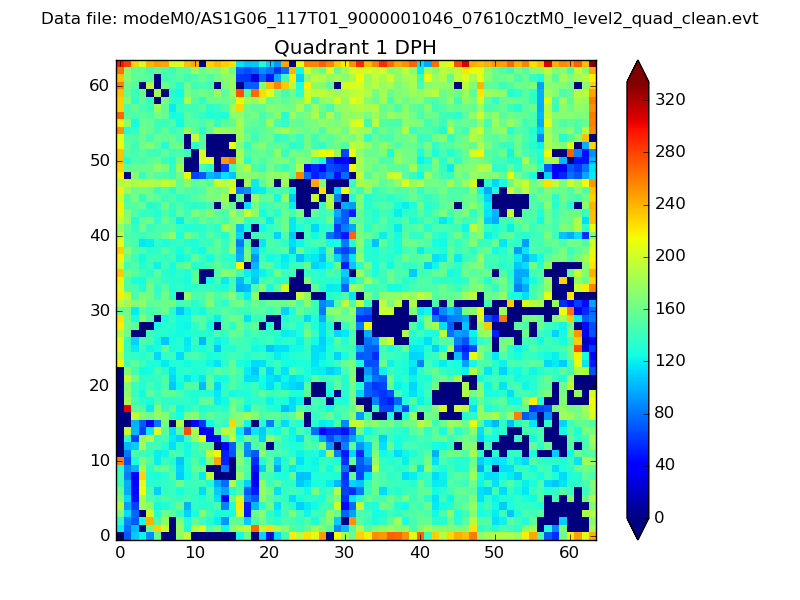 |
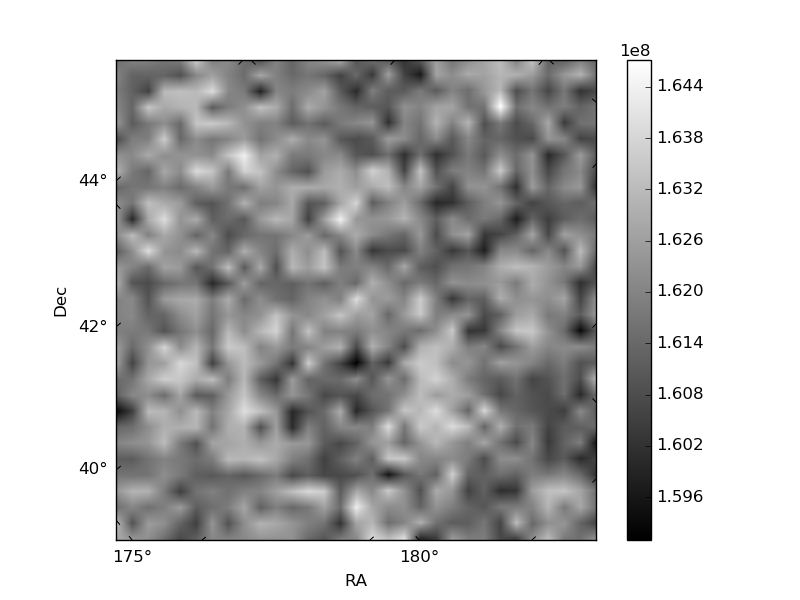
Quadrant B |
|---|---|---|---|
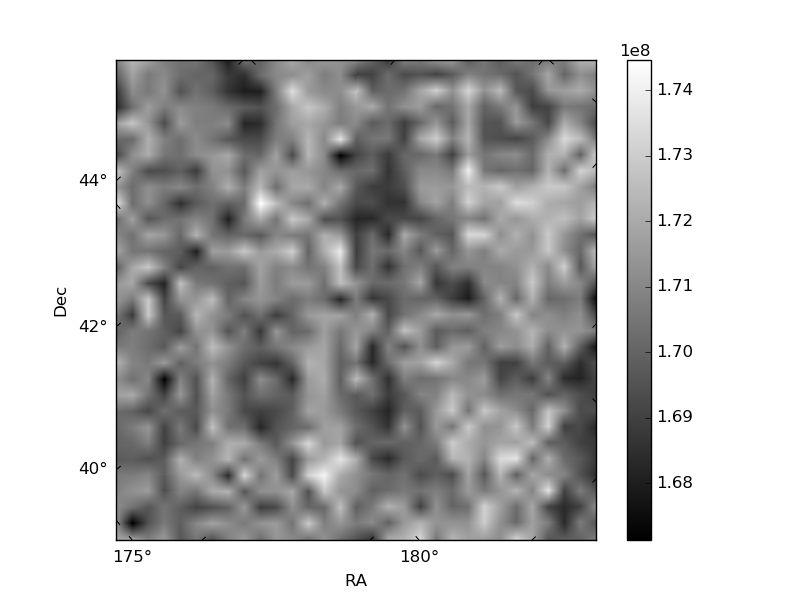
| Quadrant D | 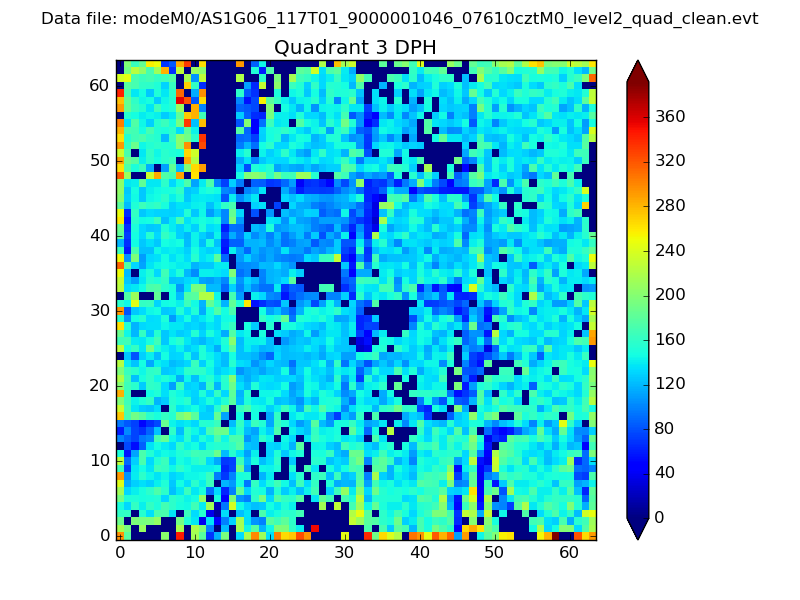 |
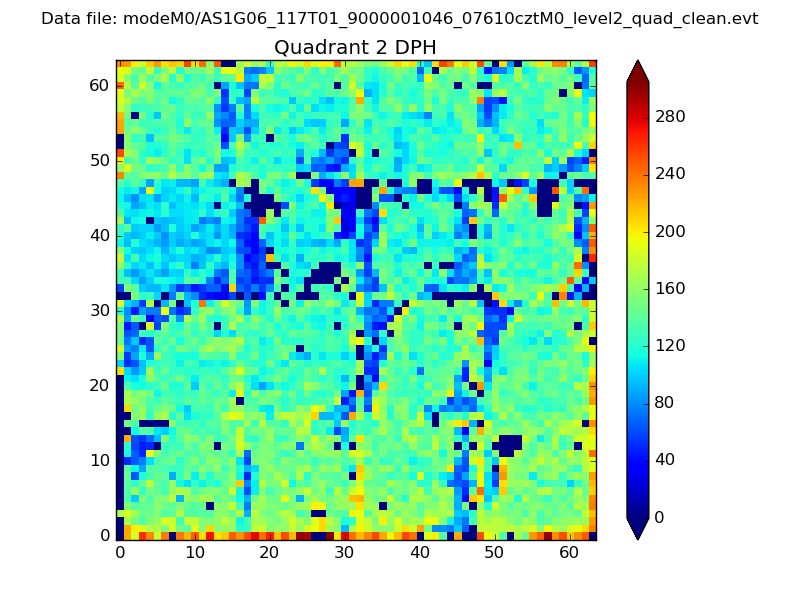 |
Quadrant C |
| Plot type | Count rate plots | Images |
|---|---|---|
| Comparison with Poisson distribution Blue bars denote a histogram of data divided into 1 sec bins. Red curve is a Poisson curve with rate = median count rate of data. |
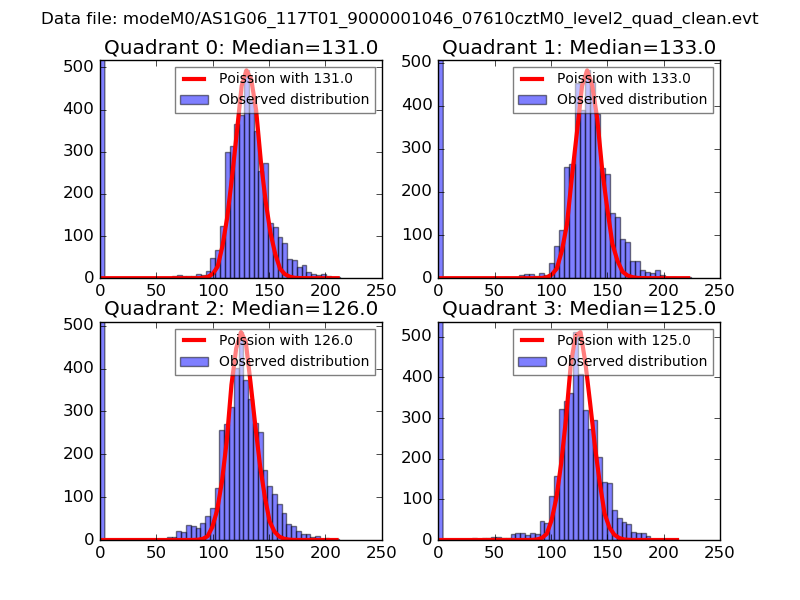 |
 |
| Quadrant-wise count rates Data is divided into 100 sec bins |
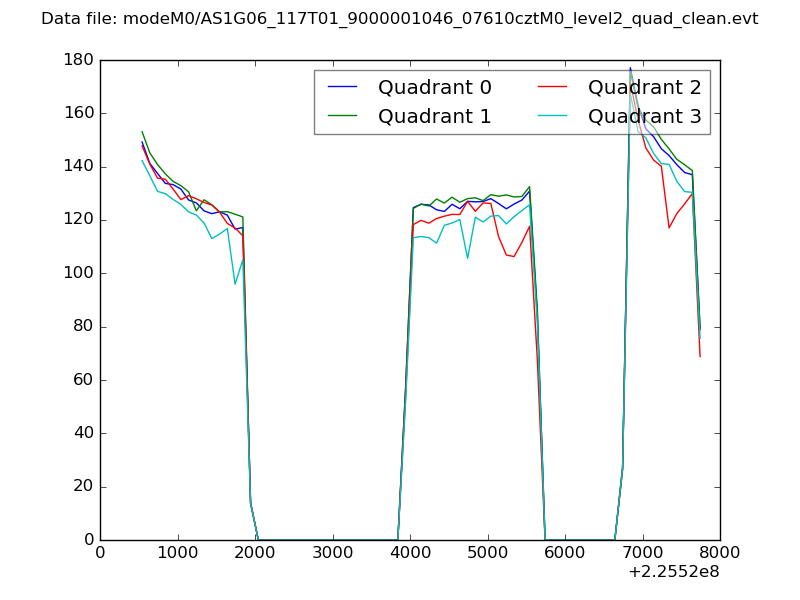 |
|
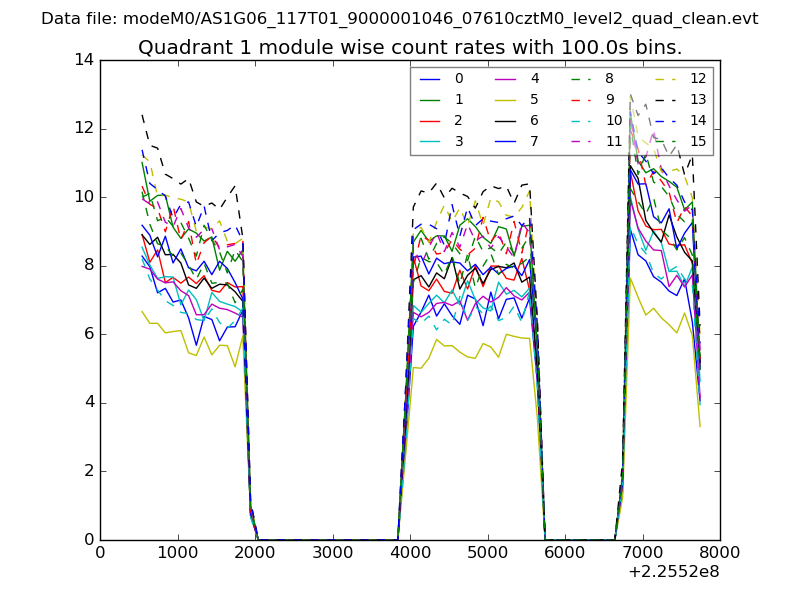
| Module-wise count rates for Quadrant A Data is divided into 100 sec bins |
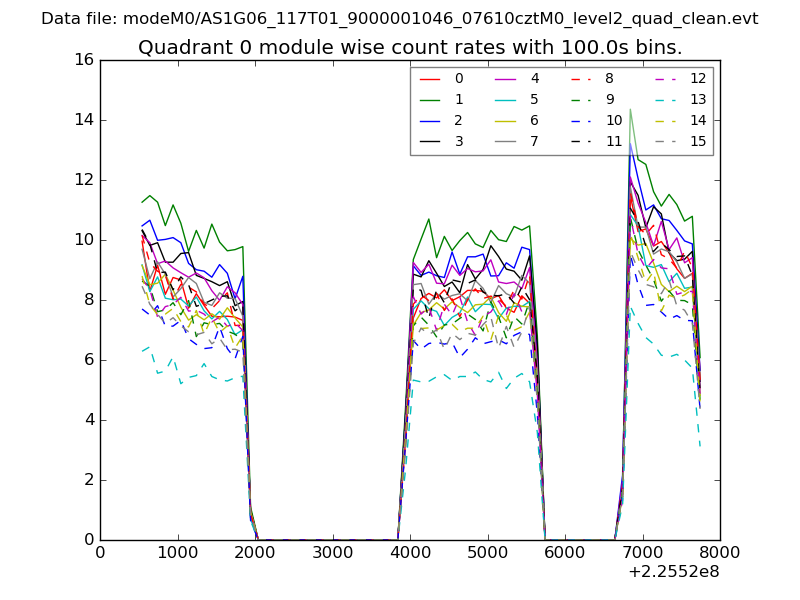 |
 |
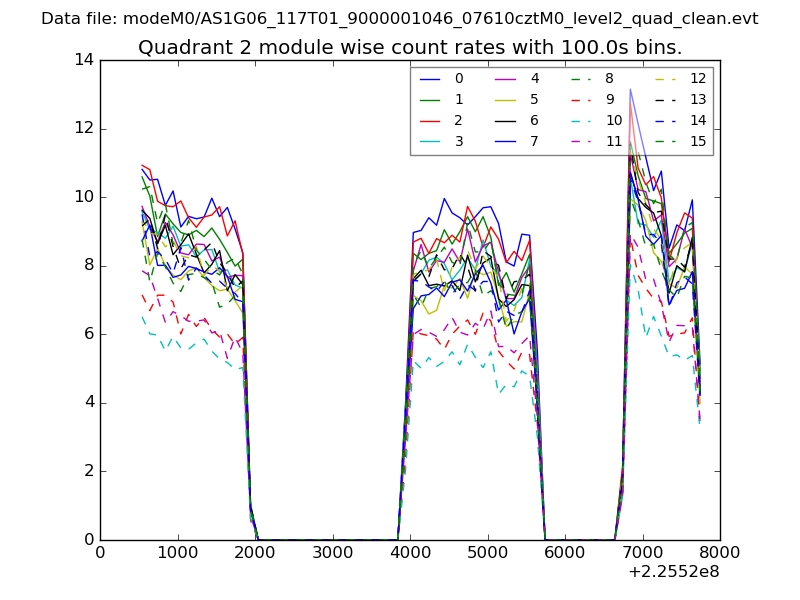
| Module-wise count rates for Quadrant B Data is divided into 100 sec bins |
 |
 |
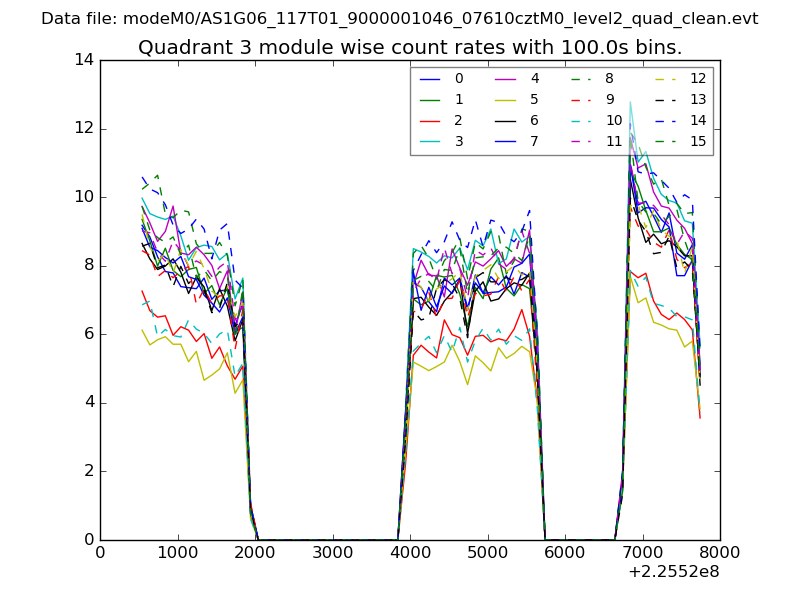
| Module-wise count rates for Quadrant C Data is divided into 100 sec bins |
 |
 |
| Module-wise count rates for Quadrant D Data is divided into 100 sec bins |
 |
 |
| Parameter | Plot |
|---|---|
| CZT HV Monitor | 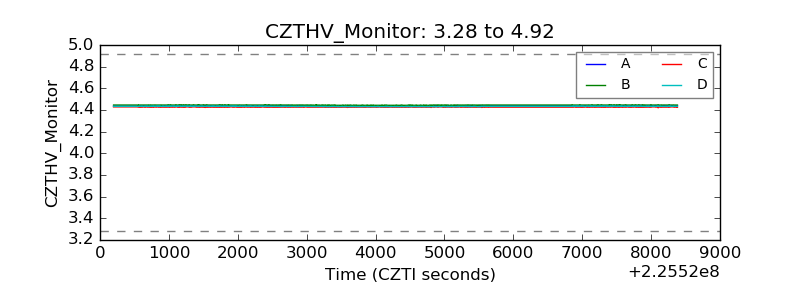 |
| D_VDD |  |
| Temperature 1 |  |
| Veto HV Monitor | 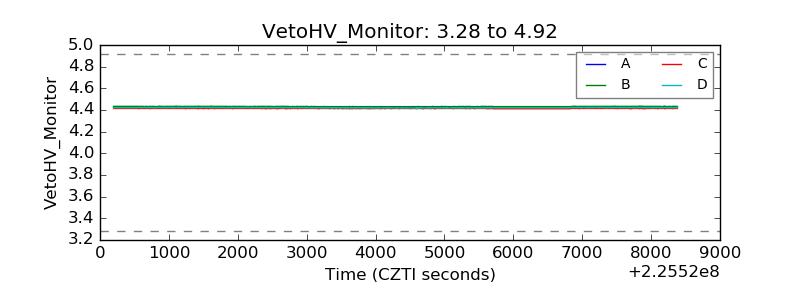 |
| Veto LLD | 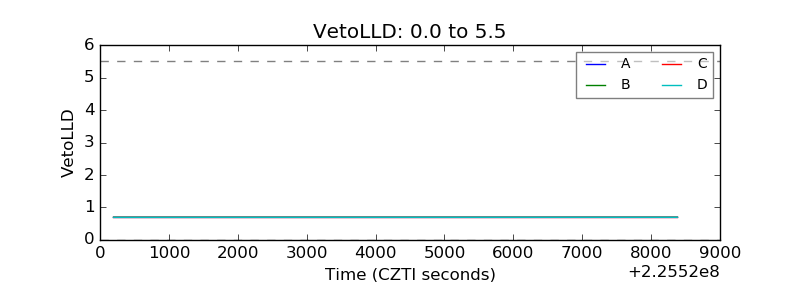 |
| Alpha Counter |  |
| _CPM_Rate | 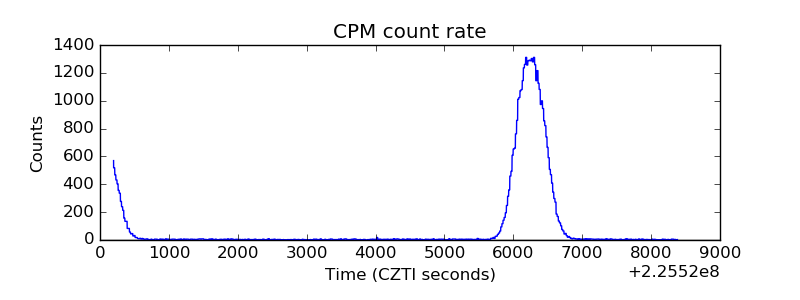 |
| CZT Counter | 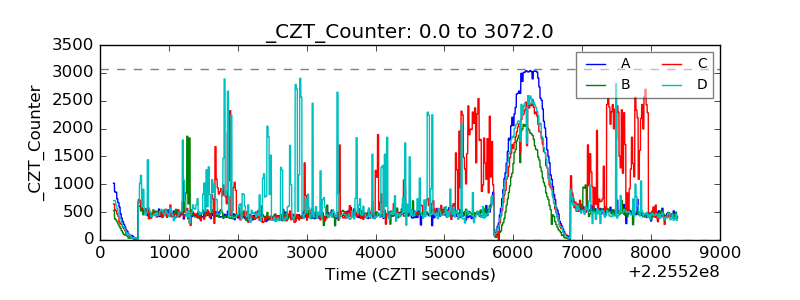 |
| +2.5 Volts monitor |  |
| +5 Volts monitor |  |
| _ROLL_ROT | 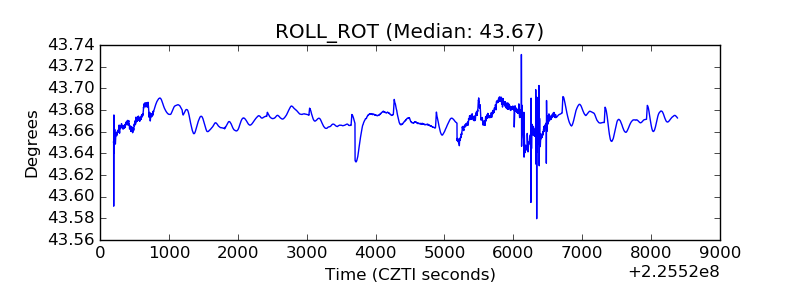 |
| _Roll_DEC | 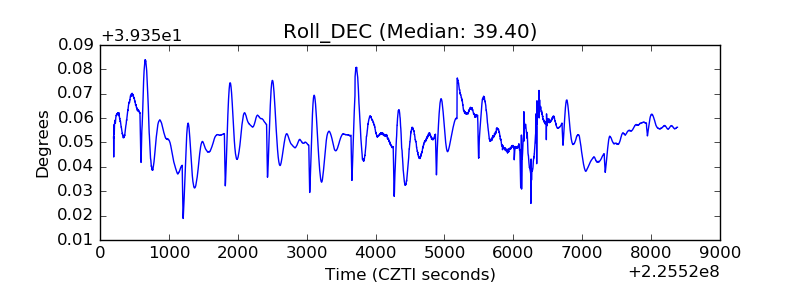 |
| _Roll_RA | 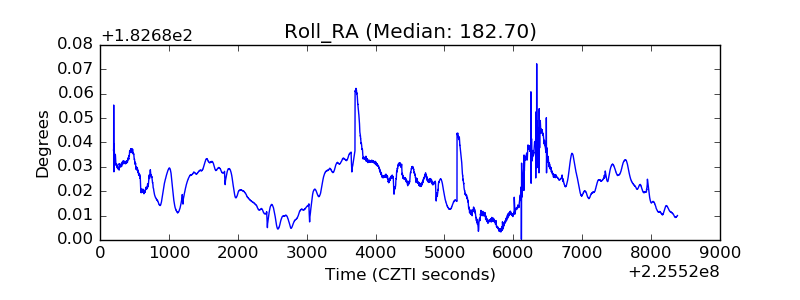 |
| Veto Counter | 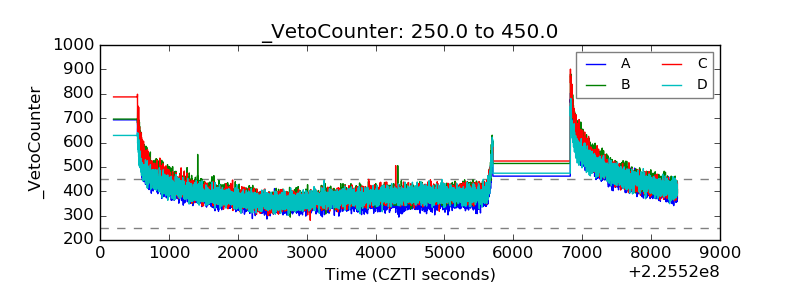 |