| Param | Original file | Final file |
|---|---|---|
| Filename | modeM0/AS1G06_117T01_9000001046_07611cztM0_level2.evt | modeM0/AS1G06_117T01_9000001046_07611cztM0_level2_quad_clean.evt |
| Size (bytes) | 502,686,720 | 80,009,280 |
| Size | 479.4 MB | 76.3 MB |
| Events in quadrant A | 3,276,090 | 499,242 |
| Events in quadrant B | 3,187,469 | 509,732 |
| Events in quadrant C | 4,770,813 | 485,763 |
| Events in quadrant D | 3,552,753 | 479,142 |
| Mode SS | |||
|---|---|---|---|
| Quadrant | BADHDUFLAG | Total packets | Discarded packets |
| A | 0 | 130 | 0 |
| B | 0 | 130 | 0 |
| C | 0 | 130 | 0 |
| D | 0 | 130 | 0 |
| Mode M0 | |||
|---|---|---|---|
| Quadrant | BADHDUFLAG | Total packets | Discarded packets |
| A | 0 | 13769 | 3 |
| B | 0 | 13425 | 2 |
| C | 0 | 18365 | 2 |
| D | 0 | 14886 | 2 |
| Mode M9 | |||
|---|---|---|---|
| Quadrant | BADHDUFLAG | Total packets | Discarded packets |
| A | 0 | 12 | 0 |
| B | 0 | 12 | 0 |
| C | 0 | 12 | 0 |
| D | 0 | 12 | 0 |
| Quadrant | Total seconds | Saturated seconds | Saturation percentage |
|---|---|---|---|
| A | 6434 | 81 | 1.258937% |
| B | 6434 | 89 | 1.383276% |
| C | 6434 | 496 | 7.709046% |
| D | 6434 | 201 | 3.124029% |
Noise dominated data is calculated using 1-second bins in cleaned event files. If a bin has >2000 counts, and if more than 50% of those come from <1% of pixels, then it is considered to be noise-dominated and hence unusable.
| Quadrant | # 1 sec bins | Bins with >0 counts | Bins with >2000 counts | High rate bins dominated by noise | Noise dominated (total time) | Noise dominated (detector-on time) | Marked lightcurve |
|---|---|---|---|---|---|---|---|
| A | 7619 | 6435 | 0 | 0 | 0.00% | 0.00% | 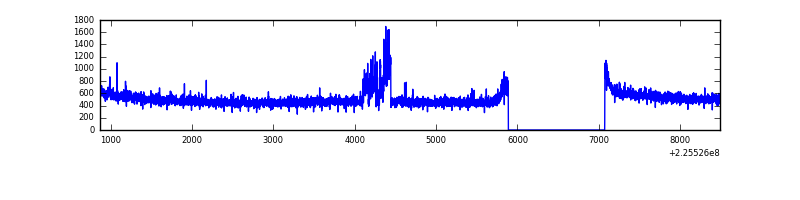 |
| B | 7619 | 6434 | 1 | 1 | 0.01% | 0.02% | 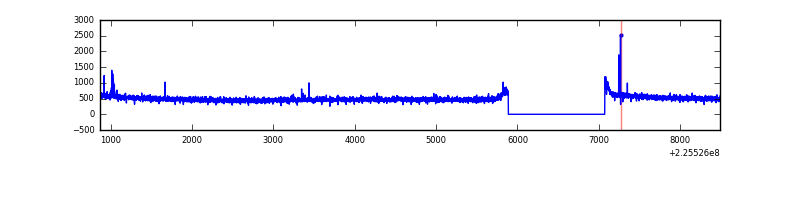 |
| C | 7619 | 6435 | 401 | 401 | 5.26% | 6.23% | 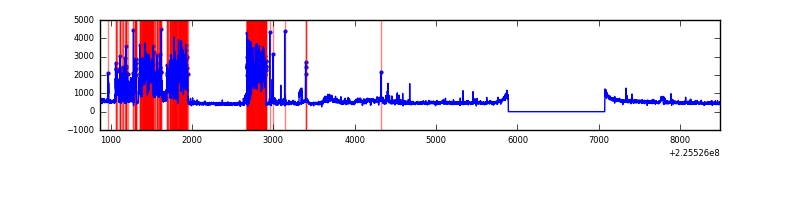 |
| D | 7619 | 6435 | 109 | 109 | 1.43% | 1.69% |  |
Top three noisy pixels from each quadrant. If the there are fewer than three noisy pixels in the level2.evt file, extra rows are filled as -1
| Pixel properties | Quadrant properties | ||||||
|---|---|---|---|---|---|---|---|
| Quadrant | DetID | PixID | Counts | Sigma | Mean | Median | Sigma |
| A | 0 | 128 | 121823 | 728.69 | 818 | 803 | 166.1 |
| A | 0 | 226 | 7856 | 42.47 | 818 | 803 | 166.1 |
| A | 12 | 194 | 7130 | 38.1 | 818 | 803 | 166.1 |
| B | 12 | 111 | 16608 | 102.68 | 814 | 796 | 154.0 |
| B | 4 | 81 | 15003 | 92.26 | 814 | 796 | 154.0 |
| B | 11 | 111 | 12984 | 79.15 | 814 | 796 | 154.0 |
| C | 9 | 68 | 1726604 | 9803.2 | 767 | 771 | 176.0 |
| C | 4 | 254 | 48074 | 268.69 | 767 | 771 | 176.0 |
| C | 13 | 61 | 5802 | 28.58 | 767 | 771 | 176.0 |
| D | 13 | 104 | 441464 | 2325.72 | 781 | 758 | 189.5 |
| D | 2 | 136 | 85214 | 445.7 | 781 | 758 | 189.5 |
| D | 2 | 152 | 53744 | 279.62 | 781 | 758 | 189.5 |
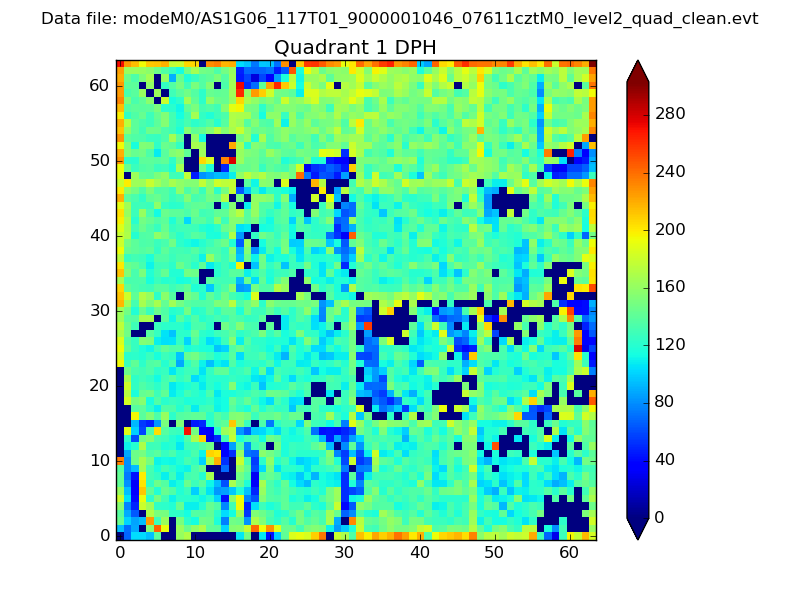
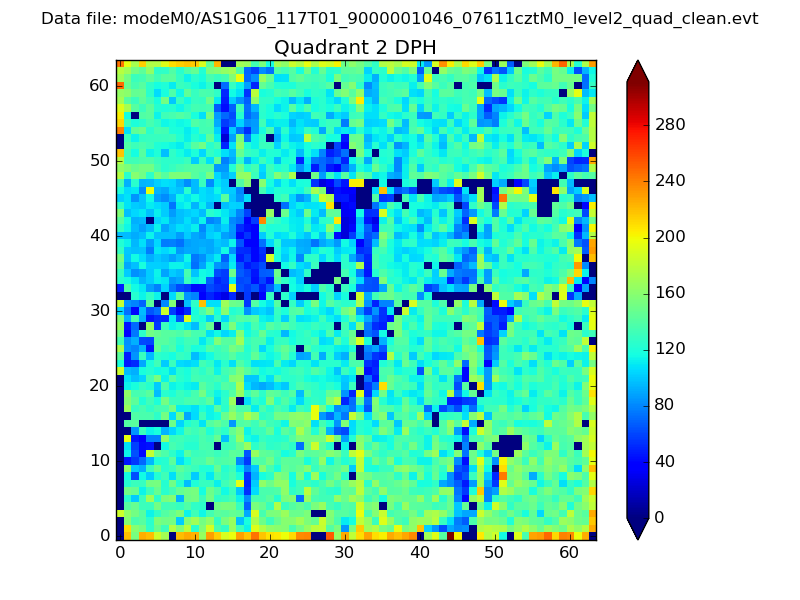
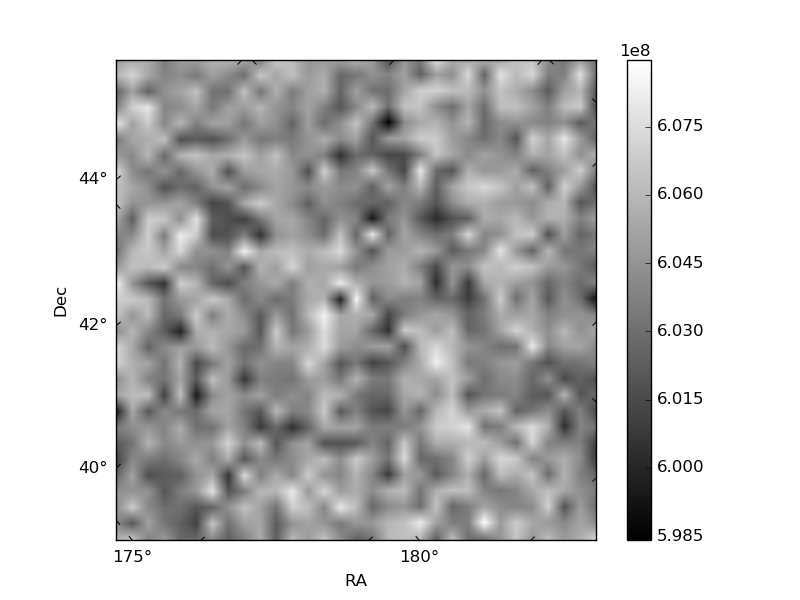
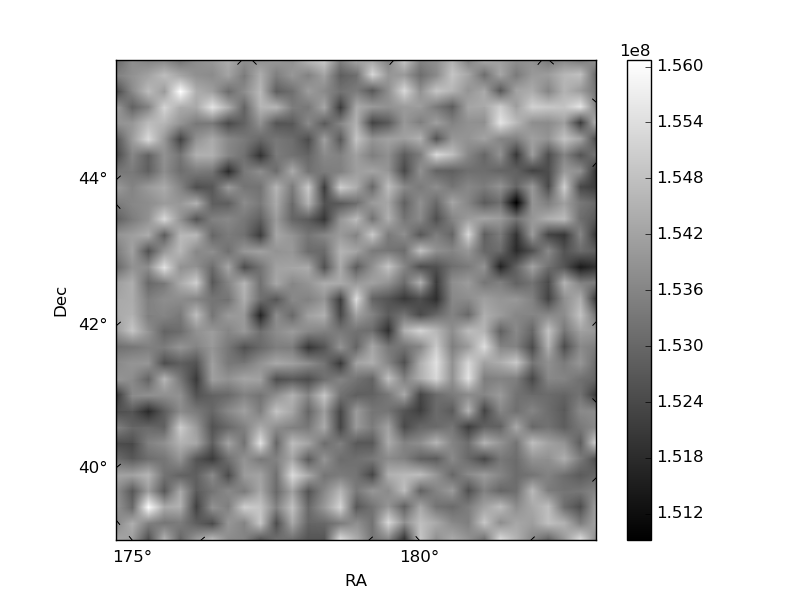
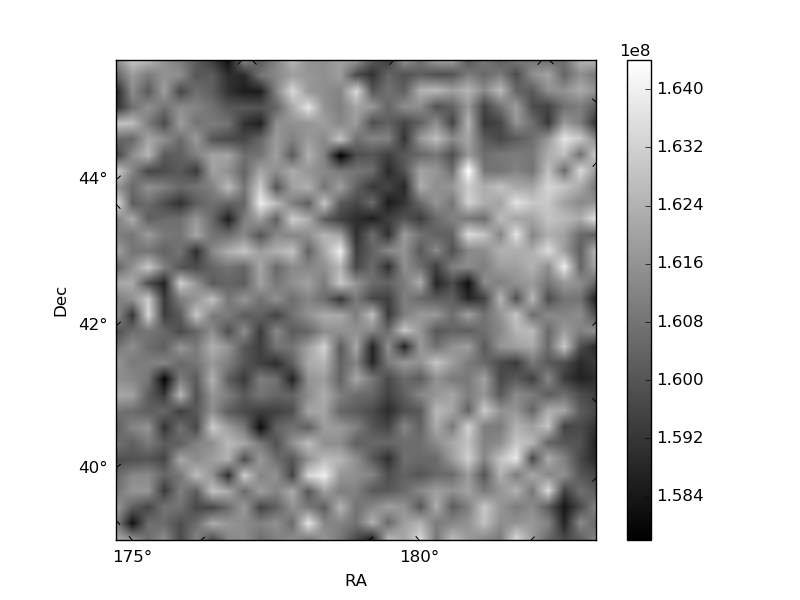
Histogram calculated using DETX and DETY for each event in the final _common_clean file
| Quadrant A | 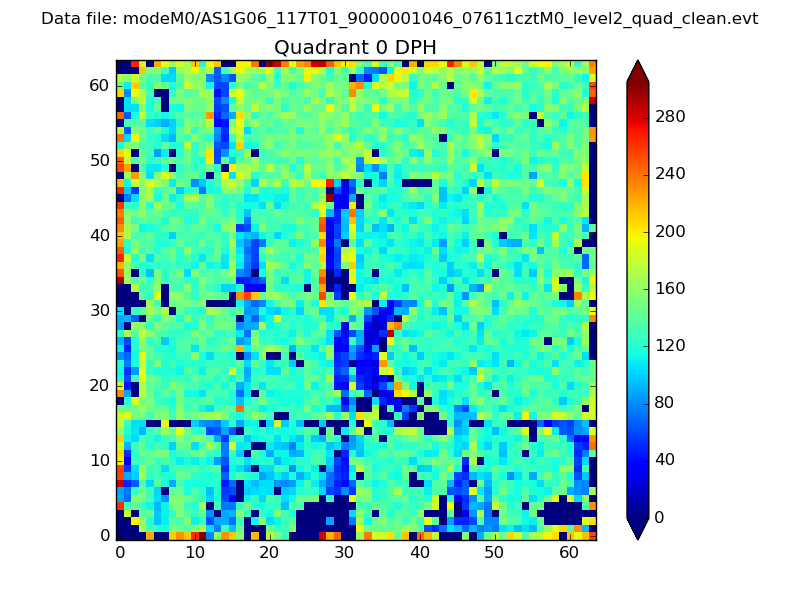 |
 |
Quadrant B |
|---|---|---|---|
| Quadrant D | 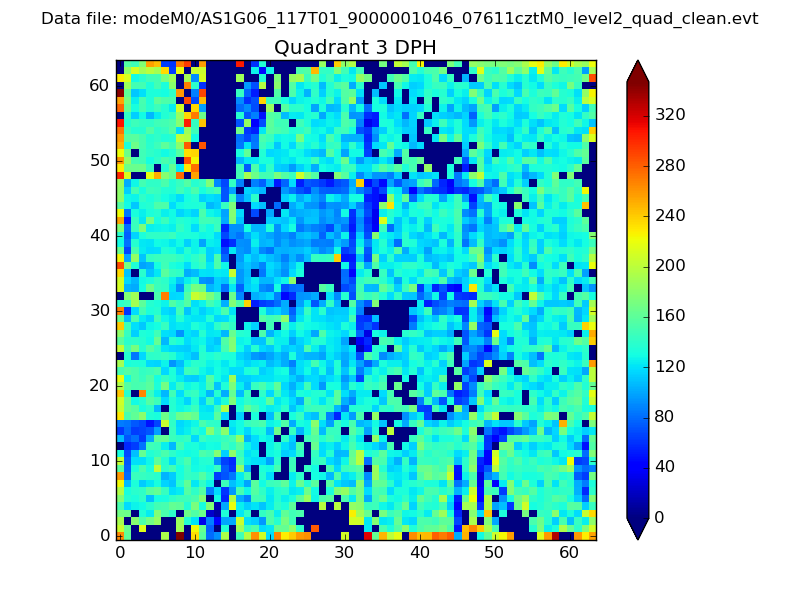 |
 |
Quadrant C |
| Plot type | Count rate plots | Images |
|---|---|---|
| Comparison with Poisson distribution Blue bars denote a histogram of data divided into 1 sec bins. Red curve is a Poisson curve with rate = median count rate of data. |
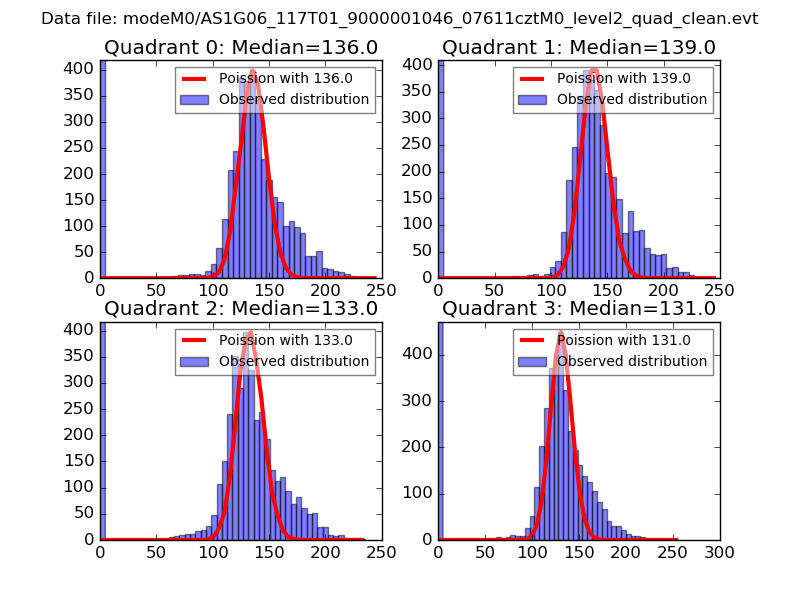 |
 |
| Quadrant-wise count rates Data is divided into 100 sec bins |
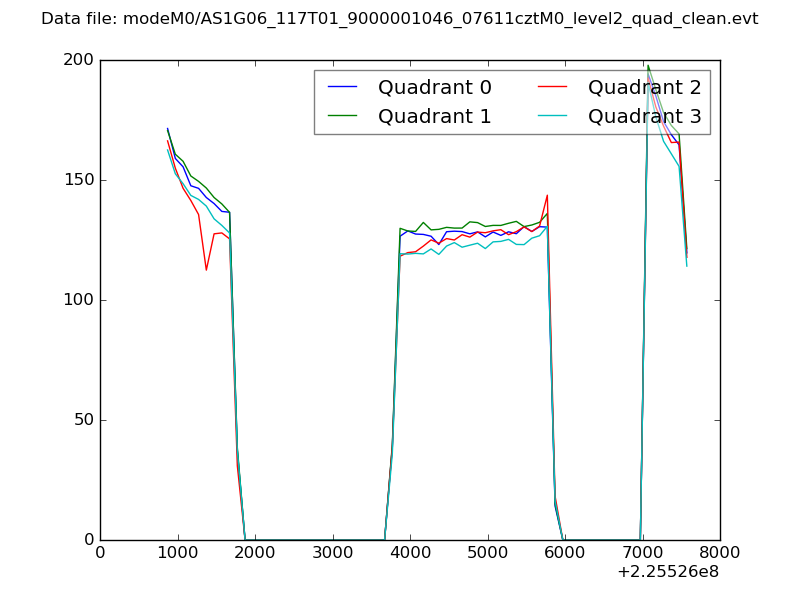 |
|
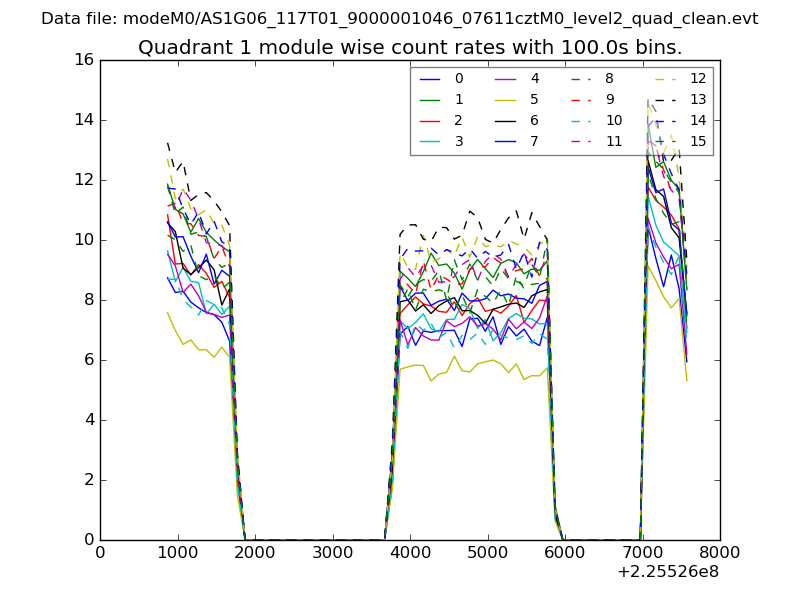
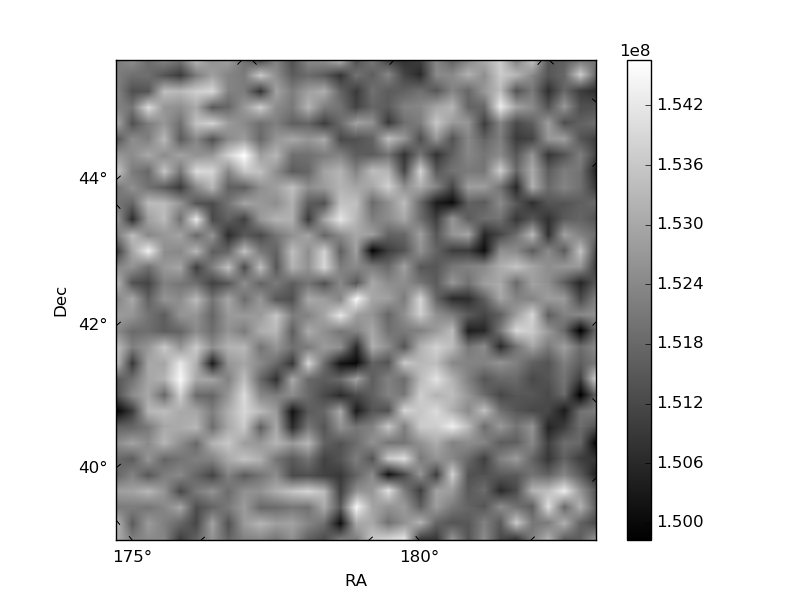
| Module-wise count rates for Quadrant A Data is divided into 100 sec bins |
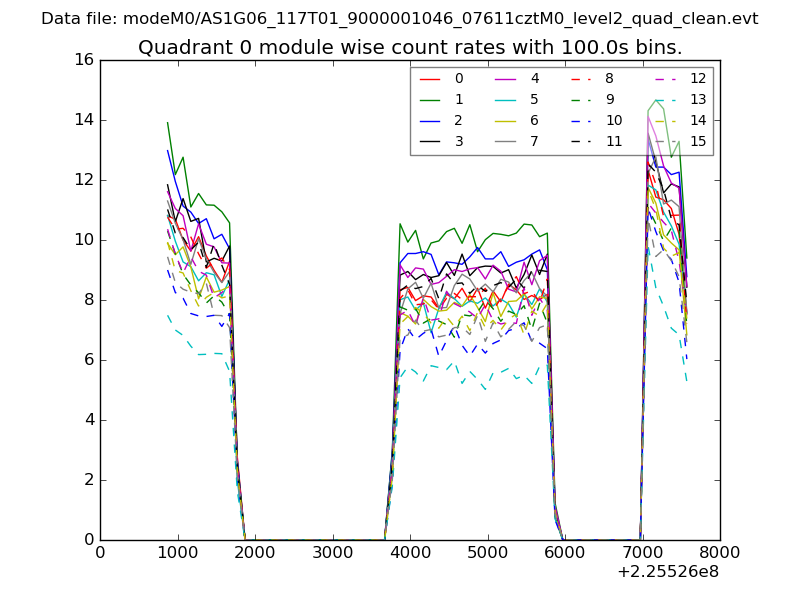 |
 |
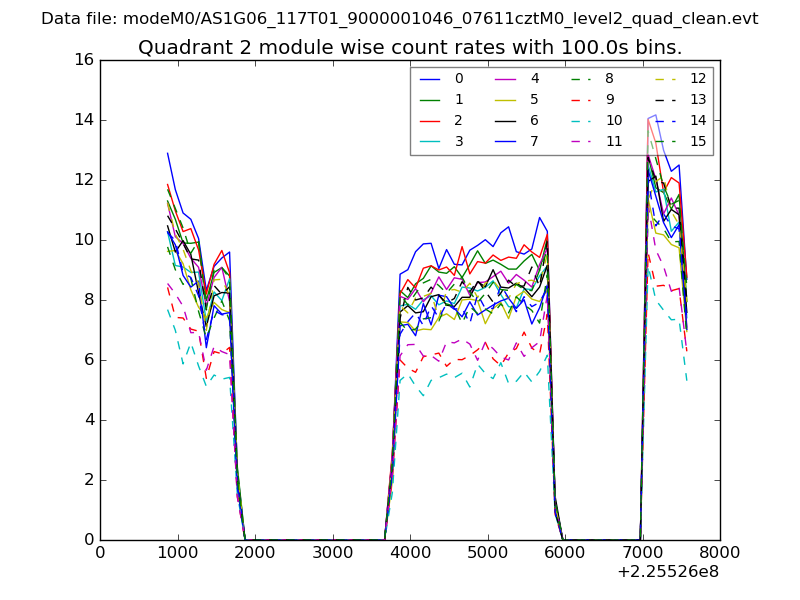
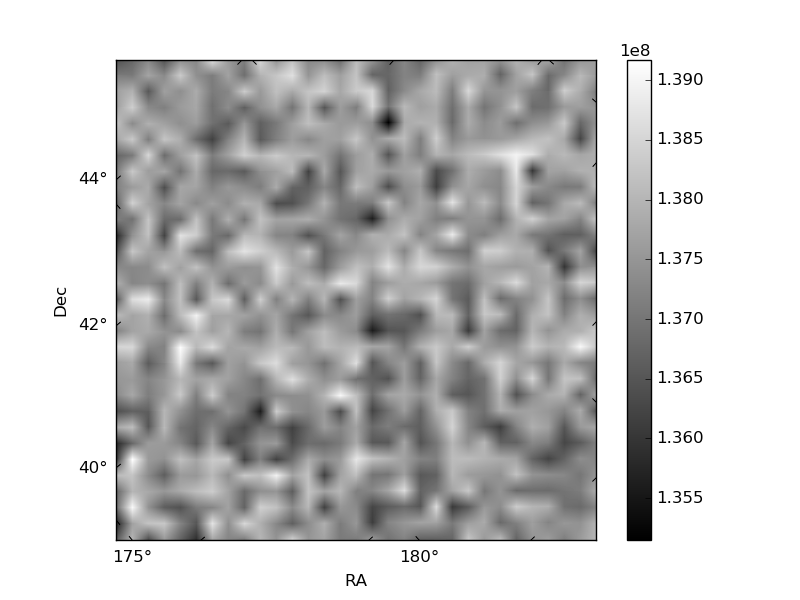
| Module-wise count rates for Quadrant B Data is divided into 100 sec bins |
 |
 |
| Module-wise count rates for Quadrant C Data is divided into 100 sec bins |
 |
 |
| Module-wise count rates for Quadrant D Data is divided into 100 sec bins |
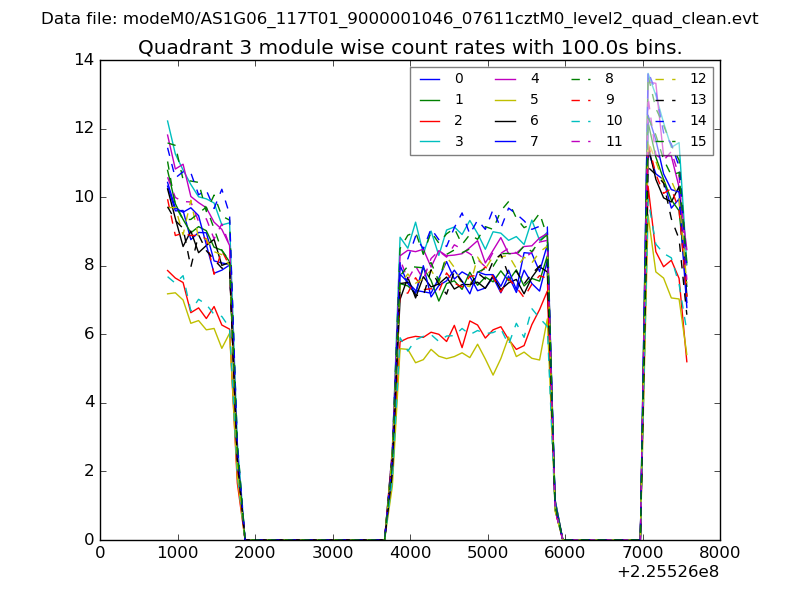 |
 |
| Parameter | Plot |
|---|---|
| CZT HV Monitor | 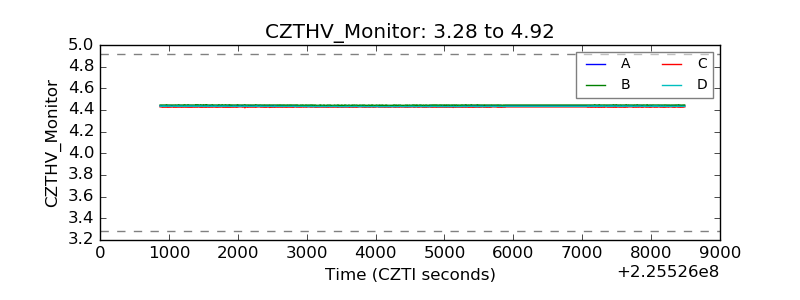 |
| D_VDD | 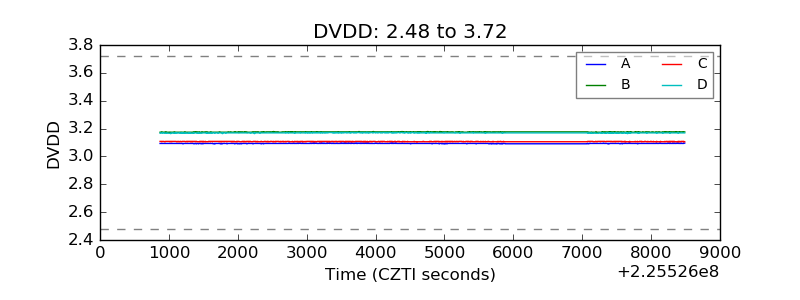 |
| Temperature 1 | 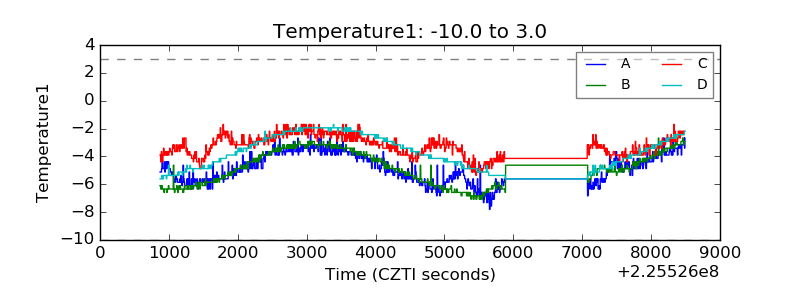 |
| Veto HV Monitor | 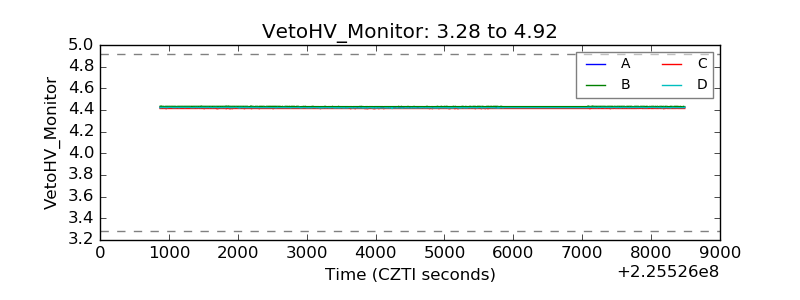 |
| Veto LLD | 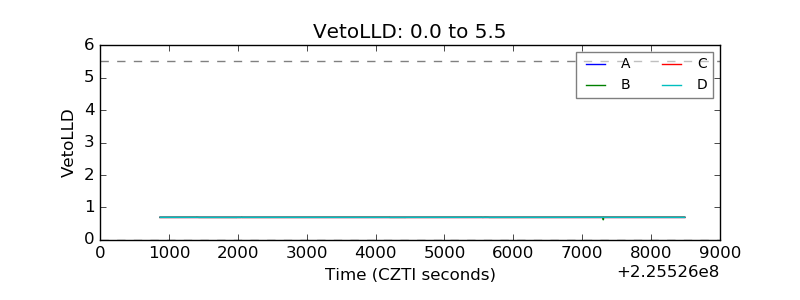 |
| Alpha Counter | 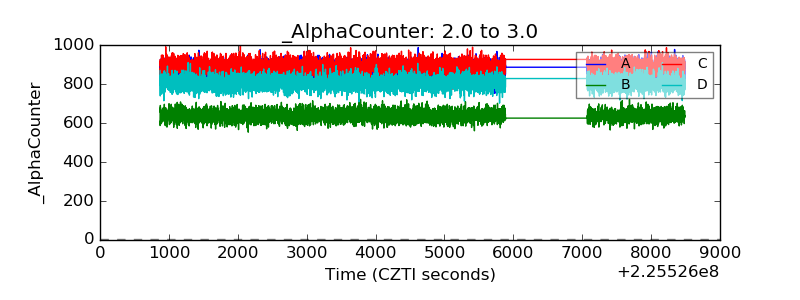 |
| _CPM_Rate | 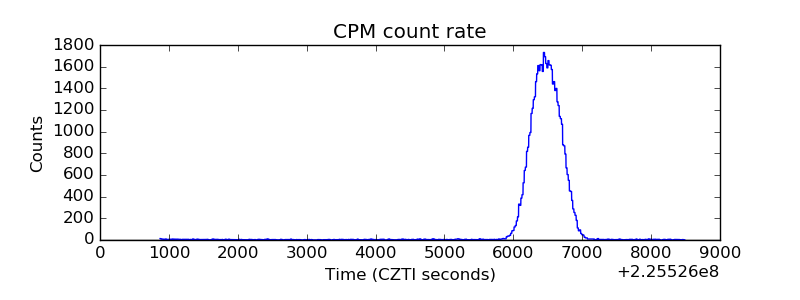 |
| CZT Counter | 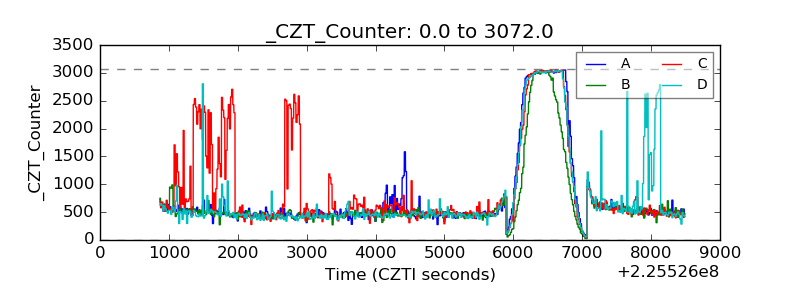 |
| +2.5 Volts monitor |  |
| +5 Volts monitor |  |
| _ROLL_ROT | 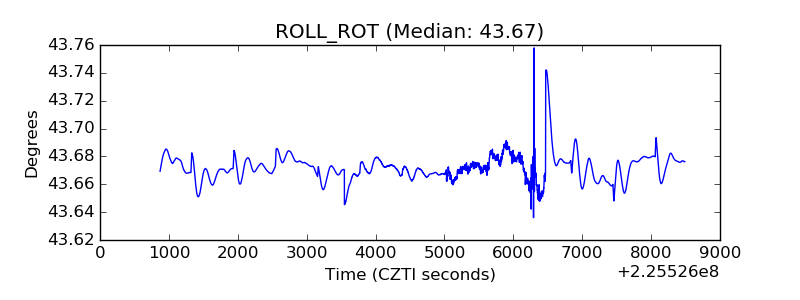 |
| _Roll_DEC | 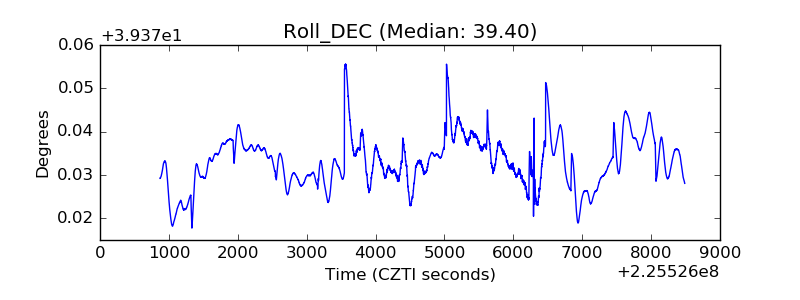 |
| _Roll_RA | 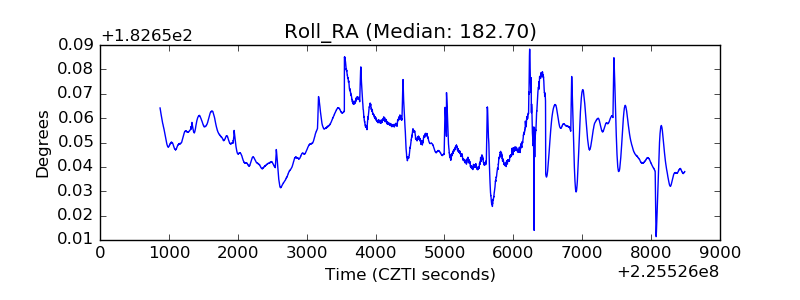 |
| Veto Counter | 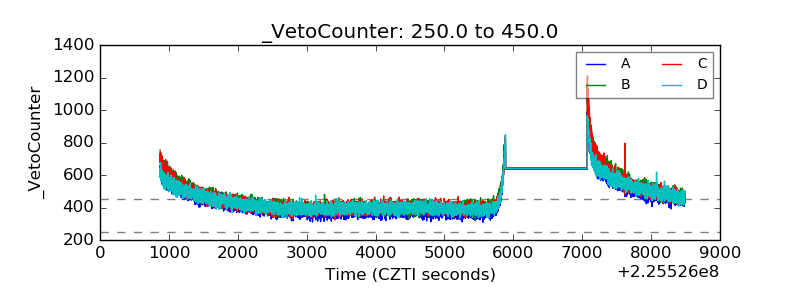 |