| Param | Original file | Final file |
|---|---|---|
| Filename | modeM0/AS1G06_117T01_9000001046_07612cztM0_level2.evt | modeM0/AS1G06_117T01_9000001046_07612cztM0_level2_quad_clean.evt |
| Size (bytes) | 267,837,120 | 35,216,640 |
| Size | 255.4 MB | 33.6 MB |
| Events in quadrant A | 1,728,763 | 210,982 |
| Events in quadrant B | 1,835,474 | 212,206 |
| Events in quadrant C | 1,869,030 | 203,580 |
| Events in quadrant D | 2,441,988 | 194,110 |
| Mode SS | |||
|---|---|---|---|
| Quadrant | BADHDUFLAG | Total packets | Discarded packets |
| A | 0 | 68 | 0 |
| B | 0 | 68 | 0 |
| C | 0 | 68 | 0 |
| D | 0 | 68 | 0 |
| Mode M0 | |||
|---|---|---|---|
| Quadrant | BADHDUFLAG | Total packets | Discarded packets |
| A | 0 | 7177 | 2 |
| B | 0 | 7476 | 0 |
| C | 0 | 7760 | 0 |
| D | 0 | 9560 | 0 |
| Quadrant | Total seconds | Saturated seconds | Saturation percentage |
|---|---|---|---|
| A | 3459 | 4 | 0.115640% |
| B | 3460 | 7 | 0.202312% |
| C | 3460 | 9 | 0.260116% |
| D | 3460 | 195 | 5.635838% |
Noise dominated data is calculated using 1-second bins in cleaned event files. If a bin has >2000 counts, and if more than 50% of those come from <1% of pixels, then it is considered to be noise-dominated and hence unusable.
| Quadrant | # 1 sec bins | Bins with >0 counts | Bins with >2000 counts | High rate bins dominated by noise | Noise dominated (total time) | Noise dominated (detector-on time) | Marked lightcurve |
|---|---|---|---|---|---|---|---|
| A | 3460 | 3460 | 0 | 0 | 0.00% | 0.00% | 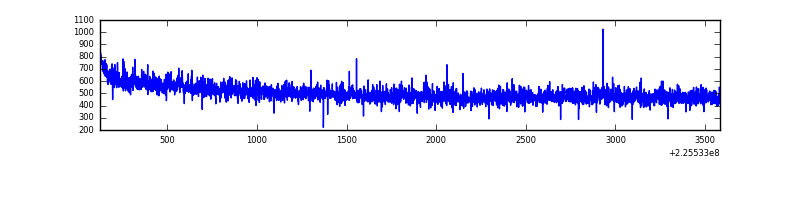 |
| B | 3460 | 3460 | 3 | 3 | 0.09% | 0.09% | 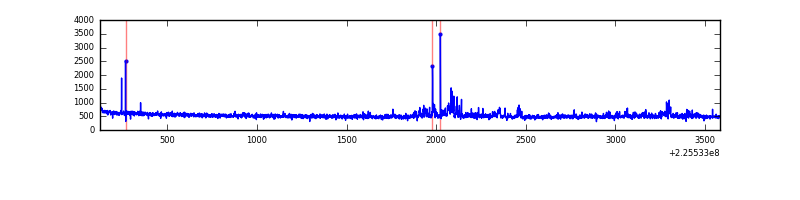 |
| C | 3460 | 3460 | 7 | 7 | 0.20% | 0.20% | 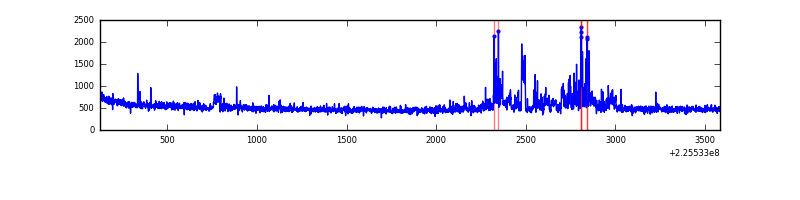 |
| D | 3460 | 3460 | 154 | 154 | 4.45% | 4.45% | 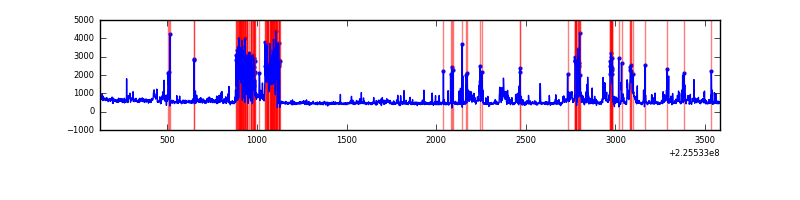 |
Top three noisy pixels from each quadrant. If the there are fewer than three noisy pixels in the level2.evt file, extra rows are filled as -1
| Pixel properties | Quadrant properties | ||||||
|---|---|---|---|---|---|---|---|
| Quadrant | DetID | PixID | Counts | Sigma | Mean | Median | Sigma |
| A | 3 | 1 | 4718 | 47.05 | 448 | 441 | 90.9 |
| A | 0 | 226 | 4346 | 42.95 | 448 | 441 | 90.9 |
| A | 12 | 194 | 3830 | 37.28 | 448 | 441 | 90.9 |
| B | 0 | 229 | 74545 | 886.22 | 442 | 433 | 83.6 |
| B | 0 | 214 | 14958 | 173.69 | 442 | 433 | 83.6 |
| B | 4 | 81 | 10569 | 121.2 | 442 | 433 | 83.6 |
| C | 9 | 68 | 137493 | 1419.31 | 420 | 423 | 96.6 |
| C | 4 | 254 | 90313 | 930.78 | 420 | 423 | 96.6 |
| C | 13 | 61 | 3269 | 29.47 | 420 | 423 | 96.6 |
| D | 13 | 104 | 479676 | 4737.65 | 418 | 406 | 101.2 |
| D | 2 | 152 | 200006 | 1973.07 | 418 | 406 | 101.2 |
| D | 2 | 14 | 162231 | 1599.66 | 418 | 406 | 101.2 |
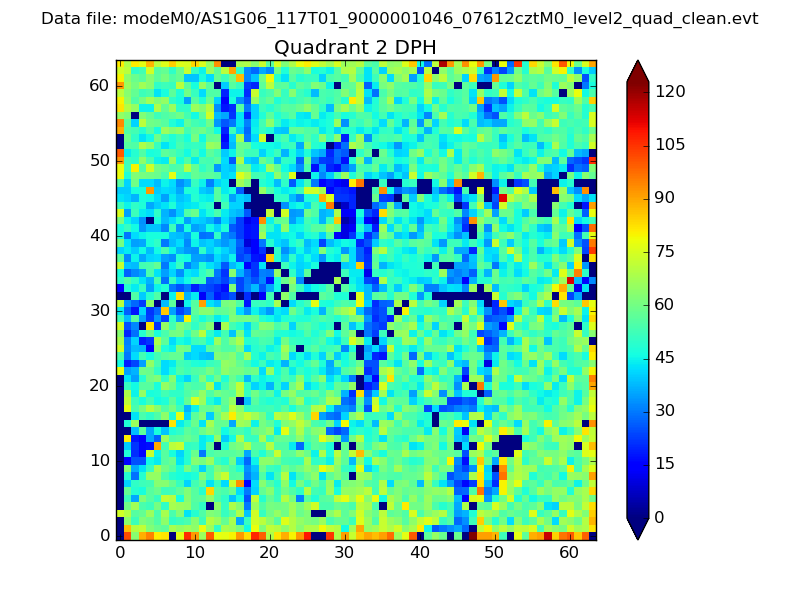
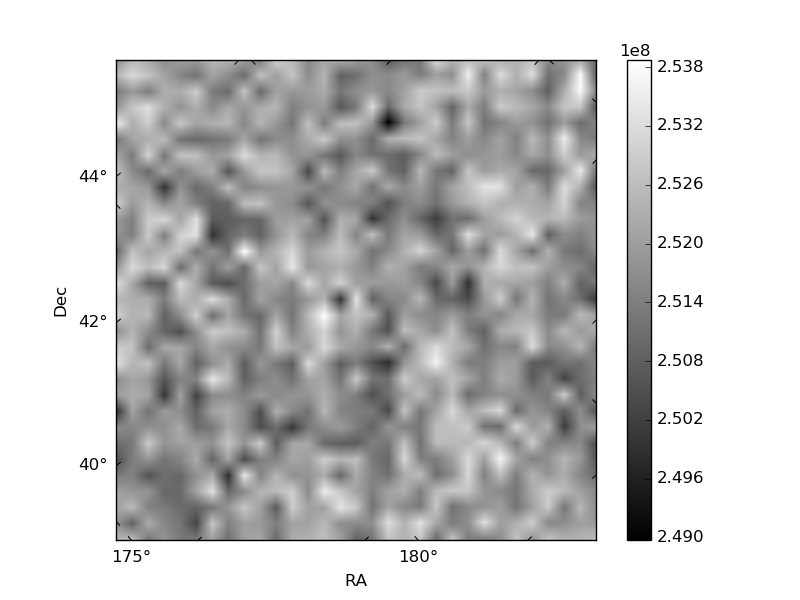
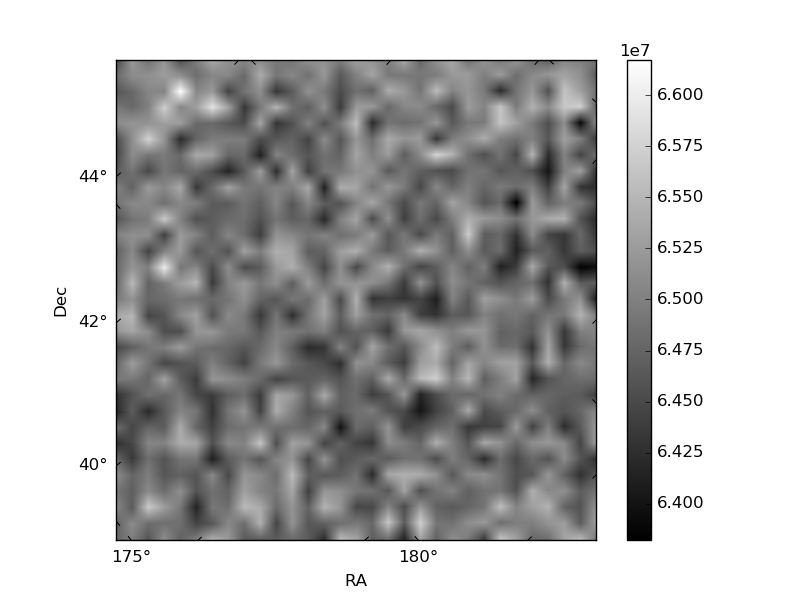
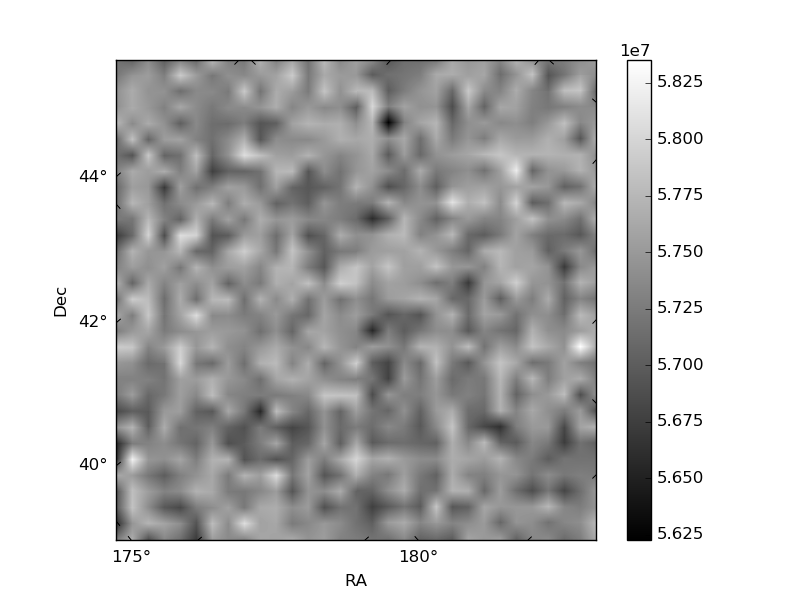
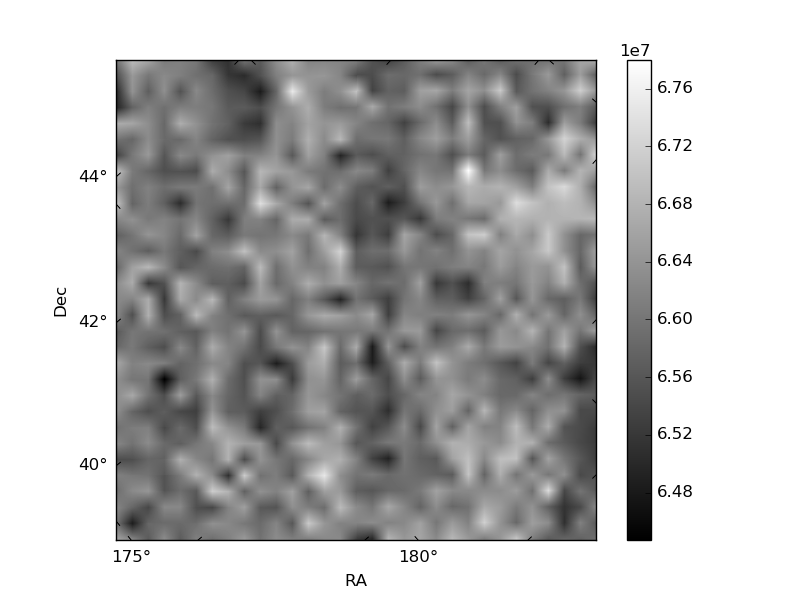
Histogram calculated using DETX and DETY for each event in the final _common_clean file
| Quadrant A | 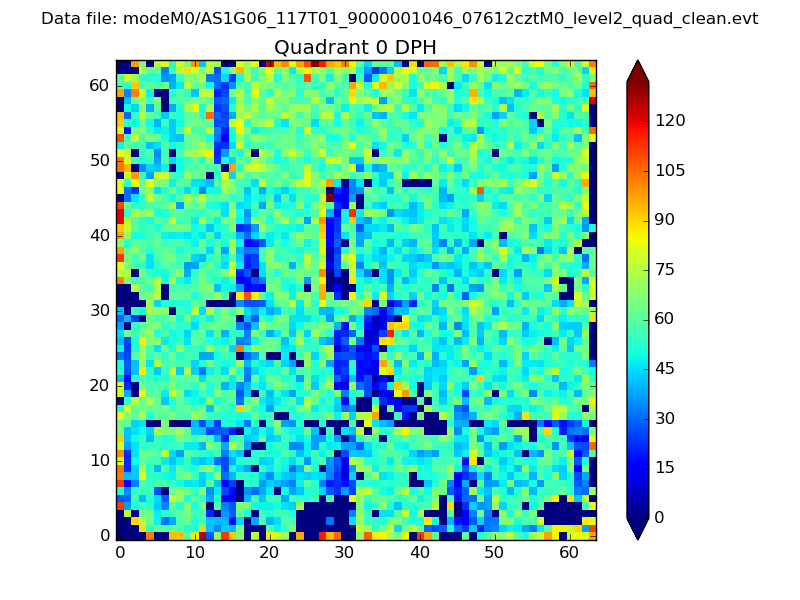 |
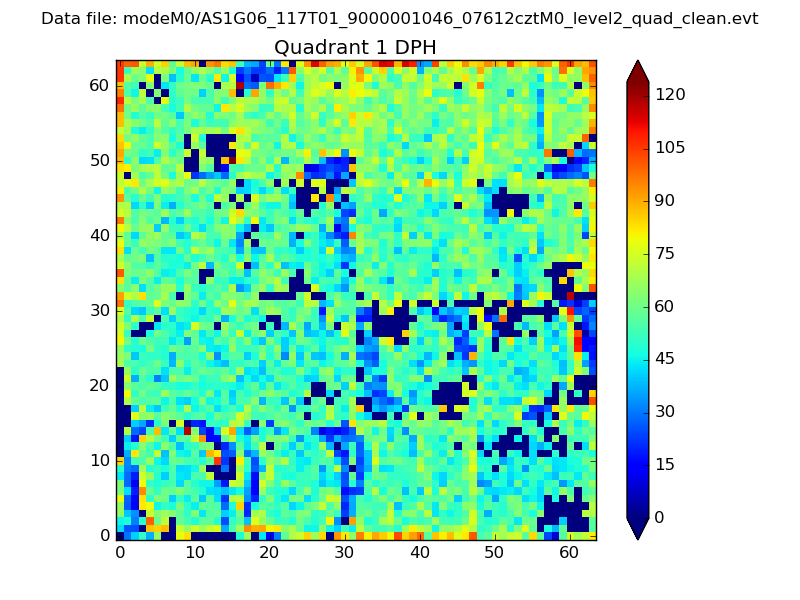 |
Quadrant B |
|---|---|---|---|
| Quadrant D | 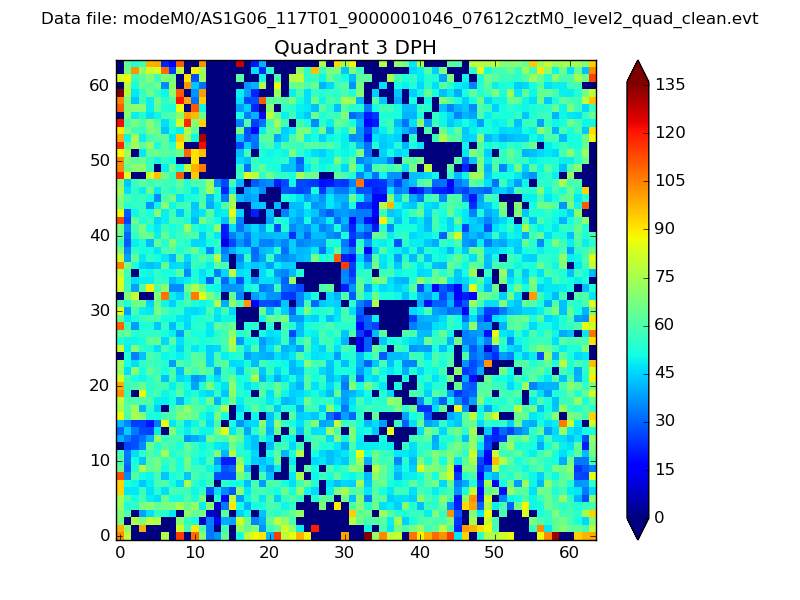 |
 |
Quadrant C |
| Plot type | Count rate plots | Images |
|---|---|---|
| Comparison with Poisson distribution Blue bars denote a histogram of data divided into 1 sec bins. Red curve is a Poisson curve with rate = median count rate of data. |
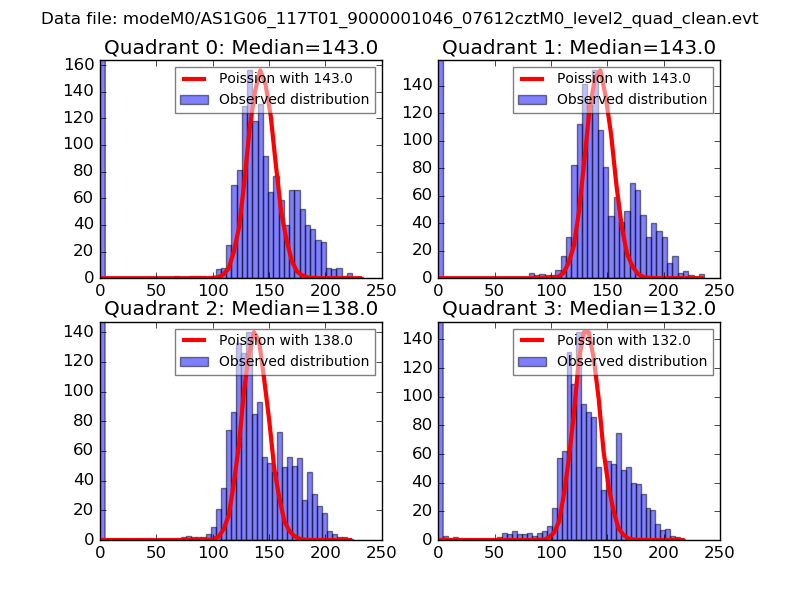 |
 |
| Quadrant-wise count rates Data is divided into 100 sec bins |
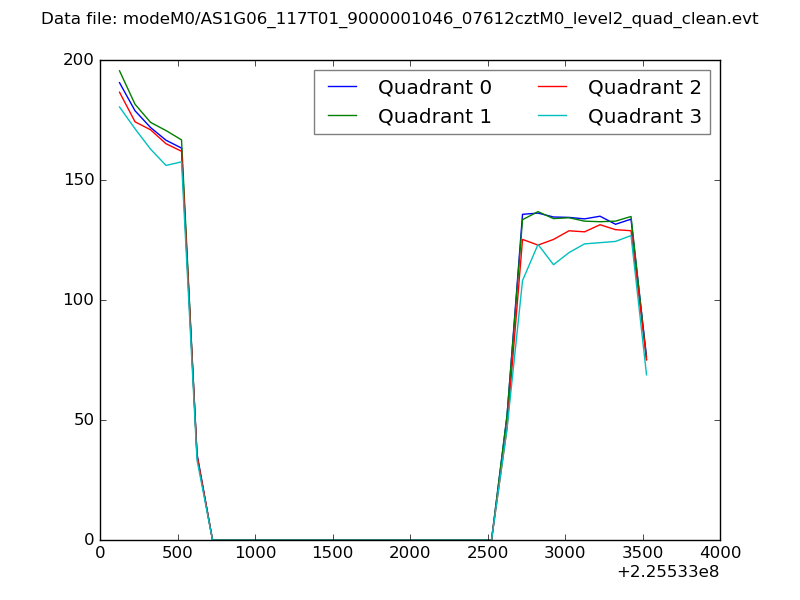 |
|
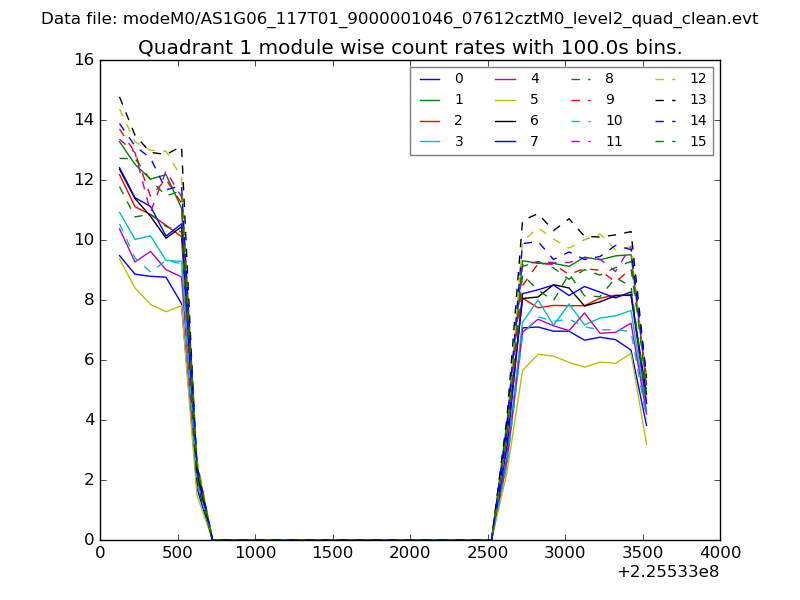
| Module-wise count rates for Quadrant A Data is divided into 100 sec bins |
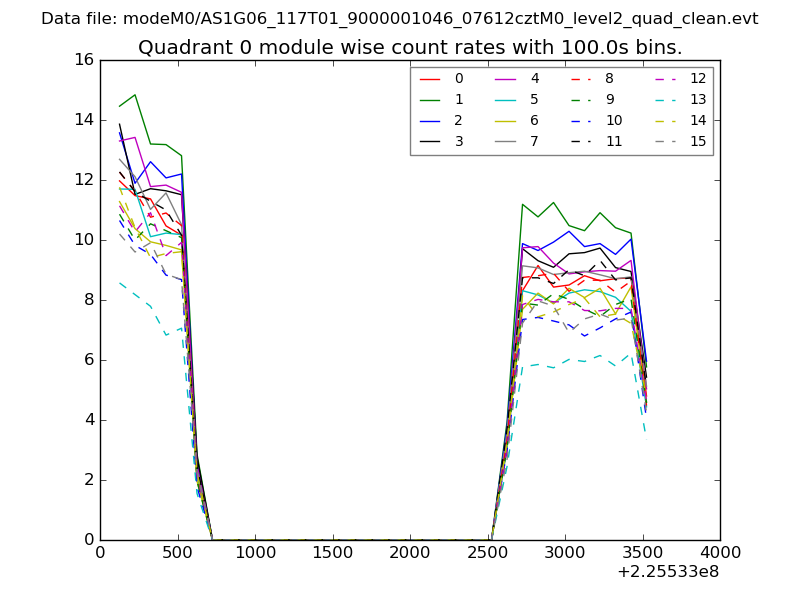 |
 |
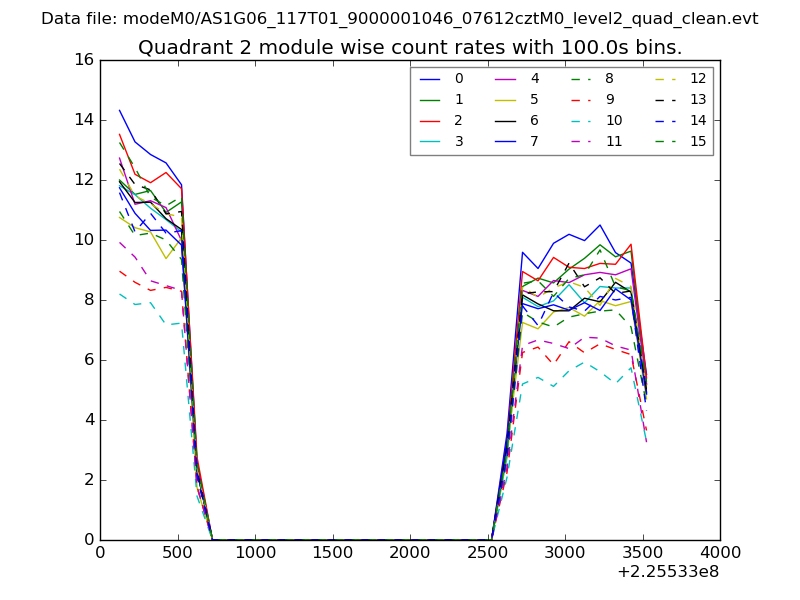
| Module-wise count rates for Quadrant B Data is divided into 100 sec bins |
 |
 |
| Module-wise count rates for Quadrant C Data is divided into 100 sec bins |
 |
 |
| Module-wise count rates for Quadrant D Data is divided into 100 sec bins |
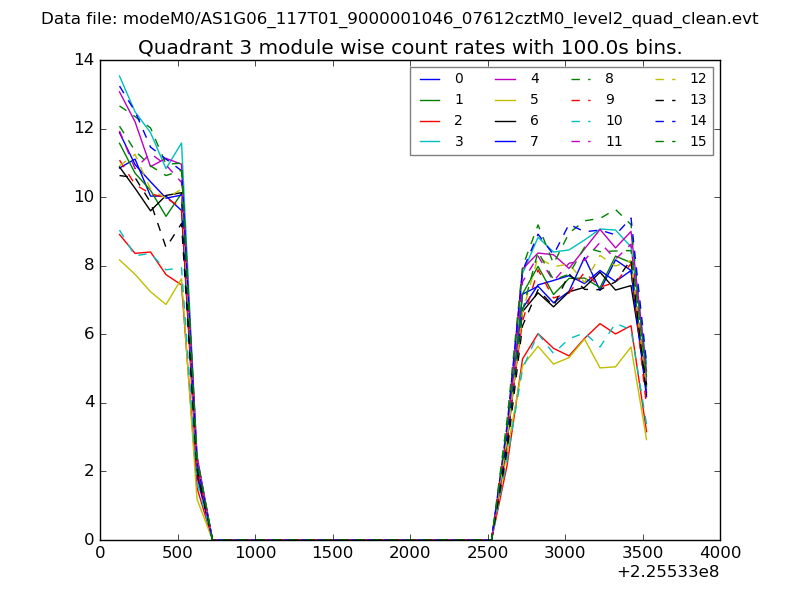 |
 |
| Parameter | Plot |
|---|---|
| CZT HV Monitor | 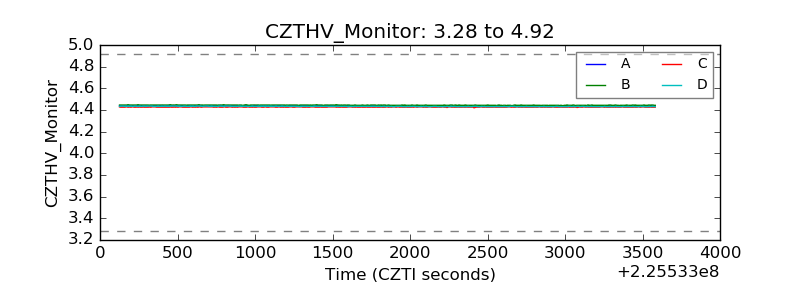 |
| D_VDD | 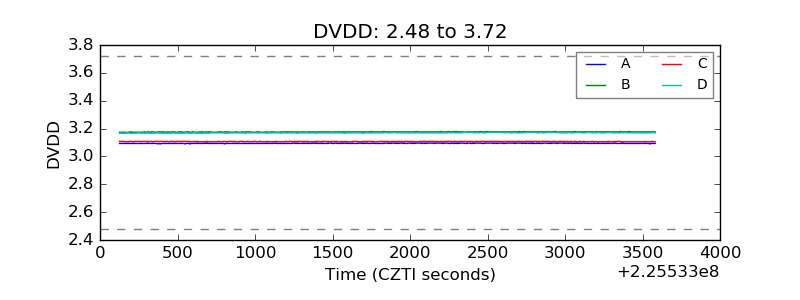 |
| Temperature 1 |  |
| Veto HV Monitor | 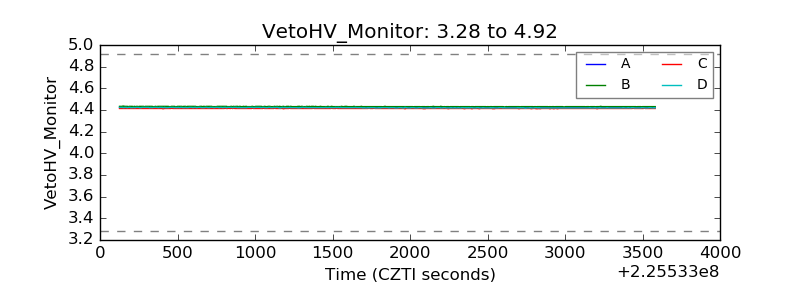 |
| Veto LLD | 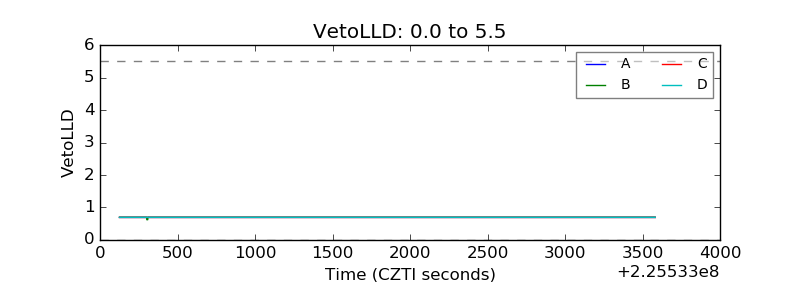 |
| Alpha Counter | 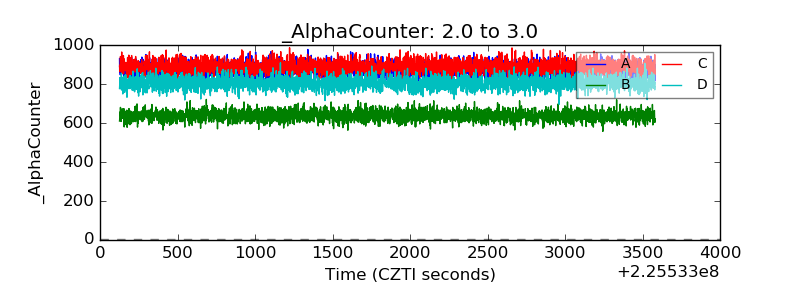 |
| _CPM_Rate | 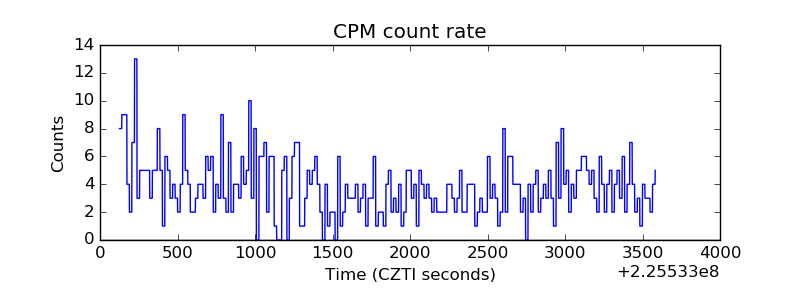 |
| CZT Counter | 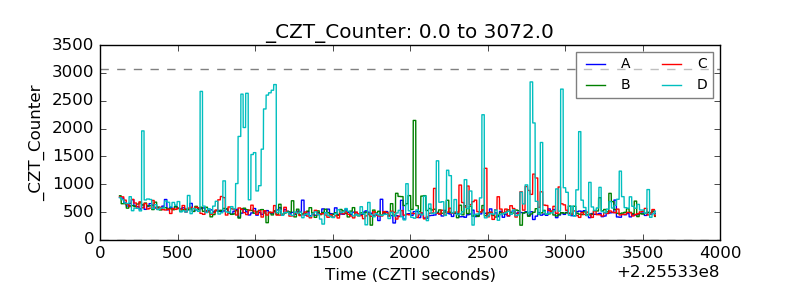 |
| +2.5 Volts monitor |  |
| +5 Volts monitor |  |
| _ROLL_ROT | 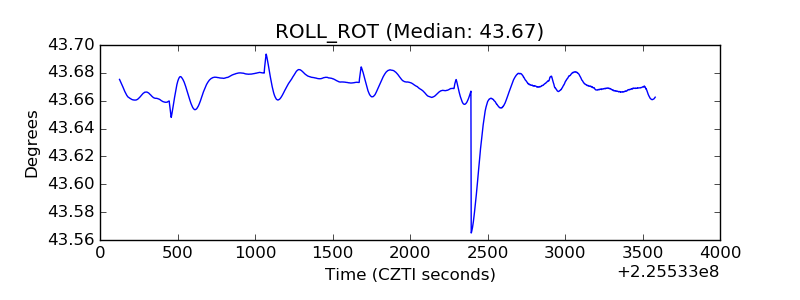 |
| _Roll_DEC | 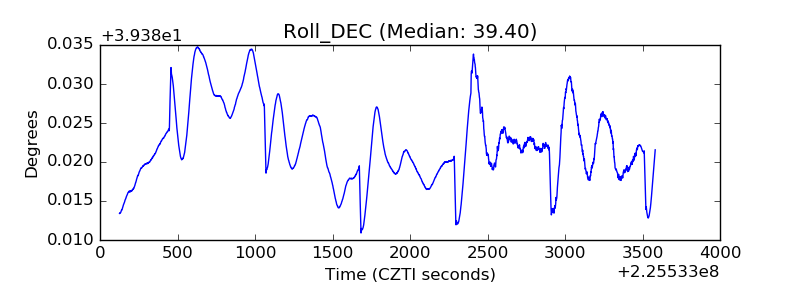 |
| _Roll_RA | 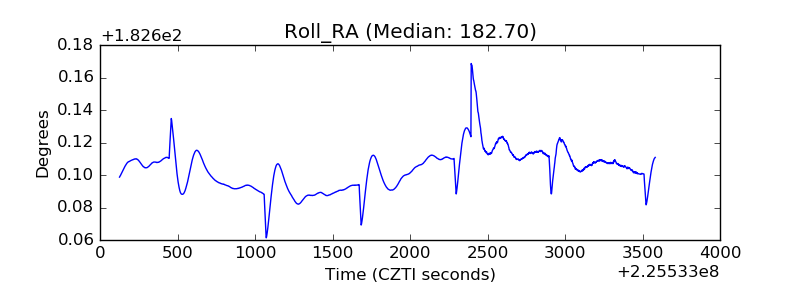 |
| Veto Counter | 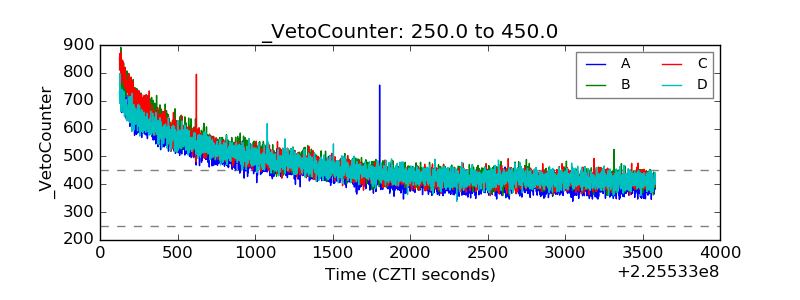 |