| Param | Original file | Final file |
|---|---|---|
| Filename | modeM0/AS1A02_178T01_9000001048cztM0_level2.fits | modeM0/AS1A02_178T01_9000001048cztM0_level2_quad_clean.evt |
| Size (bytes) | 822,916,800 | 736,557,120 |
| Size | 784.8 MB | 702.4 MB |
| Events in quadrant A | 5,058,282 | 4,334,625 |
| Events in quadrant B | 4,867,404 | 4,345,601 |
| Events in quadrant C | 4,834,874 | 3,965,147 |
| Events in quadrant D | 4,276,060 | 3,777,462 |
| Mode M9 | |||
|---|---|---|---|
| Quadrant | BADHDUFLAG | Total packets | Discarded packets |
| A | 0 | 144 | 0 |
| B | 0 | 144 | 0 |
| C | 0 | 144 | 0 |
| D | 0 | 144 | 0 |
| Mode M0 | |||
|---|---|---|---|
| Quadrant | BADHDUFLAG | Total packets | Discarded packets |
| A | 0 | 190543 | 0 |
| B | 0 | 182090 | 0 |
| C | 0 | 245651 | 0 |
| D | 0 | 198193 | 0 |
| Mode SS | |||
|---|---|---|---|
| Quadrant | BADHDUFLAG | Total packets | Discarded packets |
| A | 0 | 1750 | 0 |
| B | 0 | 1750 | 0 |
| C | 0 | 1750 | 0 |
| D | 0 | 1750 | 0 |
| Quadrant | Total seconds | Saturated seconds | Saturation percentage |
|---|---|---|---|
| A | 85820 | 1197 | 1.394780% |
| B | 85821 | 1279 | 1.490311% |
| C | 85817 | 4452 | 5.187783% |
| D | 85820 | 1725 | 2.010021% |
Noise dominated data is calculated using 1-second bins in cleaned event files. If a bin has >2000 counts, and if more than 50% of those come from <1% of pixels, then it is considered to be noise-dominated and hence unusable.
| Quadrant | # 1 sec bins | Bins with >0 counts | Bins with >2000 counts | High rate bins dominated by noise | Noise dominated (total time) | Noise dominated (detector-on time) | Marked lightcurve |
|---|---|---|---|---|---|---|---|
| A | 100328 | 85818 | 0 | 0 | 0.00% | 0.00% |  |
| B | 100328 | 85818 | 0 | 0 | 0.00% | 0.00% |  |
| C | 100328 | 85814 | 0 | 0 | 0.00% | 0.00% |  |
| D | 100328 | 85801 | 0 | 0 | 0.00% | 0.00% |  |
Top three noisy pixels from each quadrant. If the there are fewer than three noisy pixels in the level2.evt file, extra rows are filled as -1
| Pixel properties | Quadrant properties | ||||||
|---|---|---|---|---|---|---|---|
| Quadrant | DetID | PixID | Counts | Sigma | Mean | Median | Sigma |
| A | 0 | 29 | 4808 | 10.96 | 1312 | 1226 | 326.9 |
| A | 7 | 110 | 4097 | 8.78 | 1312 | 1226 | 326.9 |
| A | 9 | 19 | 3800 | 7.87 | 1312 | 1226 | 326.9 |
| B | 2 | 9 | 4128 | 11.56 | 1281 | 1219 | 251.7 |
| B | 12 | 226 | 3359 | 8.5 | 1281 | 1219 | 251.7 |
| B | 14 | 254 | 3297 | 8.26 | 1281 | 1219 | 251.7 |
| C | 1 | 80 | 3515 | 6.94 | 1277 | 1182 | 336.3 |
| C | 1 | 81 | 3502 | 6.9 | 1277 | 1182 | 336.3 |
| C | 12 | 241 | 3350 | 6.45 | 1277 | 1182 | 336.3 |
| D | 6 | 231 | 3212 | 6.45 | 1222 | 1110 | 325.7 |
| D | 7 | 5 | 3024 | 5.88 | 1222 | 1110 | 325.7 |
| D | 7 | 3 | 3011 | 5.84 | 1222 | 1110 | 325.7 |
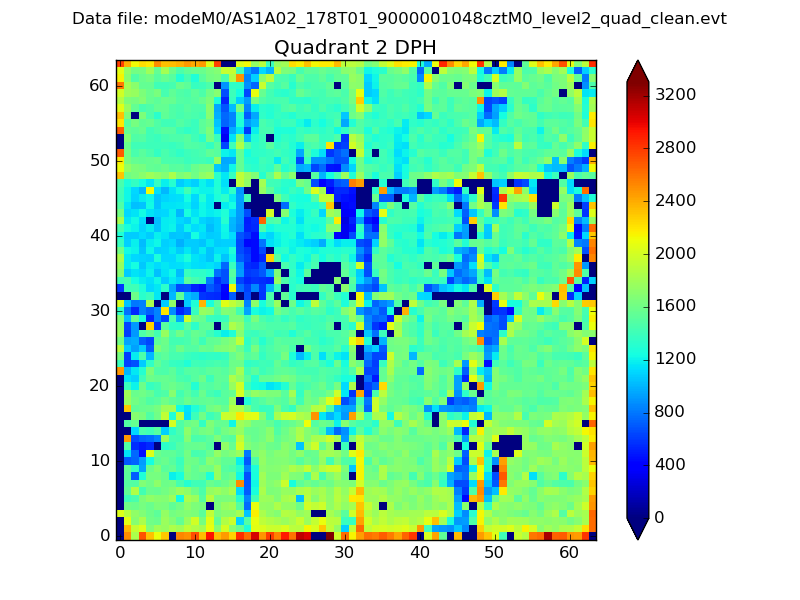
Histogram calculated using DETX and DETY for each event in the final _common_clean file
| Quadrant A |  |
 |
Quadrant B |
|---|---|---|---|
| Quadrant D |  |
 |
Quadrant C |
| Plot type | Count rate plots | Images |
|---|---|---|
| Comparison with Poisson distribution Blue bars denote a histogram of data divided into 1 sec bins. Red curve is a Poisson curve with rate = median count rate of data. |
 |
 |
| Quadrant-wise count rates Data is divided into 100 sec bins |
 |
|
| Module-wise count rates for Quadrant A Data is divided into 100 sec bins |
 |
 |
| Module-wise count rates for Quadrant B Data is divided into 100 sec bins |
 |
 |
| Module-wise count rates for Quadrant C Data is divided into 100 sec bins |
 |
 |
| Module-wise count rates for Quadrant D Data is divided into 100 sec bins |
 |
 |
| Parameter | Plot |
|---|---|
| CZT HV Monitor |  |
| D_VDD |  |
| Temperature 1 |  |
| Veto HV Monitor |  |
| Veto LLD |  |
| Alpha Counter |  |
| _CPM_Rate |  |
| CZT Counter |  |
| +2.5 Volts monitor |  |
| +5 Volts monitor |  |
| _ROLL_ROT |  |
| _Roll_DEC |  |
| _Roll_RA |  |
| Veto Counter |  |