| Param | Original file | Final file |
|---|---|---|
| Filename | modeM0/AS1A02_178T01_9000001048_07612cztM0_level2.evt | modeM0/AS1A02_178T01_9000001048_07612cztM0_level2_quad_clean.evt |
| Size (bytes) | 145,872,000 | 23,106,240 |
| Size | 139.1 MB | 22.0 MB |
| Events in quadrant A | 1,016,257 | 143,929 |
| Events in quadrant B | 1,034,682 | 147,347 |
| Events in quadrant C | 1,145,985 | 141,833 |
| Events in quadrant D | 1,096,983 | 135,126 |
| Mode M9 | |||
|---|---|---|---|
| Quadrant | BADHDUFLAG | Total packets | Discarded packets |
| A | 0 | 13 | 0 |
| B | 0 | 13 | 0 |
| C | 0 | 13 | 0 |
| D | 0 | 13 | 0 |
| Mode M0 | |||
|---|---|---|---|
| Quadrant | BADHDUFLAG | Total packets | Discarded packets |
| A | 0 | 4107 | 2 |
| B | 0 | 4169 | 1 |
| C | 0 | 4606 | 1 |
| D | 0 | 4385 | 1 |
| Mode SS | |||
|---|---|---|---|
| Quadrant | BADHDUFLAG | Total packets | Discarded packets |
| A | 0 | 36 | 0 |
| B | 0 | 36 | 0 |
| C | 0 | 36 | 0 |
| D | 0 | 36 | 0 |
| Quadrant | Total seconds | Saturated seconds | Saturation percentage |
|---|---|---|---|
| A | 1793 | 83 | 4.629113% |
| B | 1793 | 79 | 4.406023% |
| C | 1793 | 85 | 4.740658% |
| D | 1793 | 77 | 4.294479% |
Noise dominated data is calculated using 1-second bins in cleaned event files. If a bin has >2000 counts, and if more than 50% of those come from <1% of pixels, then it is considered to be noise-dominated and hence unusable.
| Quadrant | # 1 sec bins | Bins with >0 counts | Bins with >2000 counts | High rate bins dominated by noise | Noise dominated (total time) | Noise dominated (detector-on time) | Marked lightcurve |
|---|---|---|---|---|---|---|---|
| A | 3053 | 1794 | 0 | 0 | 0.00% | 0.00% | 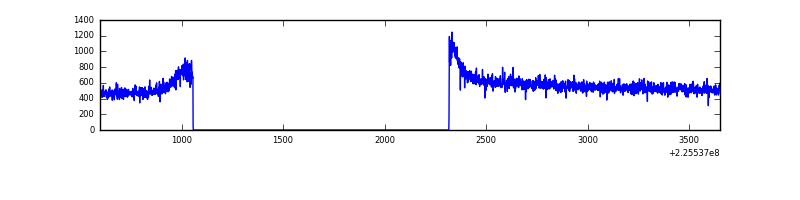 |
| B | 3053 | 1794 | 0 | 0 | 0.00% | 0.00% | 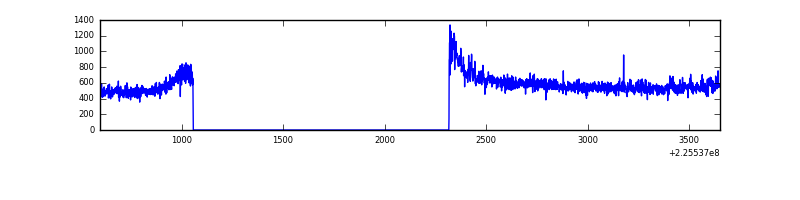 |
| C | 3053 | 1794 | 8 | 8 | 0.26% | 0.45% | 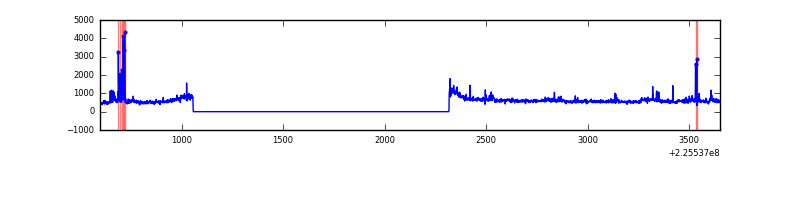 |
| D | 3053 | 1794 | 4 | 4 | 0.13% | 0.22% | 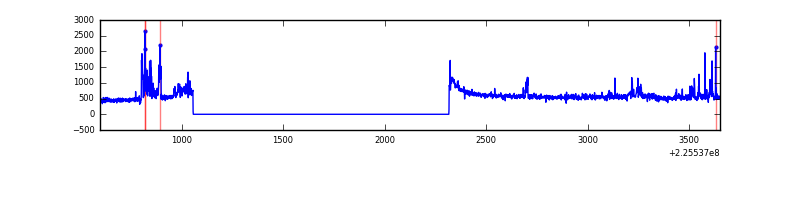 |
Top three noisy pixels from each quadrant. If the there are fewer than three noisy pixels in the level2.evt file, extra rows are filled as -1
| Pixel properties | Quadrant properties | ||||||
|---|---|---|---|---|---|---|---|
| Quadrant | DetID | PixID | Counts | Sigma | Mean | Median | Sigma |
| A | 0 | 226 | 2569 | 42.61 | 263 | 258 | 54.2 |
| A | 12 | 194 | 2381 | 39.15 | 263 | 258 | 54.2 |
| A | 3 | 1 | 1665 | 25.94 | 263 | 258 | 54.2 |
| B | 0 | 219 | 7601 | 144.81 | 261 | 256 | 50.7 |
| B | 4 | 81 | 7402 | 140.89 | 261 | 256 | 50.7 |
| B | 12 | 111 | 5039 | 94.3 | 261 | 256 | 50.7 |
| C | 4 | 254 | 71787 | 1187.55 | 256 | 257 | 60.2 |
| C | 9 | 68 | 69635 | 1151.83 | 256 | 257 | 60.2 |
| C | 4 | 238 | 4689 | 73.58 | 256 | 257 | 60.2 |
| D | 2 | 152 | 75474 | 1169.68 | 258 | 250 | 64.3 |
| D | 5 | 81 | 25192 | 387.83 | 258 | 250 | 64.3 |
| D | 1 | 52 | 8862 | 133.91 | 258 | 250 | 64.3 |
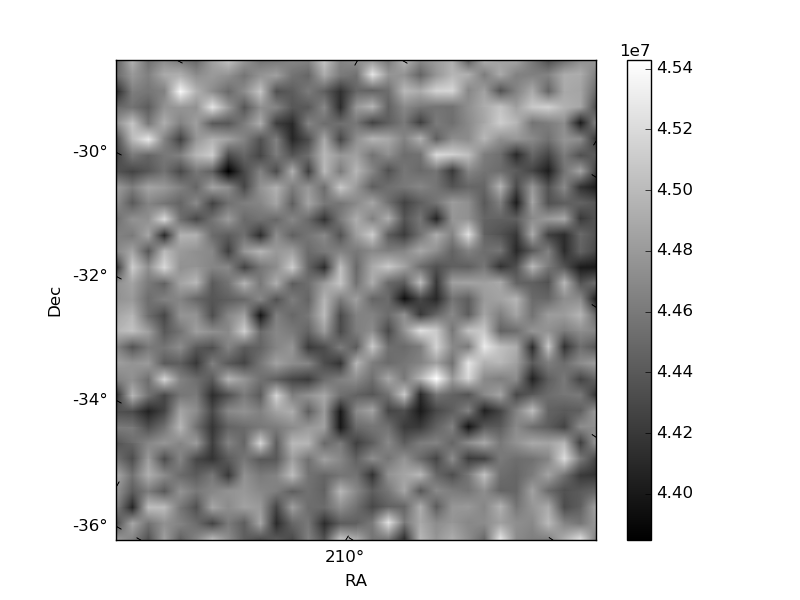
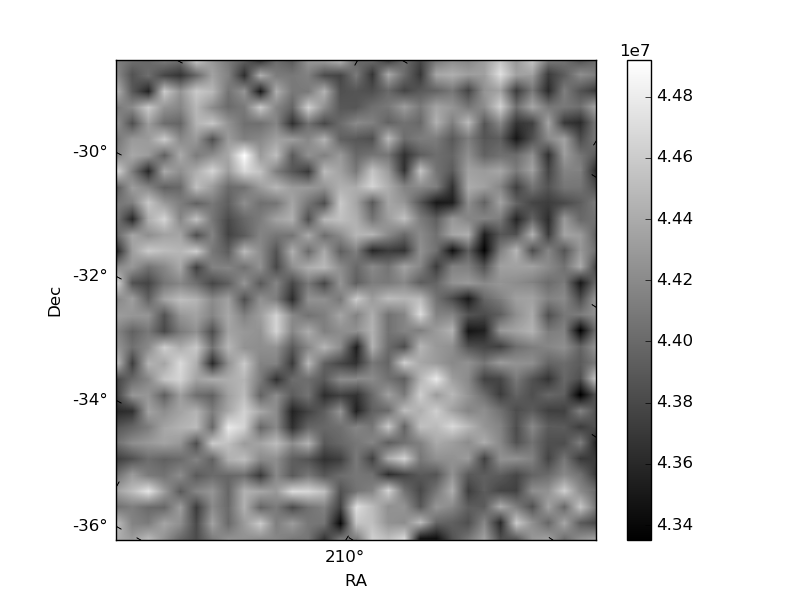
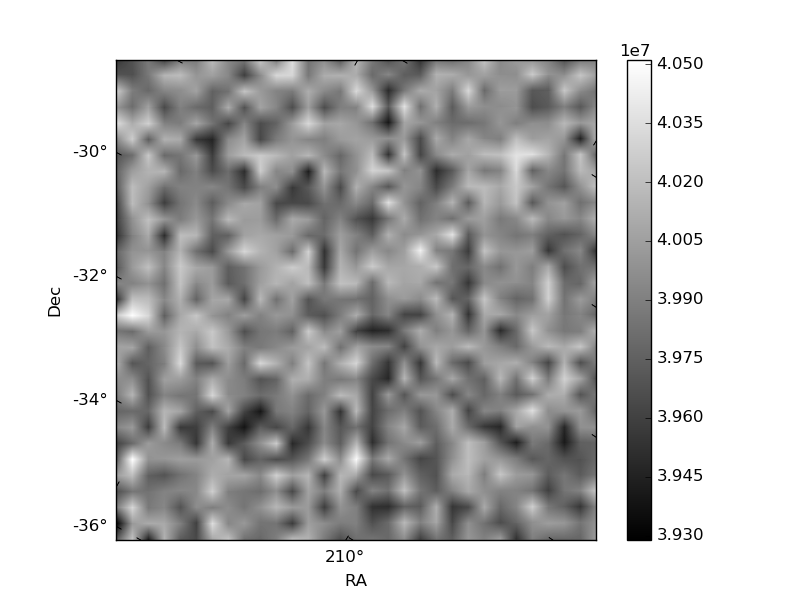
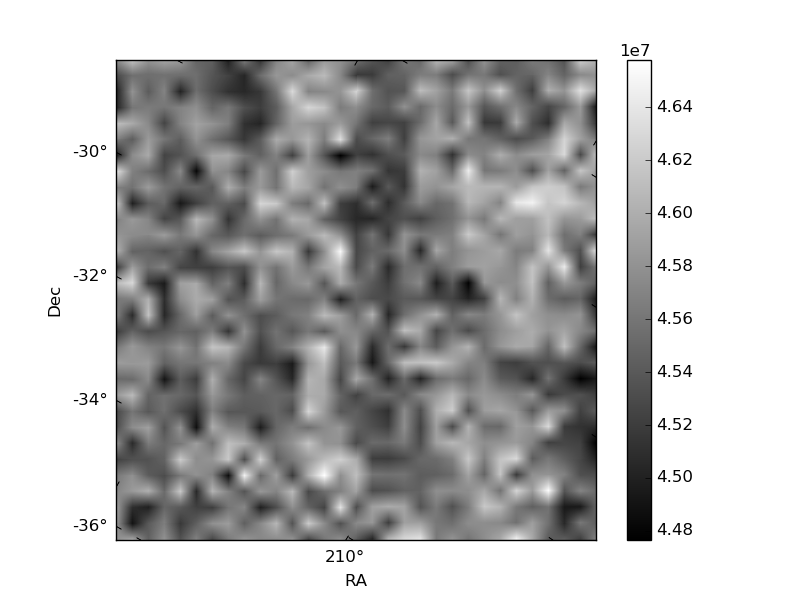
Histogram calculated using DETX and DETY for each event in the final _common_clean file
| Quadrant A | 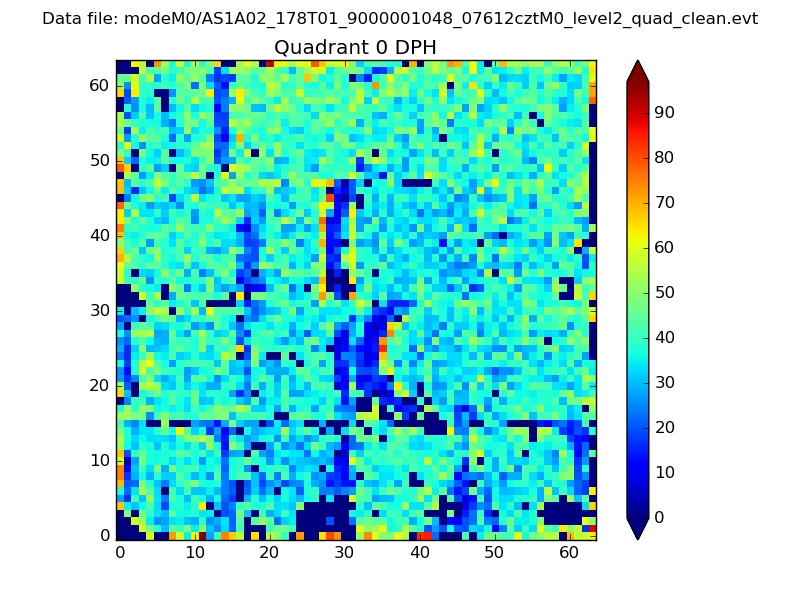 |
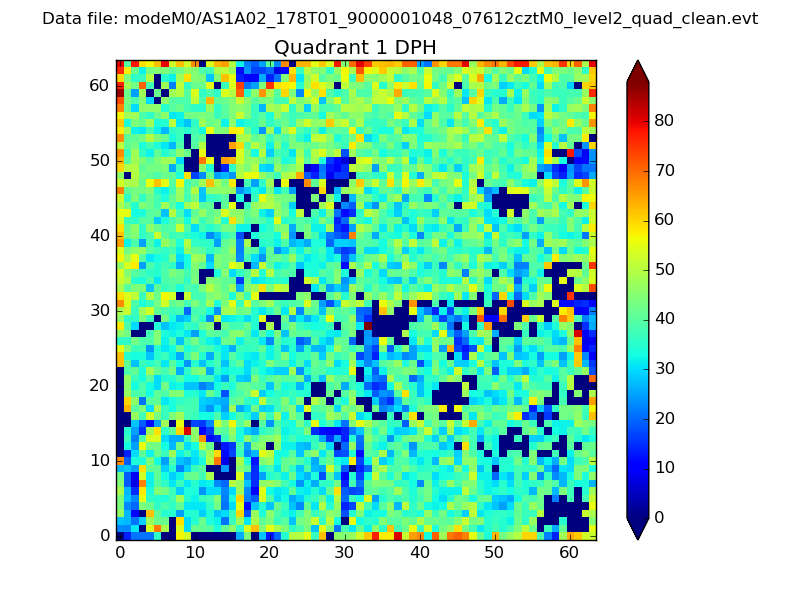 |
Quadrant B |
|---|---|---|---|
| Quadrant D | 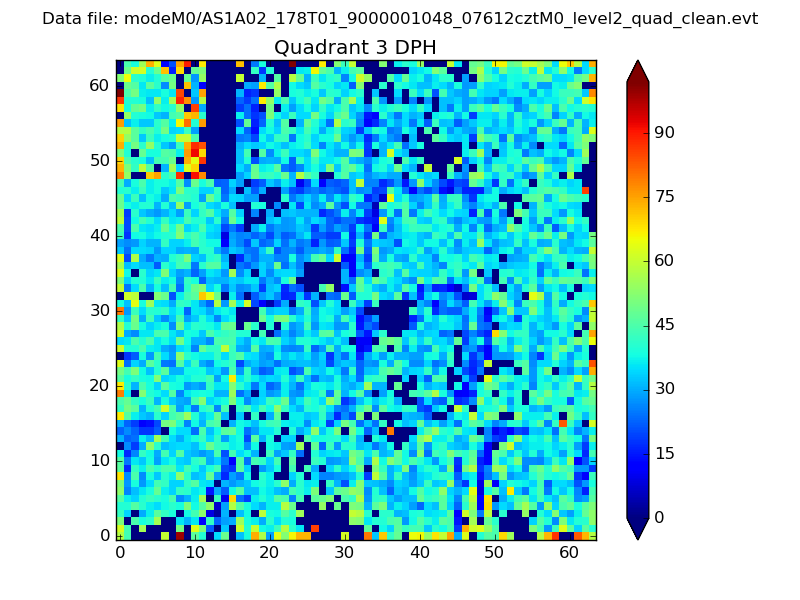 |
 |
Quadrant C |
| Plot type | Count rate plots | Images |
|---|---|---|
| Comparison with Poisson distribution Blue bars denote a histogram of data divided into 1 sec bins. Red curve is a Poisson curve with rate = median count rate of data. |
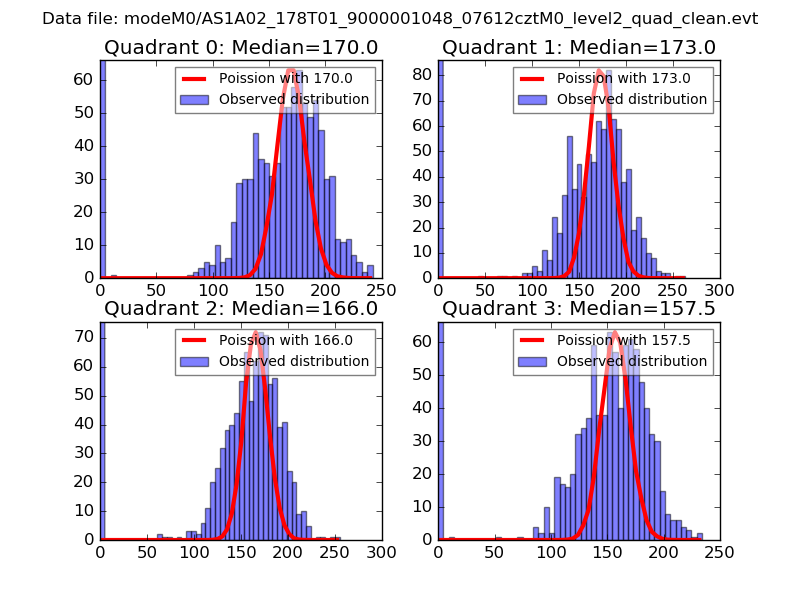 |
 |
| Quadrant-wise count rates Data is divided into 100 sec bins |
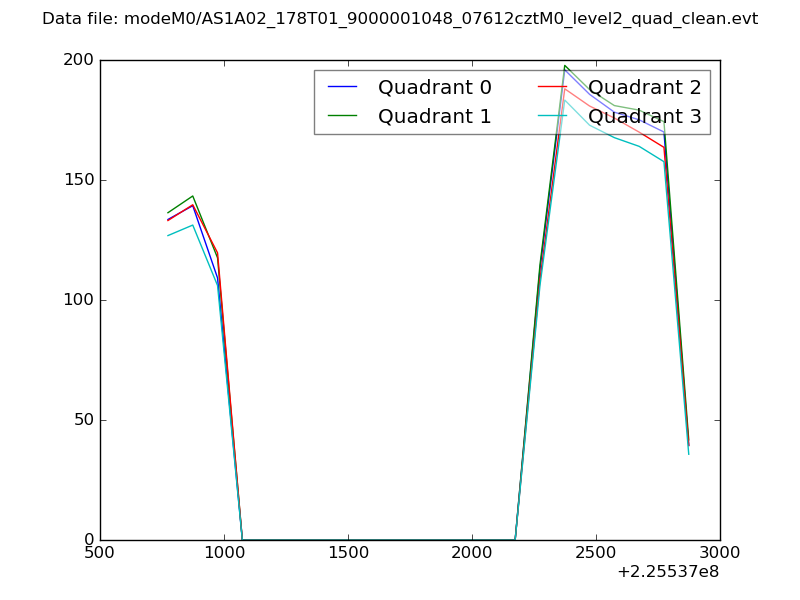 |
|
| Module-wise count rates for Quadrant A Data is divided into 100 sec bins |
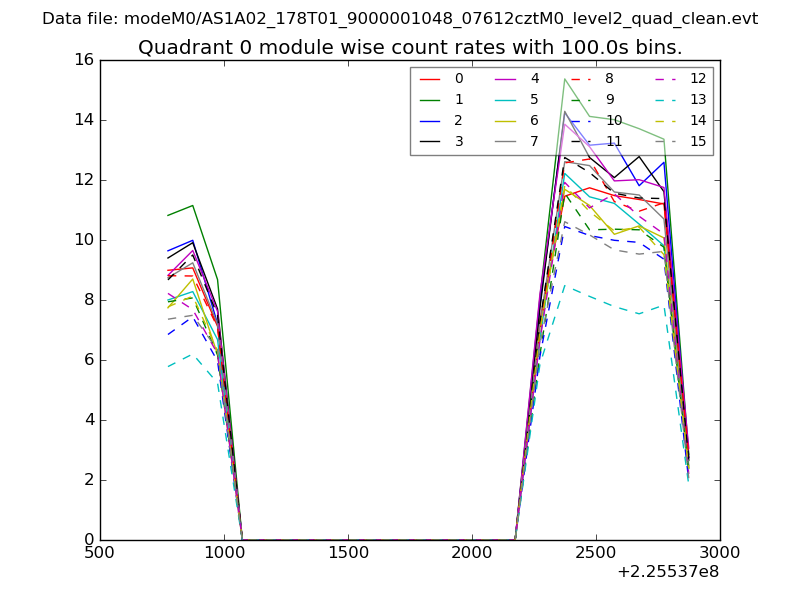 |
 |
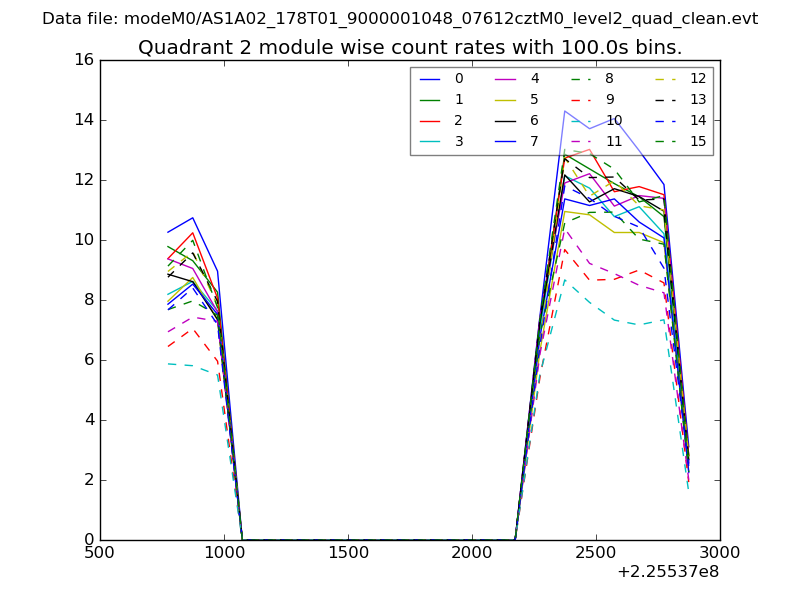
| Module-wise count rates for Quadrant B Data is divided into 100 sec bins |
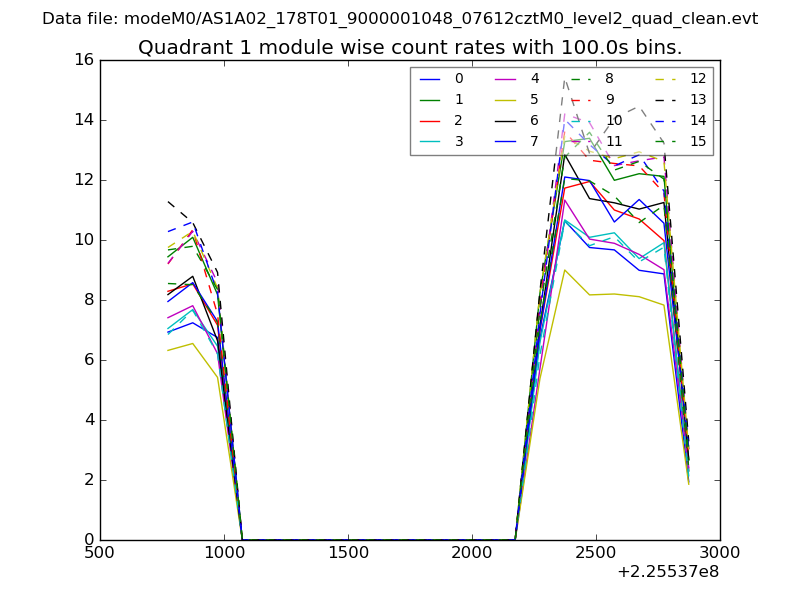 |
 |
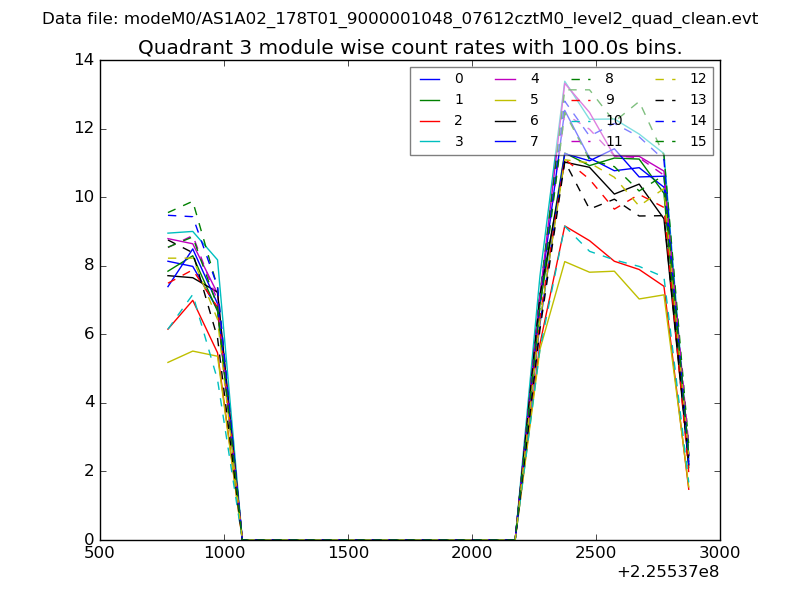
| Module-wise count rates for Quadrant C Data is divided into 100 sec bins |
 |
 |
| Module-wise count rates for Quadrant D Data is divided into 100 sec bins |
 |
 |
| Parameter | Plot |
|---|---|
| CZT HV Monitor | 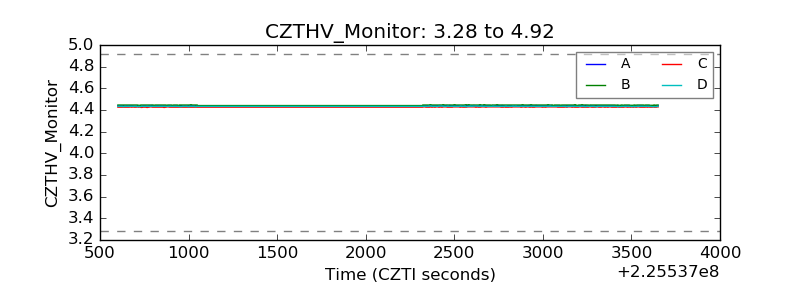 |
| D_VDD | 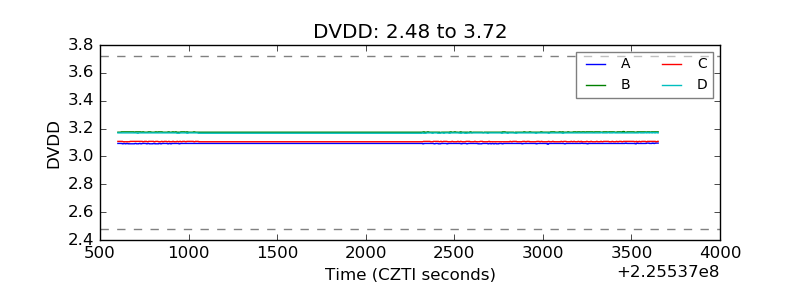 |
| Temperature 1 | 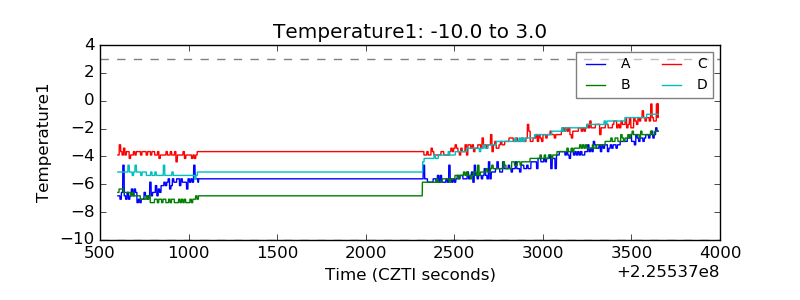 |
| Veto HV Monitor | 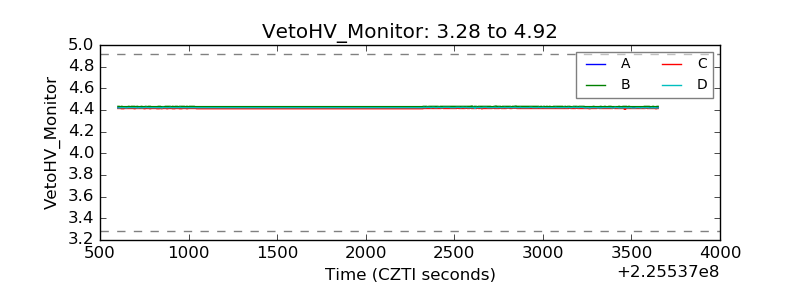 |
| Veto LLD | 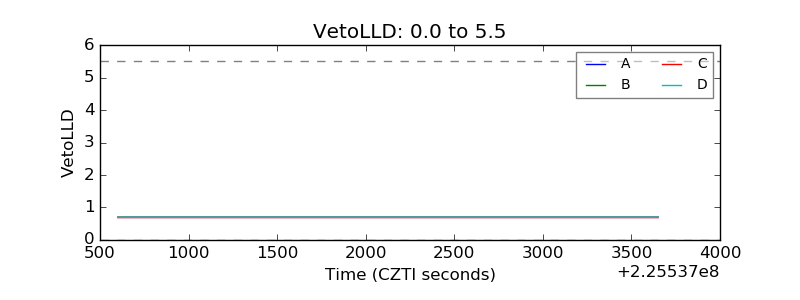 |
| Alpha Counter | 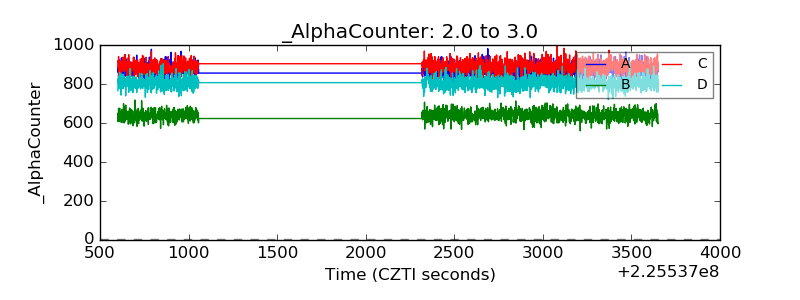 |
| _CPM_Rate | 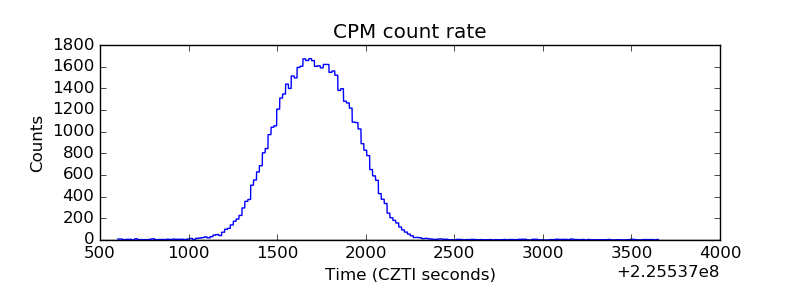 |
| CZT Counter |  |
| +2.5 Volts monitor |  |
| +5 Volts monitor |  |
| _ROLL_ROT | 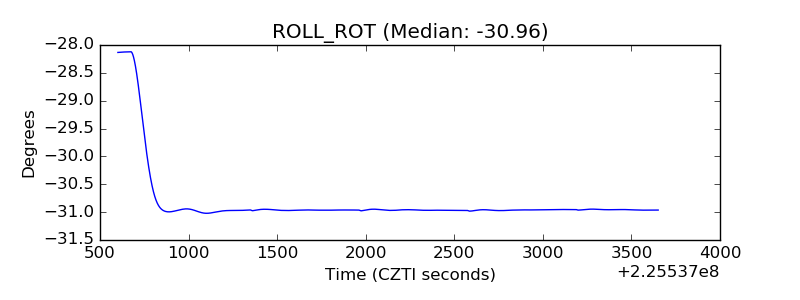 |
| _Roll_DEC | 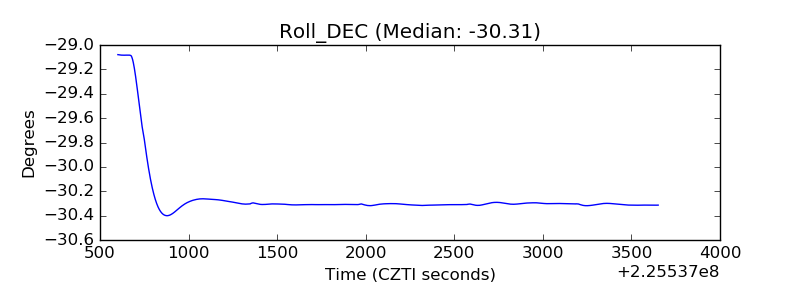 |
| _Roll_RA | 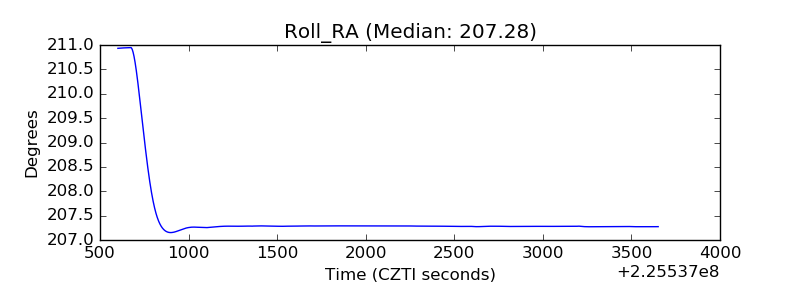 |
| Veto Counter | 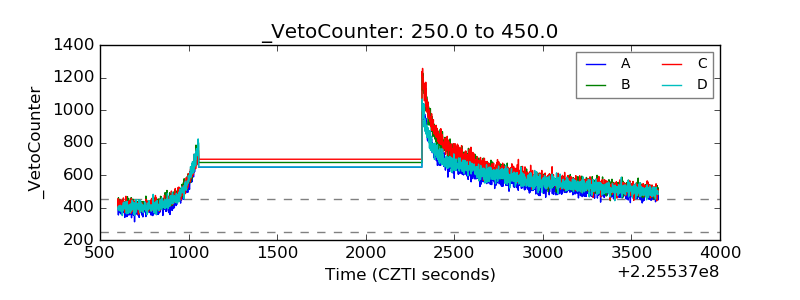 |