| Param | Original file | Final file |
|---|---|---|
| Filename | modeM0/AS1A02_178T01_9000001048_07622cztM0_level2.evt | modeM0/AS1A02_178T01_9000001048_07622cztM0_level2_quad_clean.evt |
| Size (bytes) | 1,552,564,800 | 256,432,320 |
| Size | 1.4 GB | 244.6 MB |
| Events in quadrant A | 10,090,291 | 1,587,918 |
| Events in quadrant B | 10,359,673 | 1,611,995 |
| Events in quadrant C | 13,662,758 | 1,561,621 |
| Events in quadrant D | 11,437,851 | 1,507,942 |
| Mode M9 | |||
|---|---|---|---|
| Quadrant | BADHDUFLAG | Total packets | Discarded packets |
| A | 0 | 13 | 0 |
| B | 0 | 13 | 0 |
| C | 0 | 13 | 0 |
| D | 0 | 13 | 0 |
| Mode M0 | |||
|---|---|---|---|
| Quadrant | BADHDUFLAG | Total packets | Discarded packets |
| A | 0 | 44953 | 10 |
| B | 0 | 45645 | 7 |
| C | 0 | 54838 | 21 |
| D | 0 | 49612 | 9 |
| Mode SS | |||
|---|---|---|---|
| Quadrant | BADHDUFLAG | Total packets | Discarded packets |
| A | 0 | 444 | 0 |
| B | 0 | 444 | 0 |
| C | 0 | 444 | 0 |
| D | 0 | 444 | 0 |
| Quadrant | Total seconds | Saturated seconds | Saturation percentage |
|---|---|---|---|
| A | 21746 | 171 | 0.786352% |
| B | 21747 | 256 | 1.177174% |
| C | 21743 | 443 | 2.037437% |
| D | 21746 | 329 | 1.512922% |
Noise dominated data is calculated using 1-second bins in cleaned event files. If a bin has >2000 counts, and if more than 50% of those come from <1% of pixels, then it is considered to be noise-dominated and hence unusable.
| Quadrant | # 1 sec bins | Bins with >0 counts | Bins with >2000 counts | High rate bins dominated by noise | Noise dominated (total time) | Noise dominated (detector-on time) | Marked lightcurve |
|---|---|---|---|---|---|---|---|
| A | 23053 | 21754 | 1 | 1 | 0.00% | 0.00% | 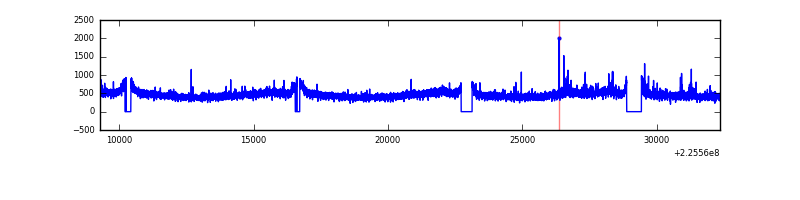 |
| B | 23053 | 21754 | 22 | 22 | 0.10% | 0.10% | 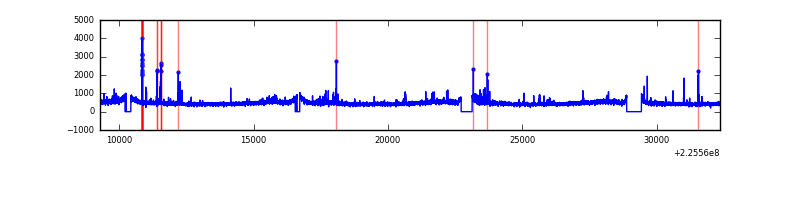 |
| C | 23053 | 21754 | 251 | 251 | 1.09% | 1.15% | 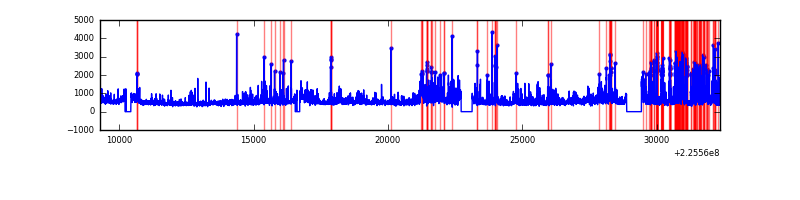 |
| D | 23053 | 21754 | 210 | 210 | 0.91% | 0.97% | 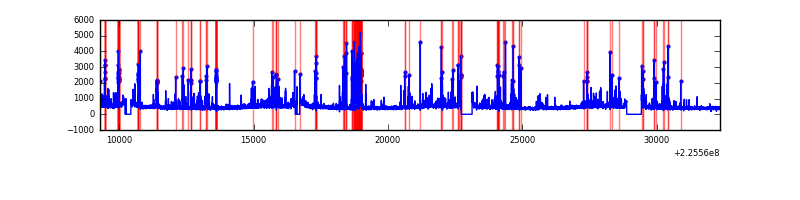 |
Top three noisy pixels from each quadrant. If the there are fewer than three noisy pixels in the level2.evt file, extra rows are filled as -1
| Pixel properties | Quadrant properties | ||||||
|---|---|---|---|---|---|---|---|
| Quadrant | DetID | PixID | Counts | Sigma | Mean | Median | Sigma |
| A | 13 | 251 | 170153 | 320.23 | 2565 | 2504 | 523.5 |
| A | 0 | 128 | 61469 | 112.63 | 2565 | 2504 | 523.5 |
| A | 0 | 226 | 24502 | 42.02 | 2565 | 2504 | 523.5 |
| B | 0 | 214 | 84372 | 166.84 | 2581 | 2517 | 490.6 |
| B | 4 | 81 | 67449 | 132.35 | 2581 | 2517 | 490.6 |
| B | 12 | 111 | 51377 | 99.59 | 2581 | 2517 | 490.6 |
| C | 9 | 68 | 3238875 | 5613.52 | 2485 | 2497 | 576.5 |
| C | 4 | 254 | 588945 | 1017.2 | 2485 | 2497 | 576.5 |
| C | 1 | 16 | 135070 | 229.95 | 2485 | 2497 | 576.5 |
| D | 13 | 104 | 854895 | 1412.95 | 2479 | 2405 | 603.3 |
| D | 2 | 14 | 592015 | 977.25 | 2479 | 2405 | 603.3 |
| D | 2 | 152 | 275049 | 451.89 | 2479 | 2405 | 603.3 |
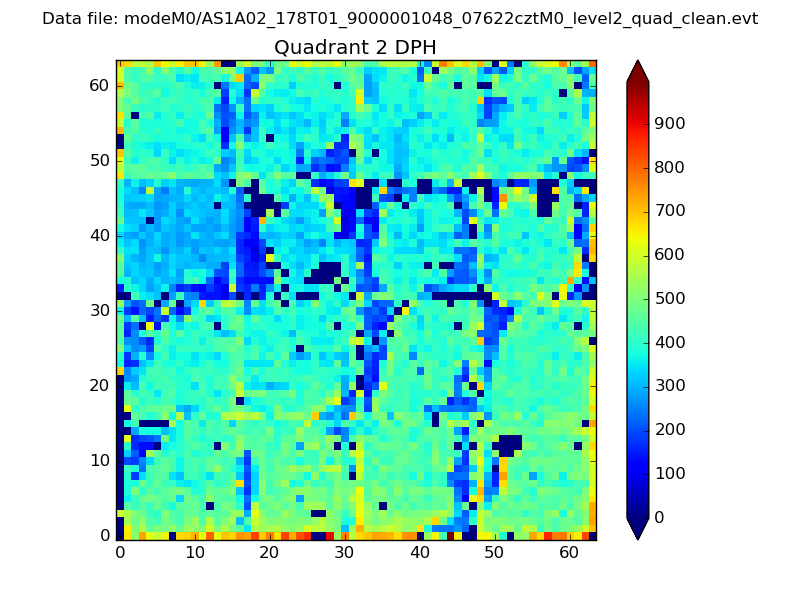
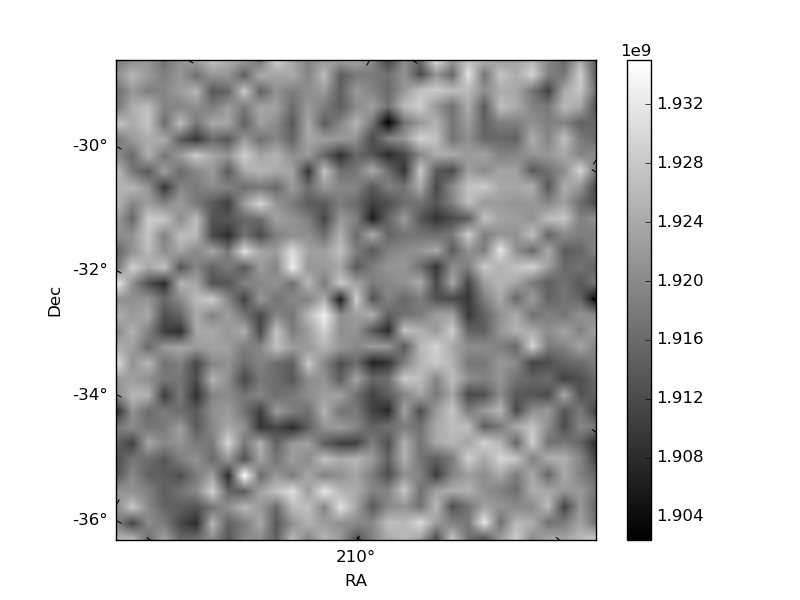
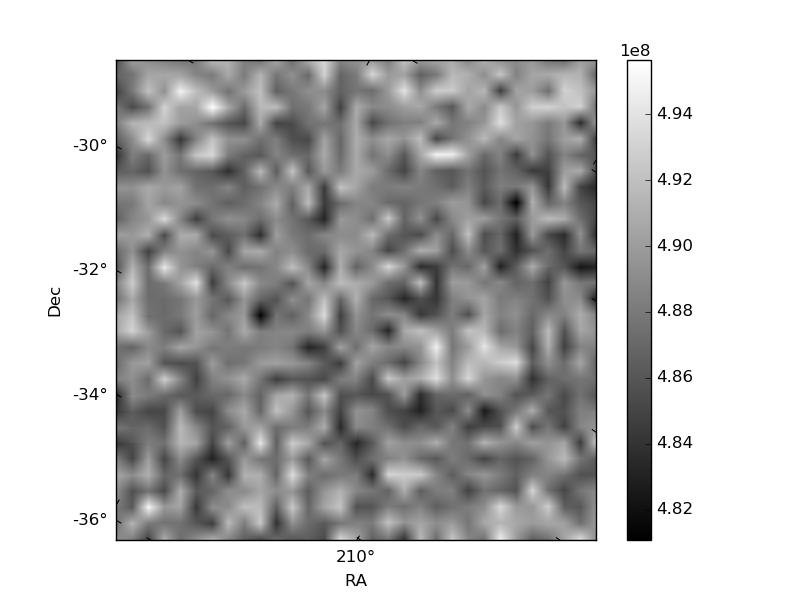
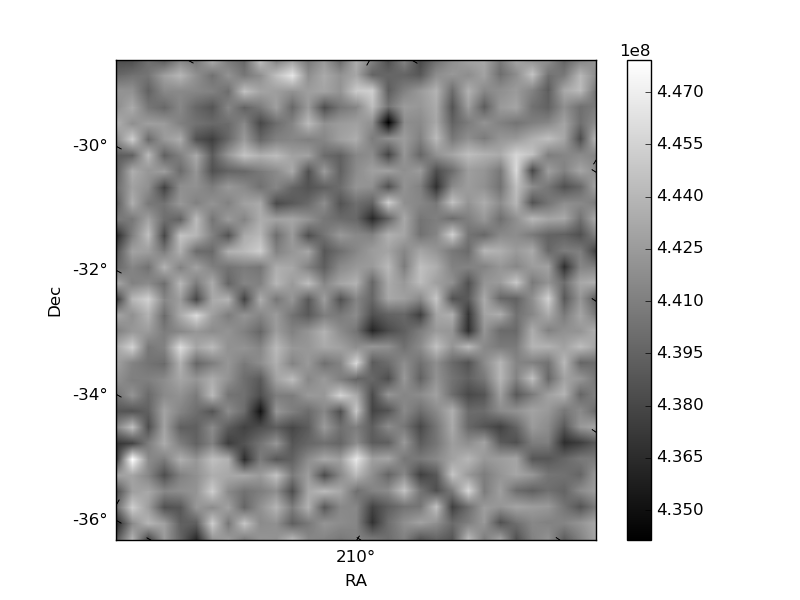
Histogram calculated using DETX and DETY for each event in the final _common_clean file
| Quadrant A | 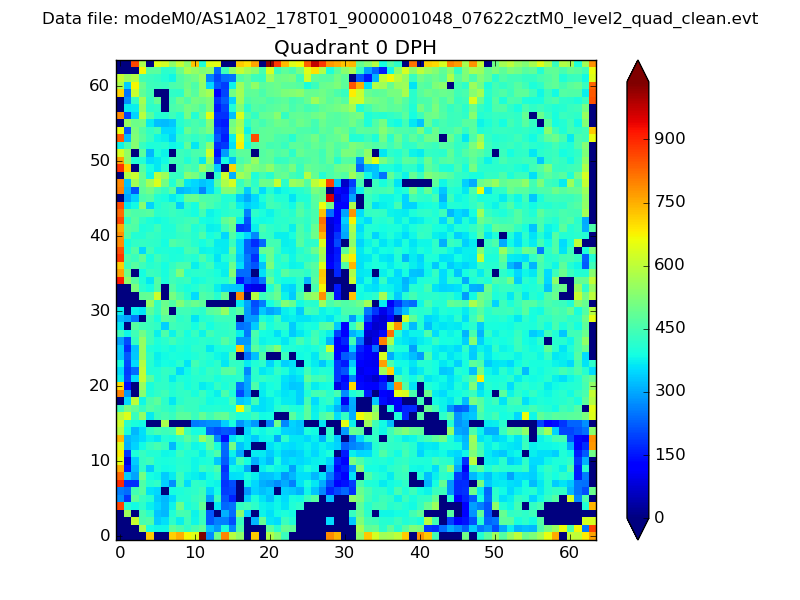 |
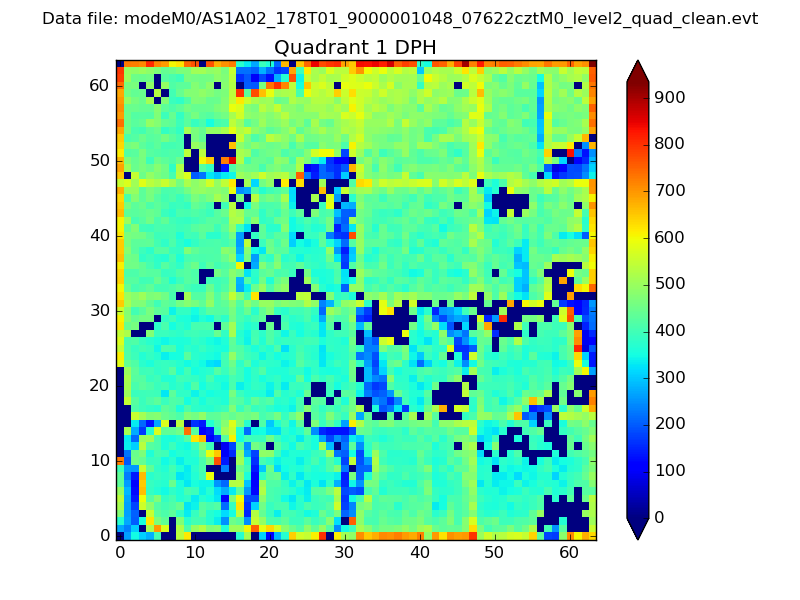 |
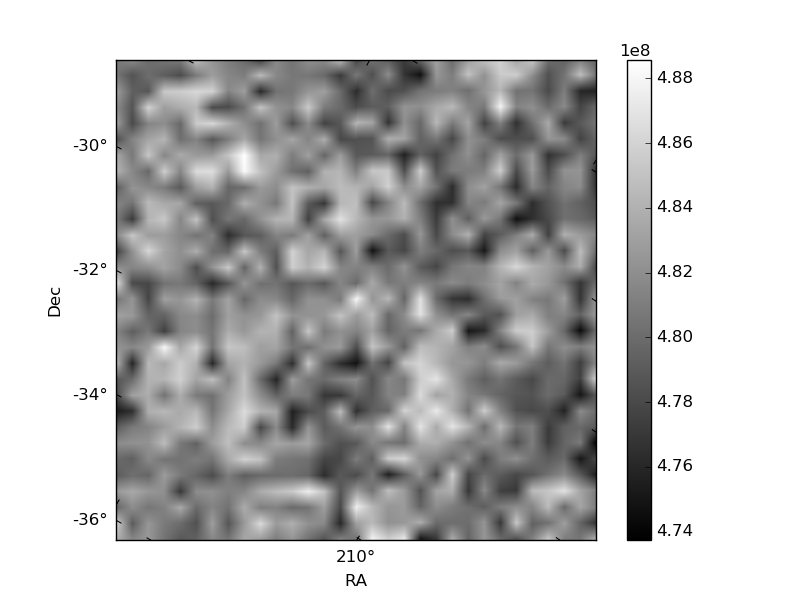
Quadrant B |
|---|---|---|---|
| Quadrant D | 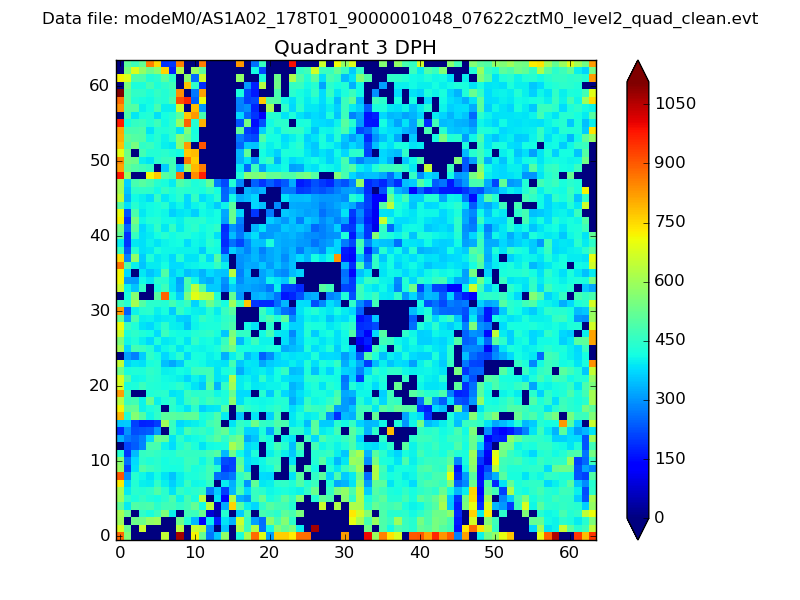 |
 |
Quadrant C |
| Plot type | Count rate plots | Images |
|---|---|---|
| Comparison with Poisson distribution Blue bars denote a histogram of data divided into 1 sec bins. Red curve is a Poisson curve with rate = median count rate of data. |
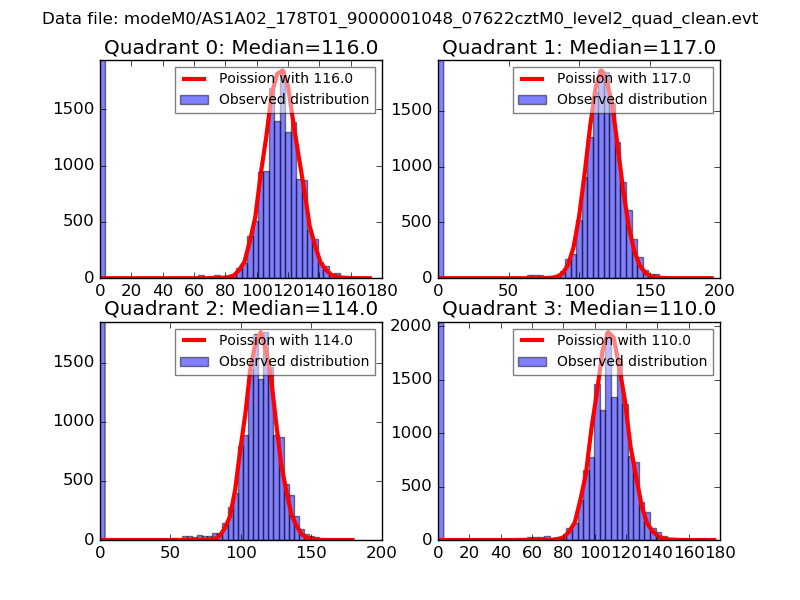 |
 |
| Quadrant-wise count rates Data is divided into 100 sec bins |
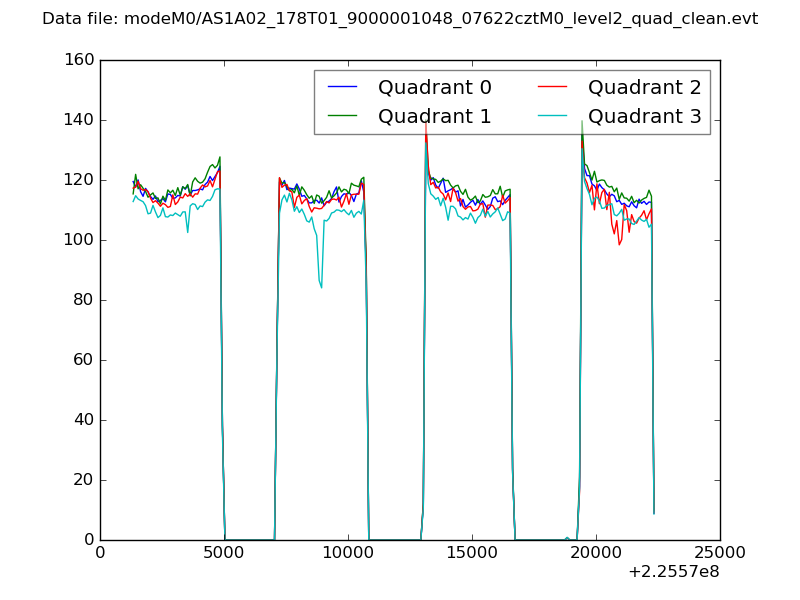 |
|
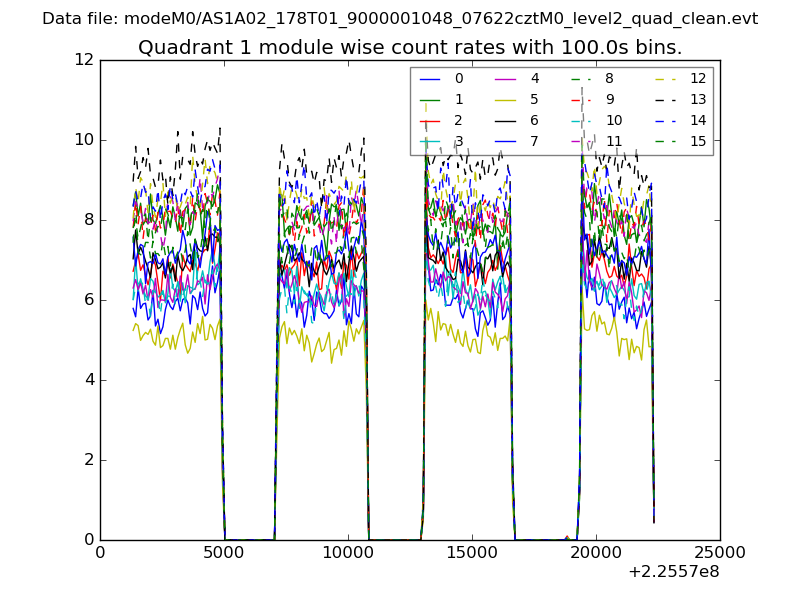
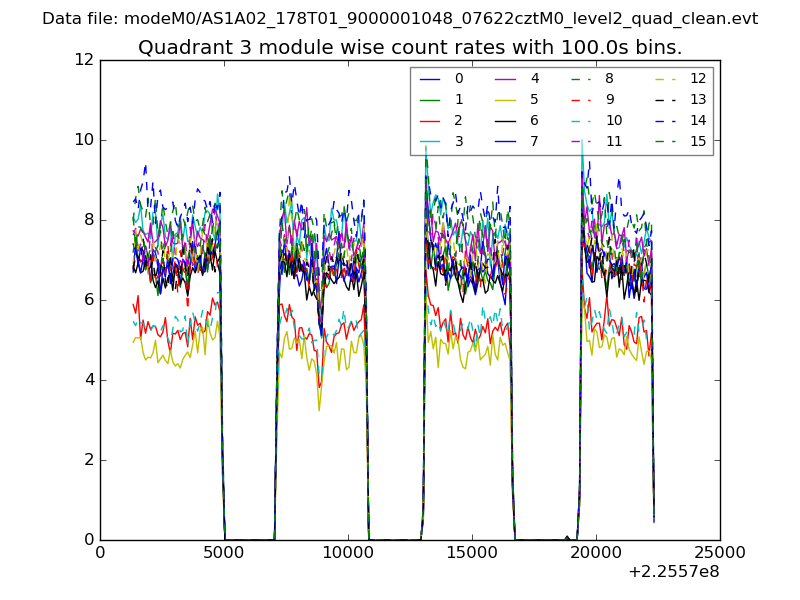
| Module-wise count rates for Quadrant A Data is divided into 100 sec bins |
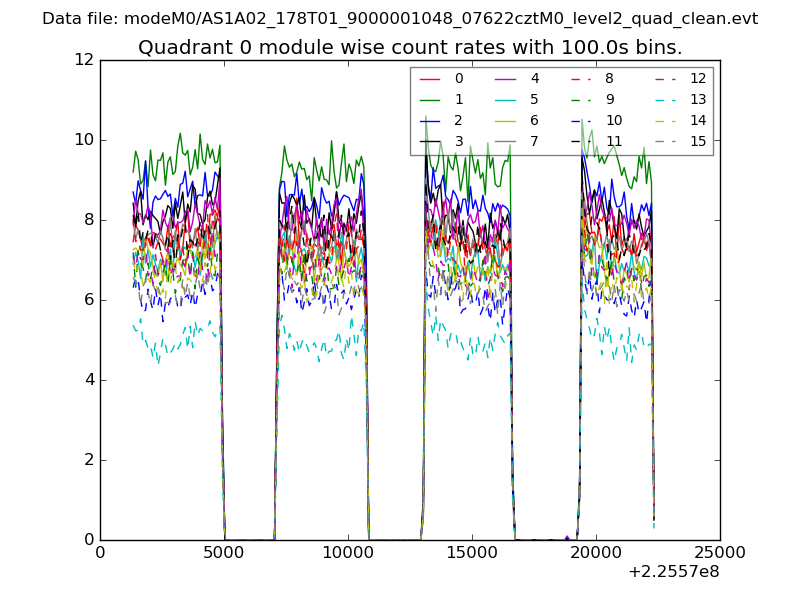 |
 |
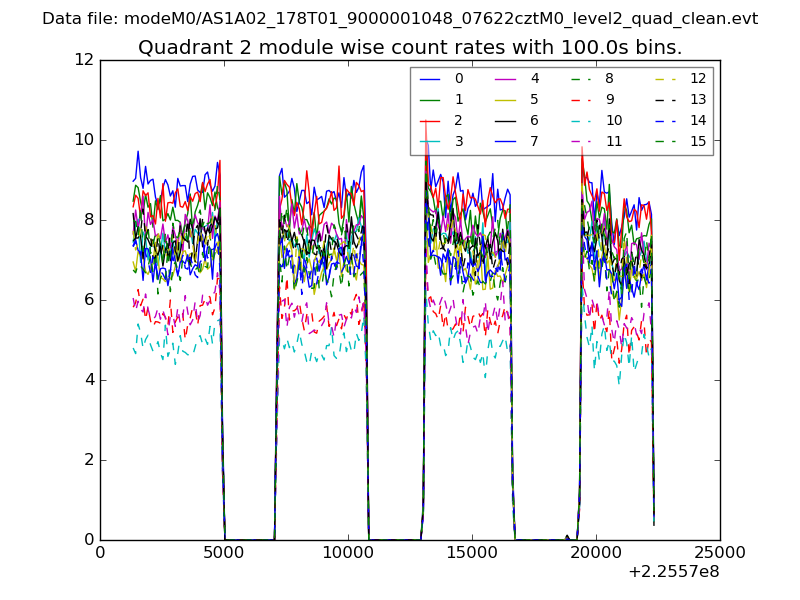
| Module-wise count rates for Quadrant B Data is divided into 100 sec bins |
 |
 |
| Module-wise count rates for Quadrant C Data is divided into 100 sec bins |
 |
 |
| Module-wise count rates for Quadrant D Data is divided into 100 sec bins |
 |
 |
| Parameter | Plot |
|---|---|
| CZT HV Monitor | 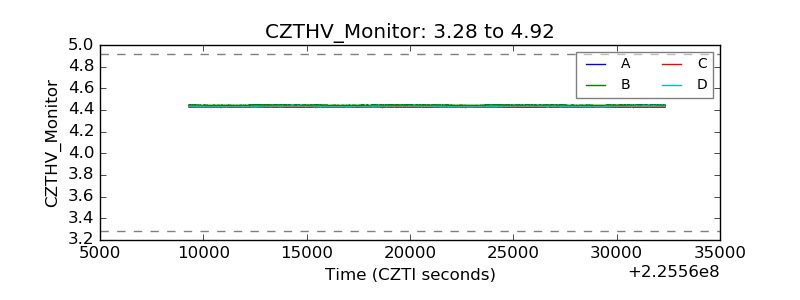 |
| D_VDD | 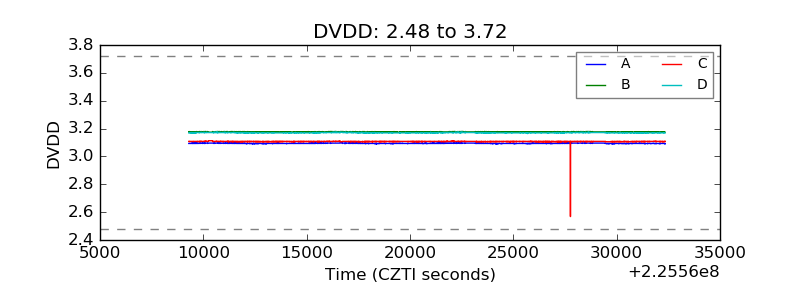 |
| Temperature 1 | 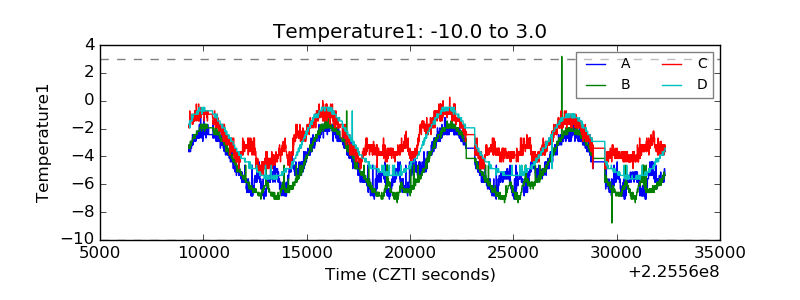 |
| Veto HV Monitor |  |
| Veto LLD | 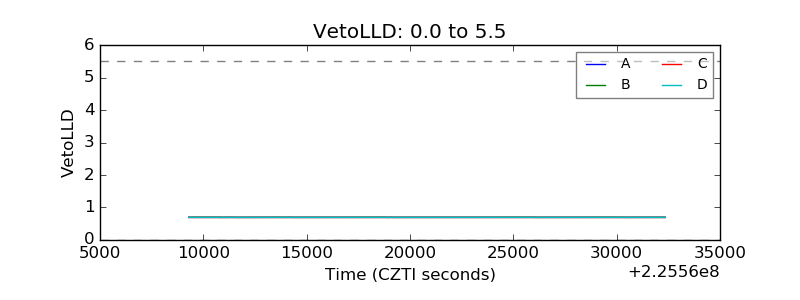 |
| Alpha Counter | 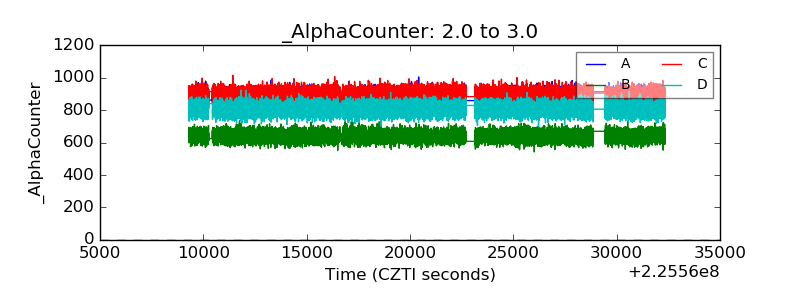 |
| _CPM_Rate | 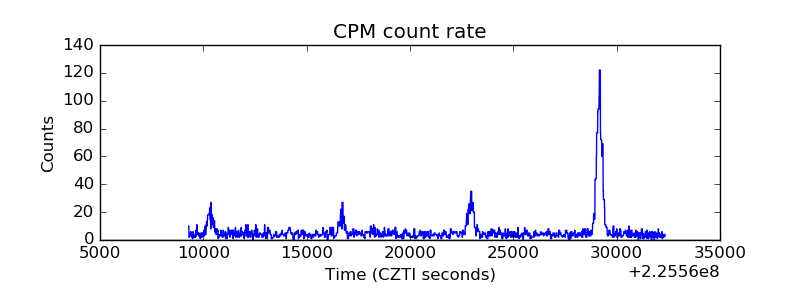 |
| CZT Counter | 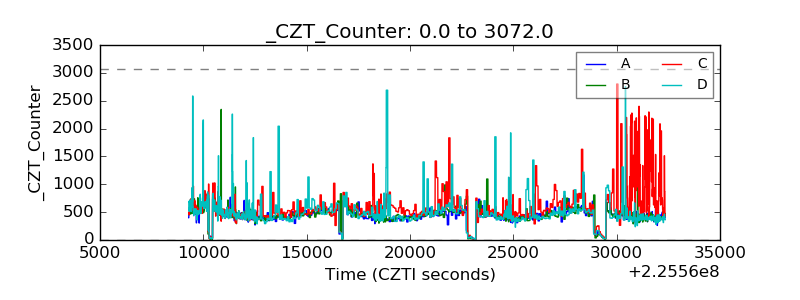 |
| +2.5 Volts monitor |  |
| +5 Volts monitor |  |
| _ROLL_ROT | 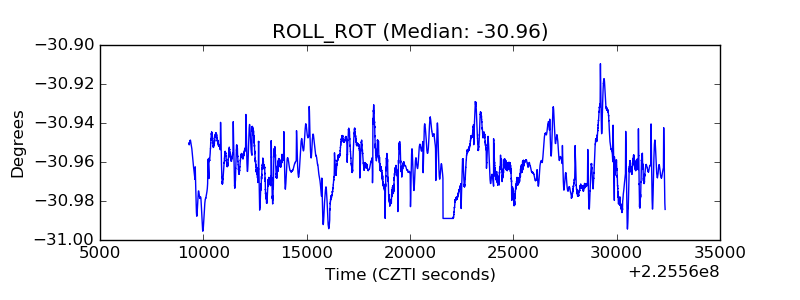 |
| _Roll_DEC | 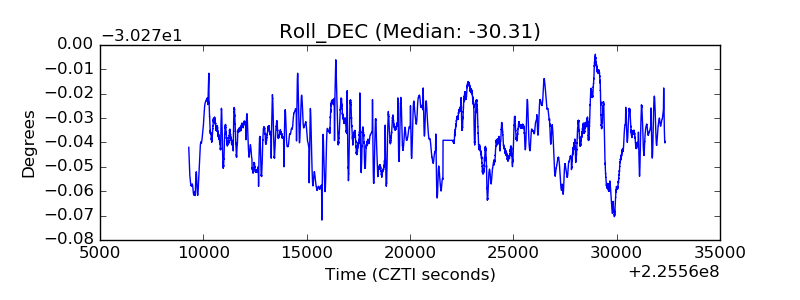 |
| _Roll_RA | 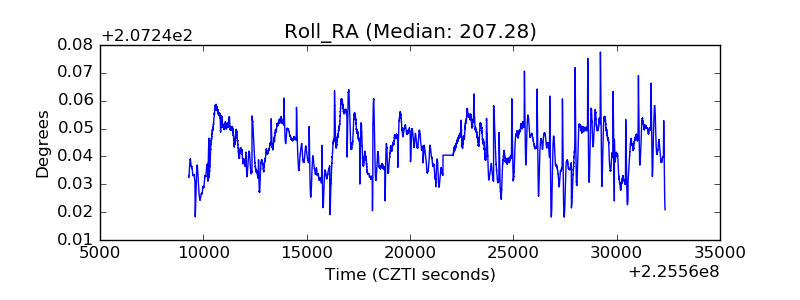 |
| Veto Counter | 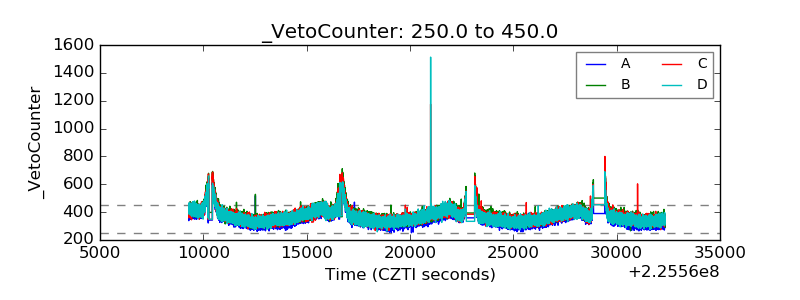 |