| Param | Original file | Final file |
|---|---|---|
| Filename | modeM0/AS1A02_178T01_9000001048_07623cztM0_level2.evt | modeM0/AS1A02_178T01_9000001048_07623cztM0_level2_quad_clean.evt |
| Size (bytes) | 1,148,307,840 | 174,116,160 |
| Size | 1.1 GB | 166.1 MB |
| Events in quadrant A | 8,572,277 | 1,064,083 |
| Events in quadrant B | 7,430,495 | 1,083,683 |
| Events in quadrant C | 9,863,746 | 1,050,162 |
| Events in quadrant D | 7,880,341 | 1,023,219 |
| Mode M9 | |||
|---|---|---|---|
| Quadrant | BADHDUFLAG | Total packets | Discarded packets |
| A | 0 | 26 | 0 |
| B | 0 | 26 | 0 |
| C | 0 | 26 | 0 |
| D | 0 | 26 | 0 |
| Mode M0 | |||
|---|---|---|---|
| Quadrant | BADHDUFLAG | Total packets | Discarded packets |
| A | 0 | 35322 | 4 |
| B | 0 | 32022 | 3 |
| C | 0 | 39088 | 3 |
| D | 0 | 33963 | 3 |
| Mode SS | |||
|---|---|---|---|
| Quadrant | BADHDUFLAG | Total packets | Discarded packets |
| A | 0 | 312 | 0 |
| B | 0 | 312 | 0 |
| C | 0 | 312 | 0 |
| D | 0 | 312 | 0 |
| Quadrant | Total seconds | Saturated seconds | Saturation percentage |
|---|---|---|---|
| A | 15238 | 130 | 0.853130% |
| B | 15238 | 136 | 0.892506% |
| C | 15238 | 548 | 3.596272% |
| D | 15238 | 208 | 1.365009% |
Noise dominated data is calculated using 1-second bins in cleaned event files. If a bin has >2000 counts, and if more than 50% of those come from <1% of pixels, then it is considered to be noise-dominated and hence unusable.
| Quadrant | # 1 sec bins | Bins with >0 counts | Bins with >2000 counts | High rate bins dominated by noise | Noise dominated (total time) | Noise dominated (detector-on time) | Marked lightcurve |
|---|---|---|---|---|---|---|---|
| A | 17918 | 15241 | 61 | 61 | 0.34% | 0.40% | 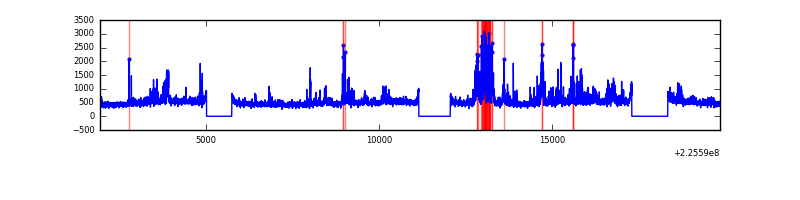 |
| B | 17918 | 15241 | 50 | 50 | 0.28% | 0.33% | 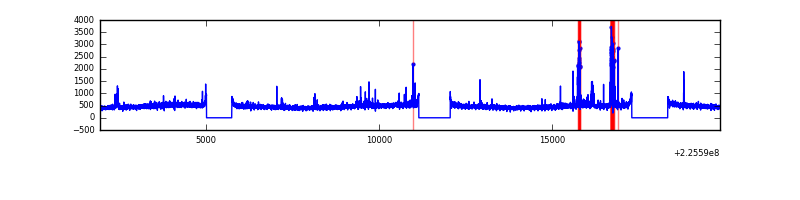 |
| C | 17918 | 15241 | 402 | 402 | 2.24% | 2.64% | 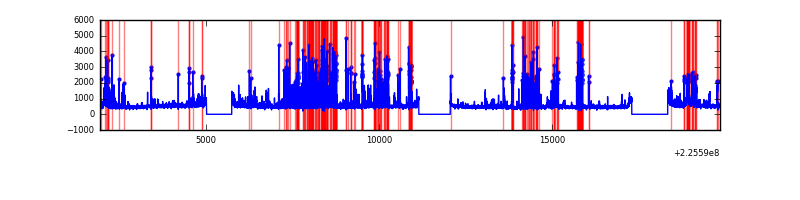 |
| D | 17918 | 15241 | 106 | 106 | 0.59% | 0.70% | 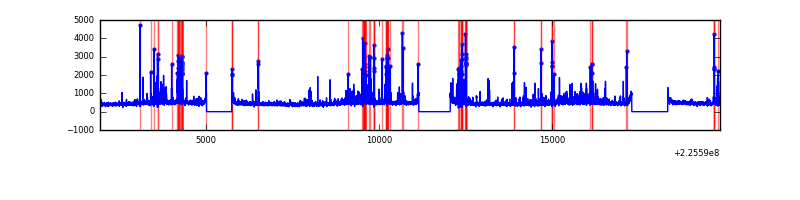 |
Top three noisy pixels from each quadrant. If the there are fewer than three noisy pixels in the level2.evt file, extra rows are filled as -1
| Pixel properties | Quadrant properties | ||||||
|---|---|---|---|---|---|---|---|
| Quadrant | DetID | PixID | Counts | Sigma | Mean | Median | Sigma |
| A | 13 | 251 | 1588011 | 4356.32 | 1805 | 1764 | 364.1 |
| A | 13 | 248 | 28629 | 73.78 | 1805 | 1764 | 364.1 |
| A | 0 | 226 | 17117 | 42.16 | 1805 | 1764 | 364.1 |
| B | 4 | 239 | 144370 | 414.0 | 1814 | 1769 | 344.4 |
| B | 0 | 214 | 125691 | 359.77 | 1814 | 1769 | 344.4 |
| B | 4 | 81 | 65731 | 185.69 | 1814 | 1769 | 344.4 |
| C | 9 | 68 | 2343899 | 5778.52 | 1746 | 1756 | 405.3 |
| C | 4 | 254 | 539202 | 1325.98 | 1746 | 1756 | 405.3 |
| C | 8 | 229 | 149950 | 365.62 | 1746 | 1756 | 405.3 |
| D | 2 | 14 | 485651 | 1117.63 | 1762 | 1709 | 433.0 |
| D | 2 | 152 | 362819 | 833.96 | 1762 | 1709 | 433.0 |
| D | 13 | 104 | 194313 | 444.81 | 1762 | 1709 | 433.0 |
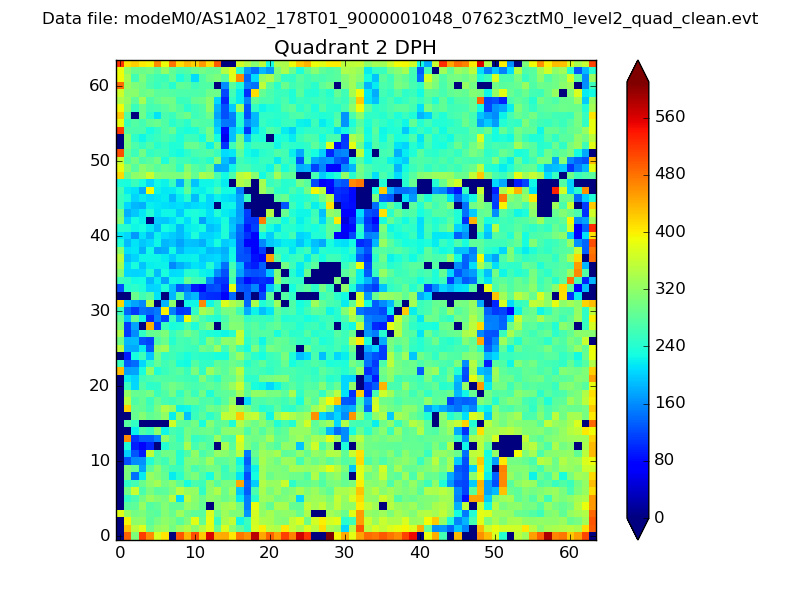
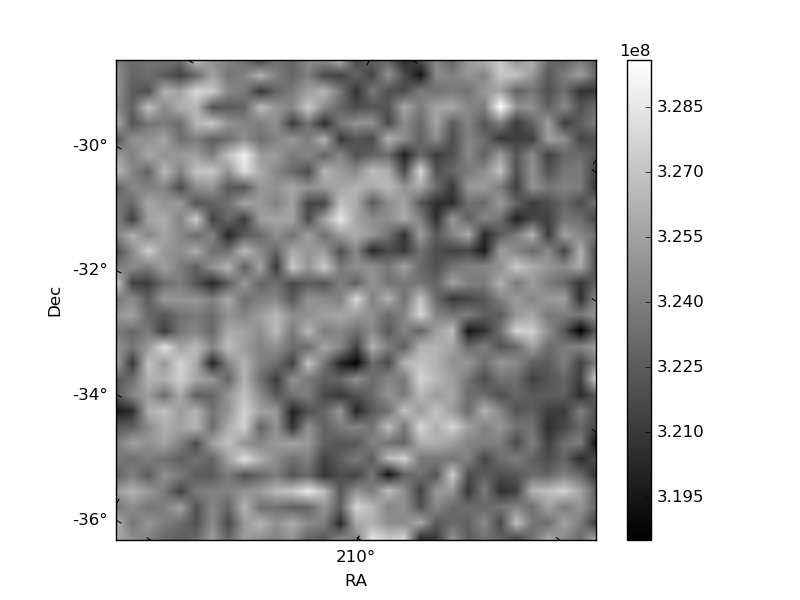
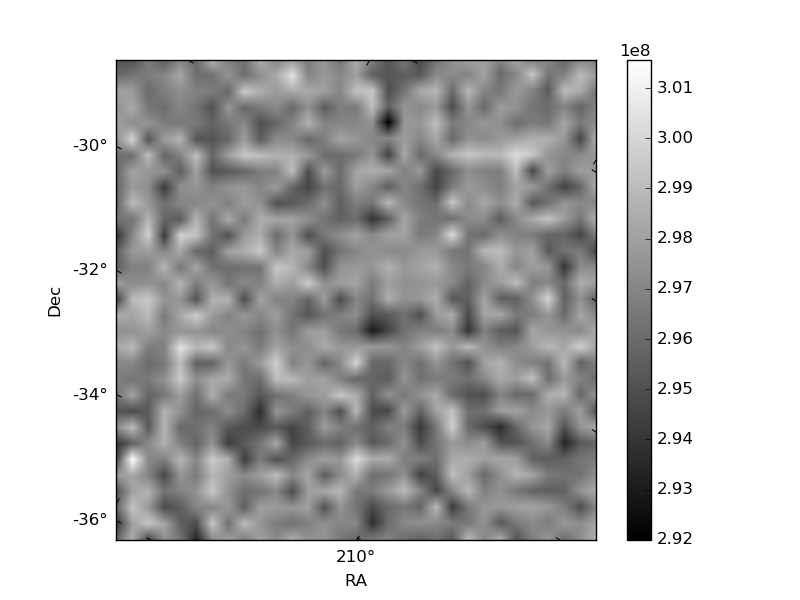
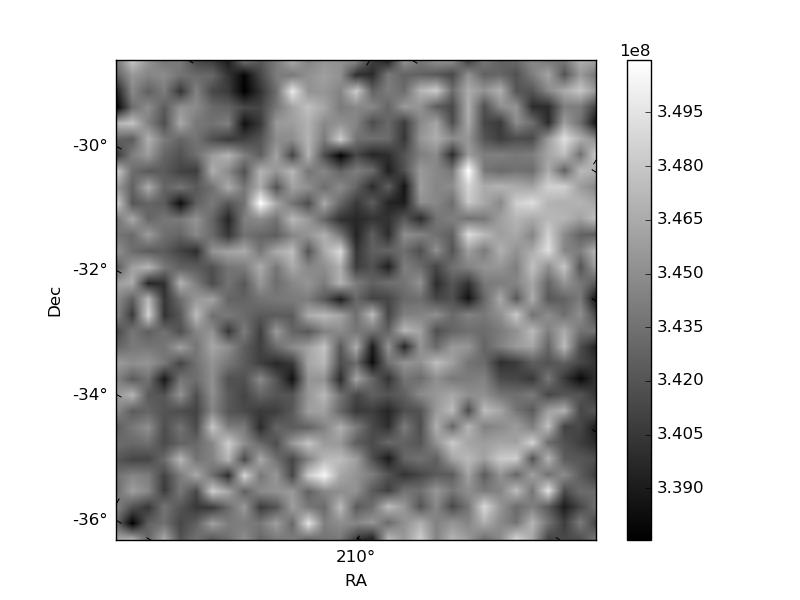
Histogram calculated using DETX and DETY for each event in the final _common_clean file
| Quadrant A | 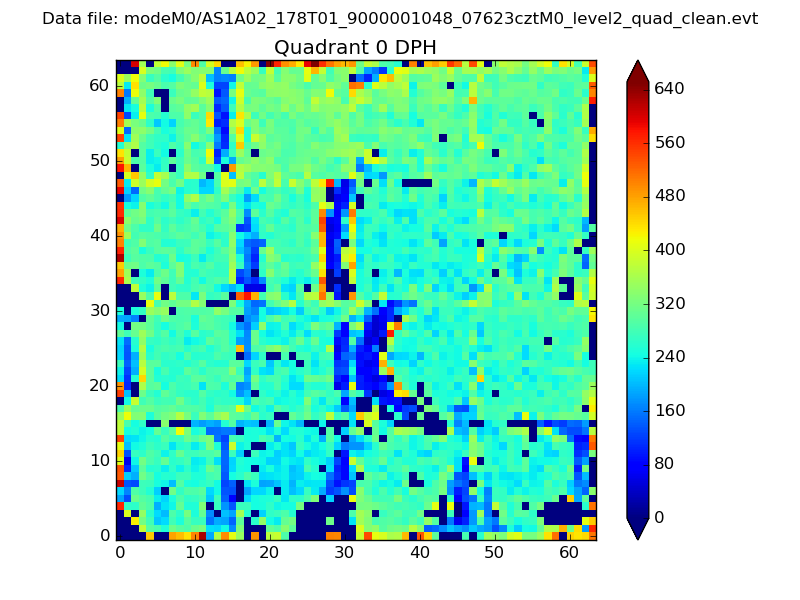 |
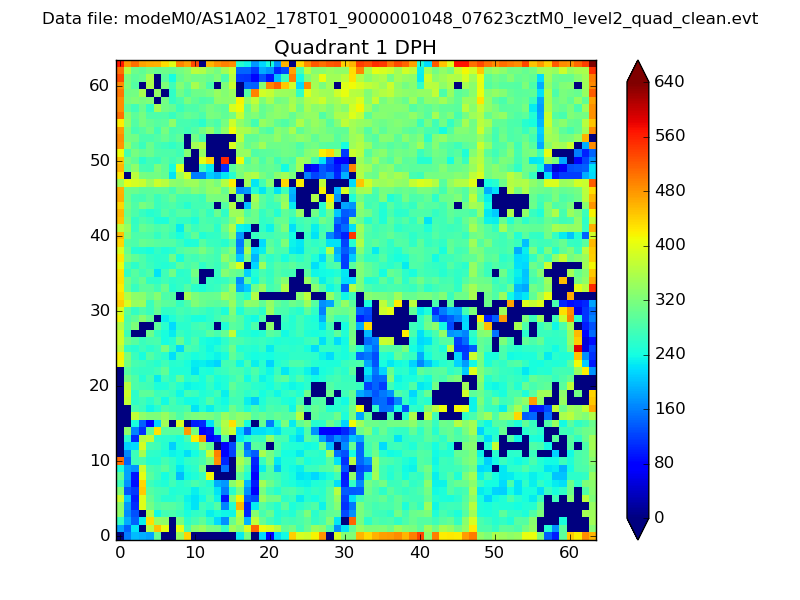 |
Quadrant B |
|---|---|---|---|
| Quadrant D | 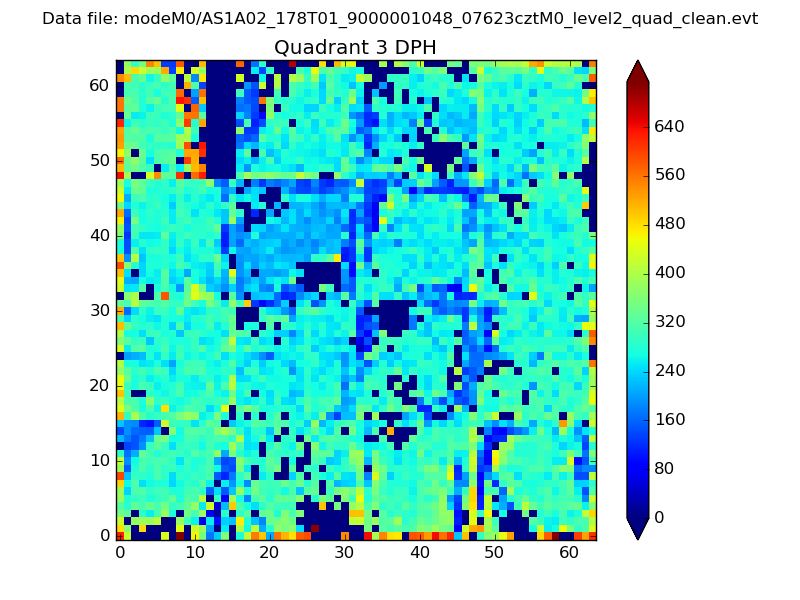 |
 |
Quadrant C |
| Plot type | Count rate plots | Images |
|---|---|---|
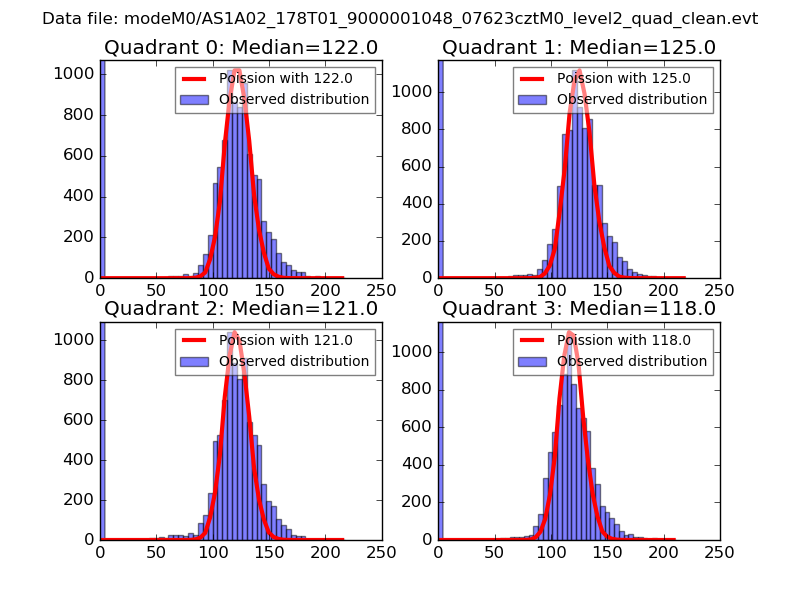
| Comparison with Poisson distribution Blue bars denote a histogram of data divided into 1 sec bins. Red curve is a Poisson curve with rate = median count rate of data. |
 |
 |
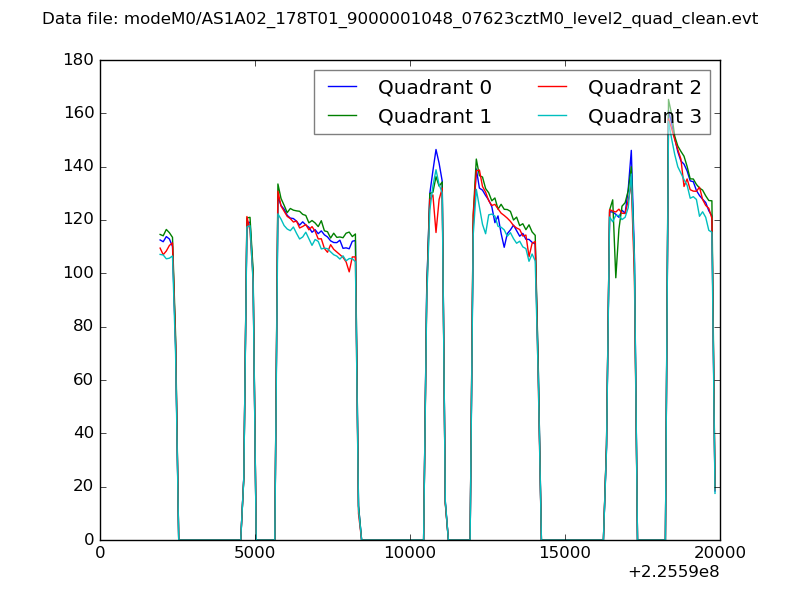
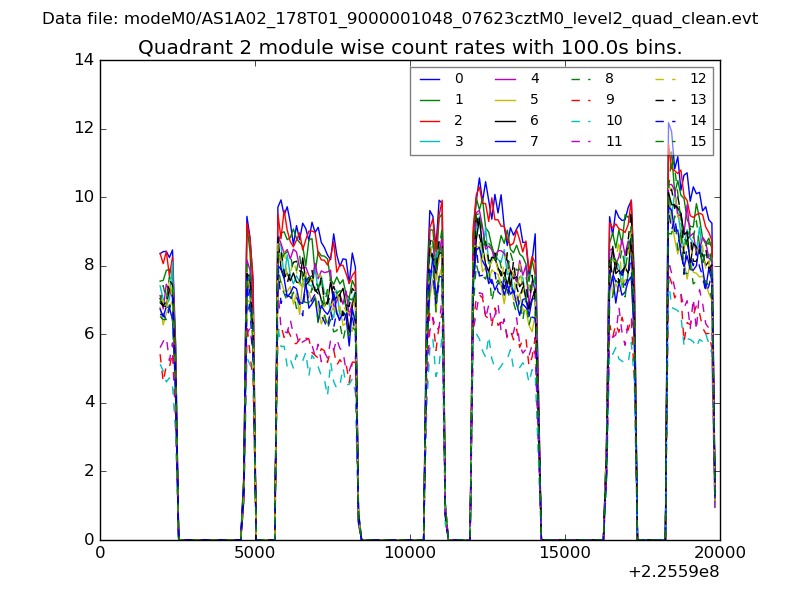
| Quadrant-wise count rates Data is divided into 100 sec bins |
 |
|
| Module-wise count rates for Quadrant A Data is divided into 100 sec bins |
 |
 |
| Module-wise count rates for Quadrant B Data is divided into 100 sec bins |
 |
 |
| Module-wise count rates for Quadrant C Data is divided into 100 sec bins |
 |
 |
| Module-wise count rates for Quadrant D Data is divided into 100 sec bins |
 |
 |
| Parameter | Plot |
|---|---|
| CZT HV Monitor | 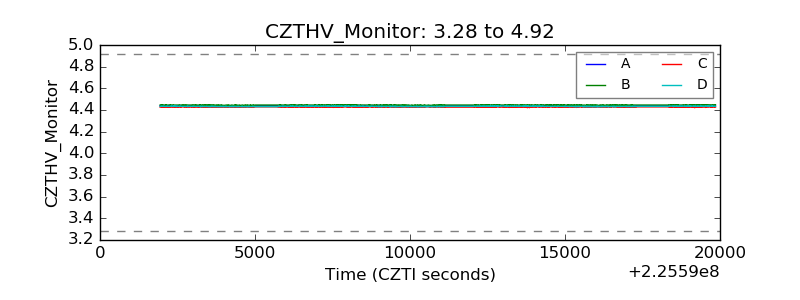 |
| D_VDD |  |
| Temperature 1 | 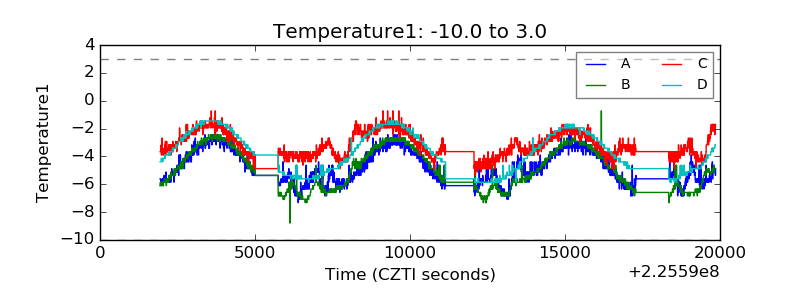 |
| Veto HV Monitor | 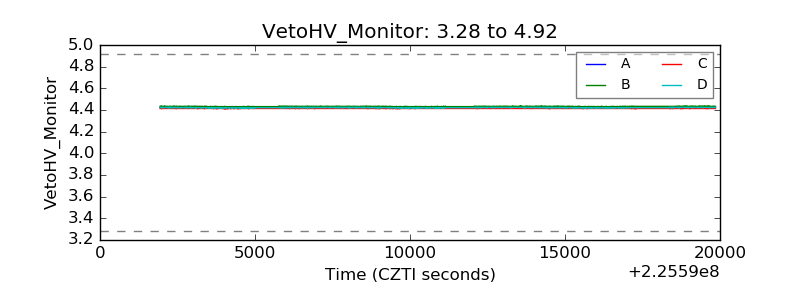 |
| Veto LLD |  |
| Alpha Counter | 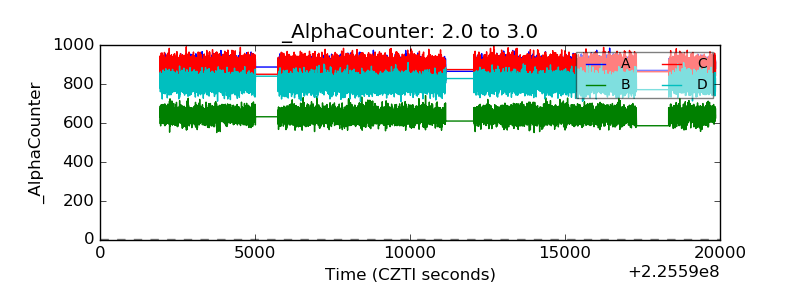 |
| _CPM_Rate | 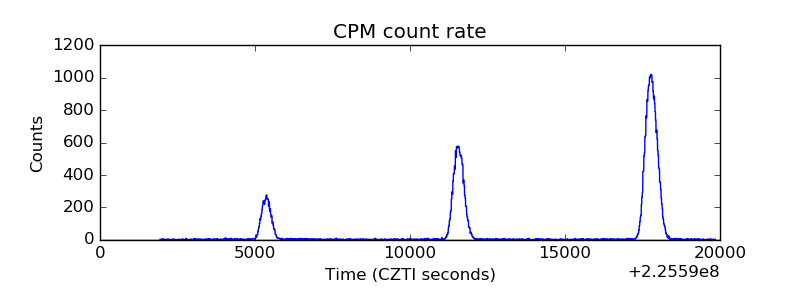 |
| CZT Counter | 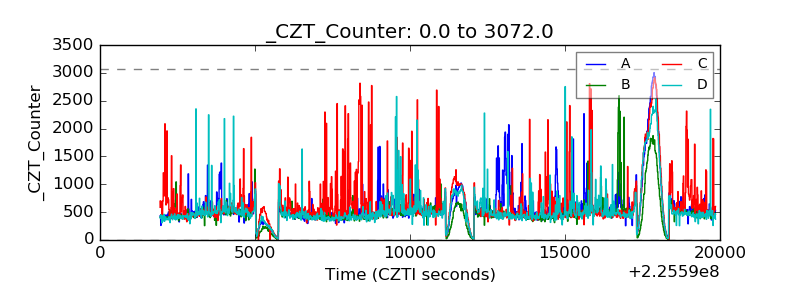 |
| +2.5 Volts monitor |  |
| +5 Volts monitor |  |
| _ROLL_ROT |  |
| _Roll_DEC | 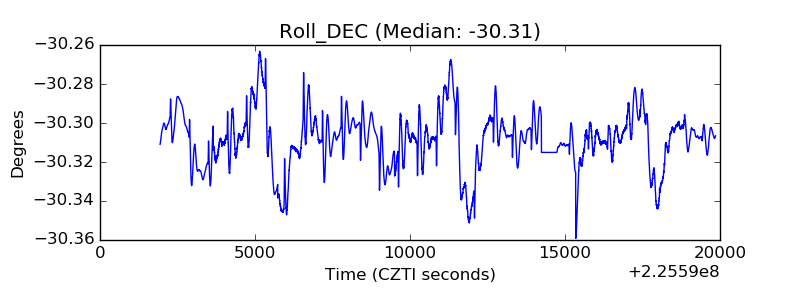 |
| _Roll_RA | 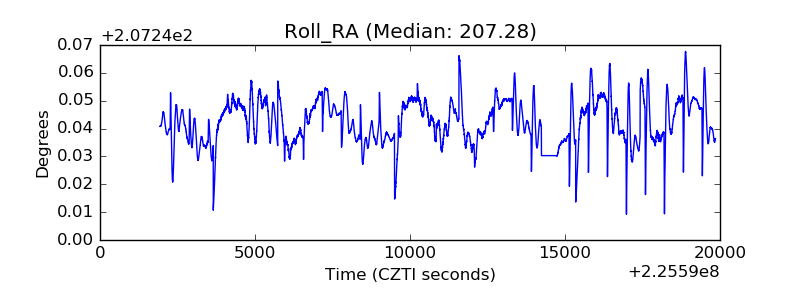 |
| Veto Counter | 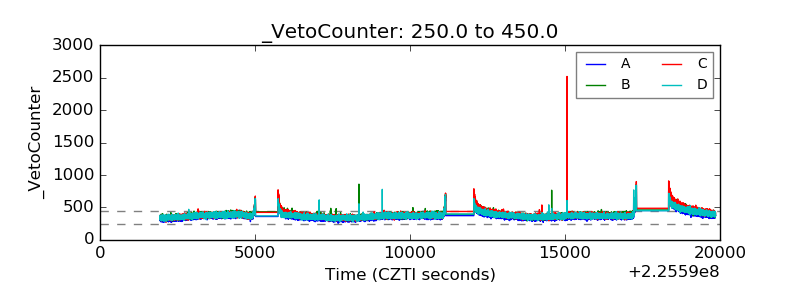 |