| Param | Original file | Final file |
|---|---|---|
| Filename | modeM0/AS1A02_178T01_9000001048_07625cztM0_level2.evt | modeM0/AS1A02_178T01_9000001048_07625cztM0_level2_quad_clean.evt |
| Size (bytes) | 492,742,080 | 75,654,720 |
| Size | 469.9 MB | 72.1 MB |
| Events in quadrant A | 3,431,012 | 477,380 |
| Events in quadrant B | 2,880,242 | 490,049 |
| Events in quadrant C | 5,231,150 | 458,552 |
| Events in quadrant D | 2,988,138 | 460,366 |
| Mode M9 | |||
|---|---|---|---|
| Quadrant | BADHDUFLAG | Total packets | Discarded packets |
| A | 0 | 12 | 0 |
| B | 0 | 12 | 0 |
| C | 0 | 12 | 0 |
| D | 0 | 12 | 0 |
| Mode M0 | |||
|---|---|---|---|
| Quadrant | BADHDUFLAG | Total packets | Discarded packets |
| A | 0 | 13998 | 2 |
| B | 0 | 12197 | 1 |
| C | 0 | 19442 | 1 |
| D | 0 | 12653 | 1 |
| Mode SS | |||
|---|---|---|---|
| Quadrant | BADHDUFLAG | Total packets | Discarded packets |
| A | 0 | 118 | 0 |
| B | 0 | 118 | 0 |
| C | 0 | 118 | 0 |
| D | 0 | 118 | 0 |
| Quadrant | Total seconds | Saturated seconds | Saturation percentage |
|---|---|---|---|
| A | 5782 | 76 | 1.314424% |
| B | 5782 | 68 | 1.176064% |
| C | 5782 | 444 | 7.679004% |
| D | 5782 | 82 | 1.418194% |
Noise dominated data is calculated using 1-second bins in cleaned event files. If a bin has >2000 counts, and if more than 50% of those come from <1% of pixels, then it is considered to be noise-dominated and hence unusable.
| Quadrant | # 1 sec bins | Bins with >0 counts | Bins with >2000 counts | High rate bins dominated by noise | Noise dominated (total time) | Noise dominated (detector-on time) | Marked lightcurve |
|---|---|---|---|---|---|---|---|
| A | 6942 | 5782 | 0 | 0 | 0.00% | 0.00% | 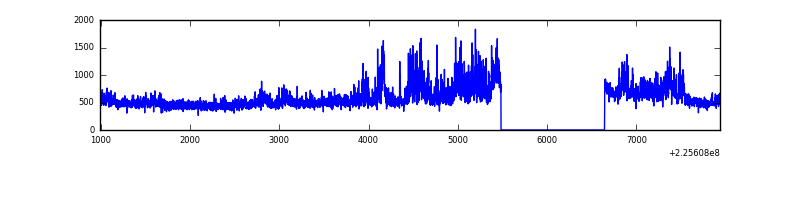 |
| B | 6942 | 5783 | 8 | 8 | 0.12% | 0.14% | 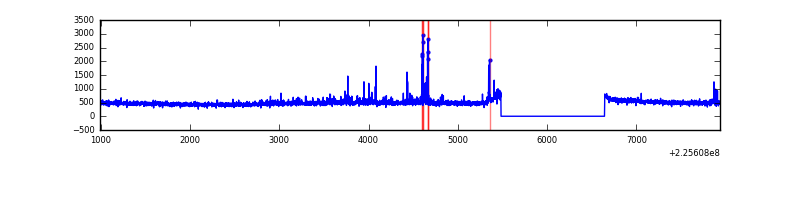 |
| C | 6942 | 5782 | 328 | 328 | 4.72% | 5.67% | 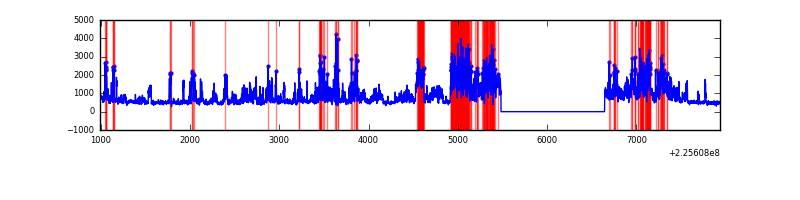 |
| D | 6942 | 5782 | 21 | 21 | 0.30% | 0.36% | 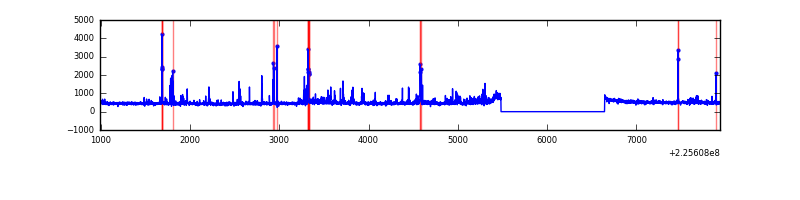 |
Top three noisy pixels from each quadrant. If the there are fewer than three noisy pixels in the level2.evt file, extra rows are filled as -1
| Pixel properties | Quadrant properties | ||||||
|---|---|---|---|---|---|---|---|
| Quadrant | DetID | PixID | Counts | Sigma | Mean | Median | Sigma |
| A | 13 | 251 | 694845 | 4834.62 | 707 | 692 | 143.6 |
| A | 13 | 14 | 9538 | 61.61 | 707 | 692 | 143.6 |
| A | 0 | 226 | 6839 | 42.81 | 707 | 692 | 143.6 |
| B | 0 | 229 | 59894 | 436.24 | 709 | 691 | 135.7 |
| B | 4 | 239 | 31149 | 224.43 | 709 | 691 | 135.7 |
| B | 0 | 214 | 28885 | 207.75 | 709 | 691 | 135.7 |
| C | 9 | 68 | 2546735 | 16178.66 | 678 | 682 | 157.4 |
| C | 8 | 229 | 36098 | 225.04 | 678 | 682 | 157.4 |
| C | 13 | 61 | 5189 | 28.64 | 678 | 682 | 157.4 |
| D | 2 | 152 | 167730 | 986.31 | 694 | 675 | 169.4 |
| D | 2 | 14 | 133529 | 784.38 | 694 | 675 | 169.4 |
| D | 3 | 14 | 18567 | 105.64 | 694 | 675 | 169.4 |
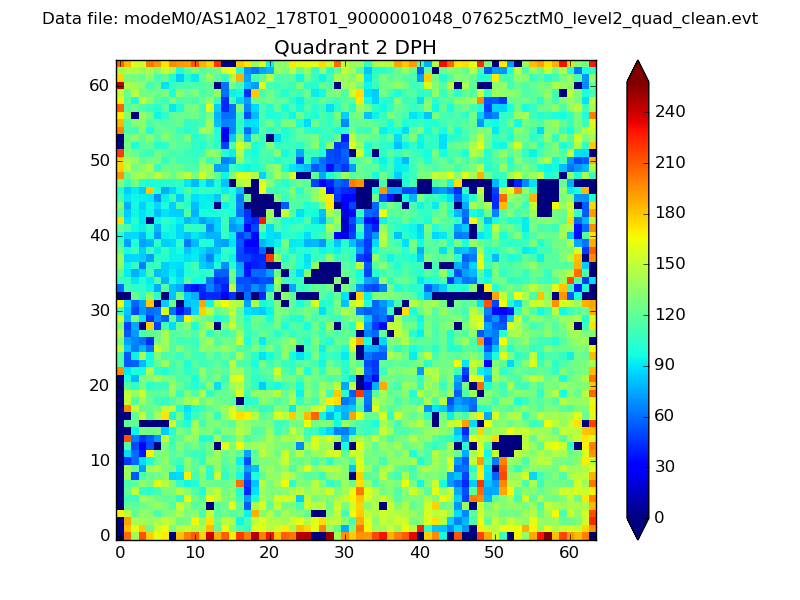
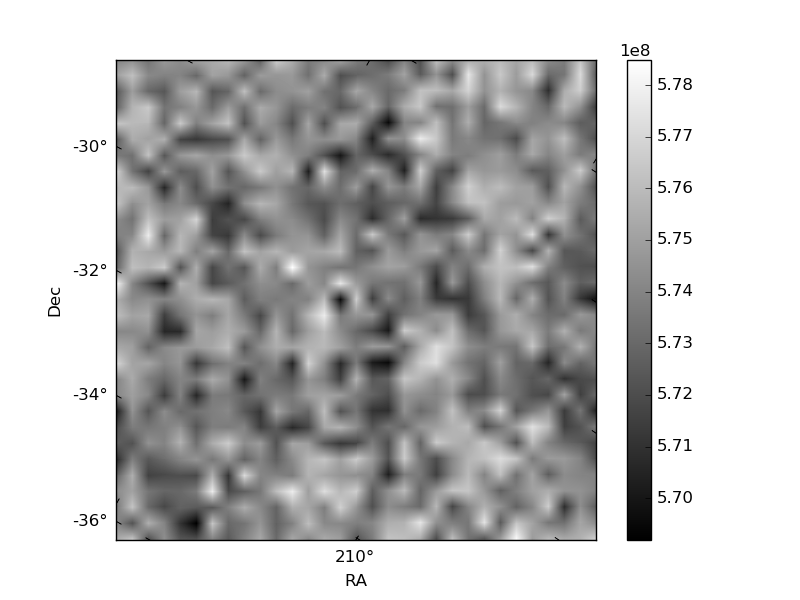
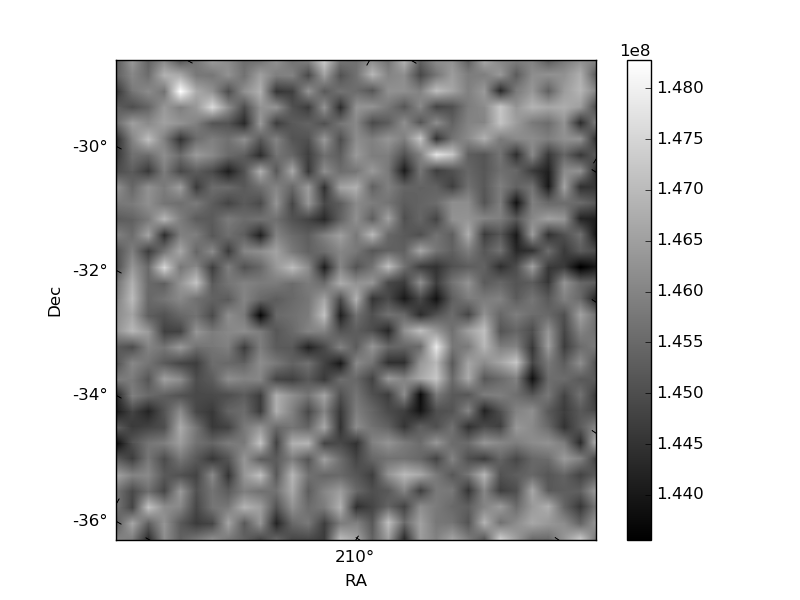
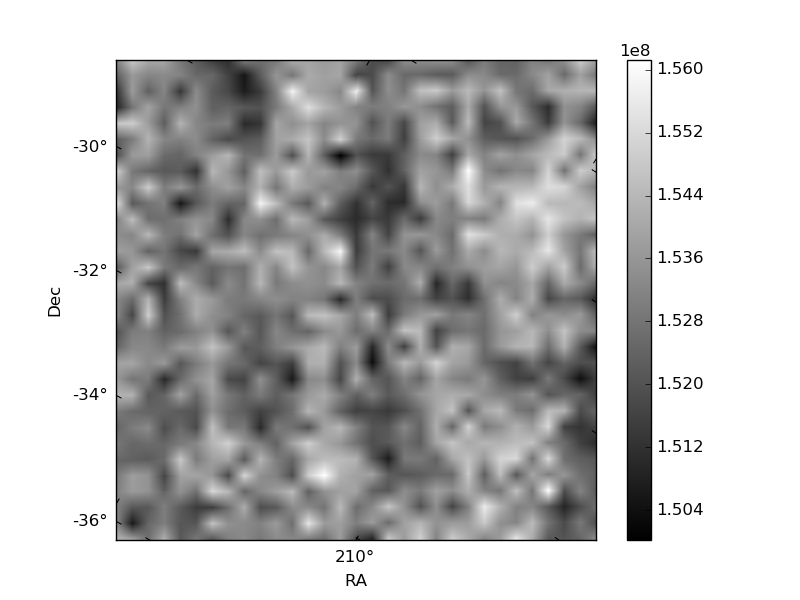
Histogram calculated using DETX and DETY for each event in the final _common_clean file
| Quadrant A | 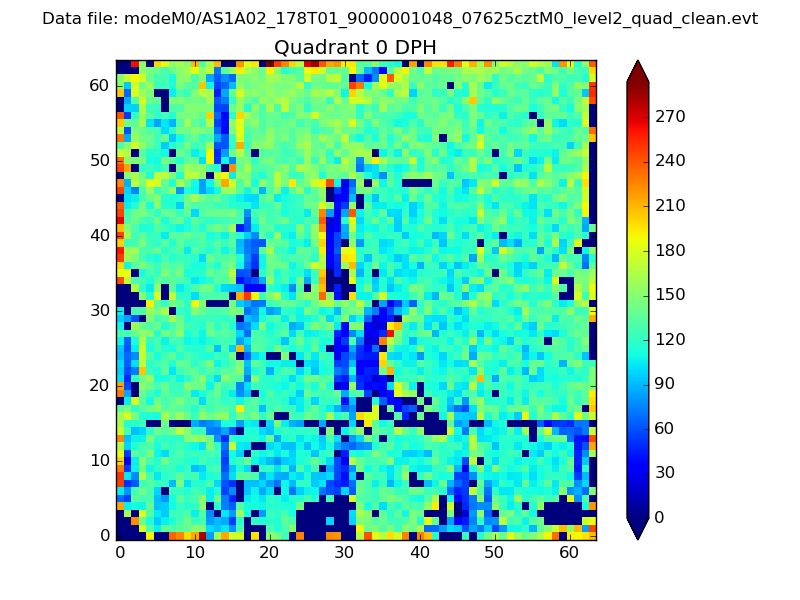 |
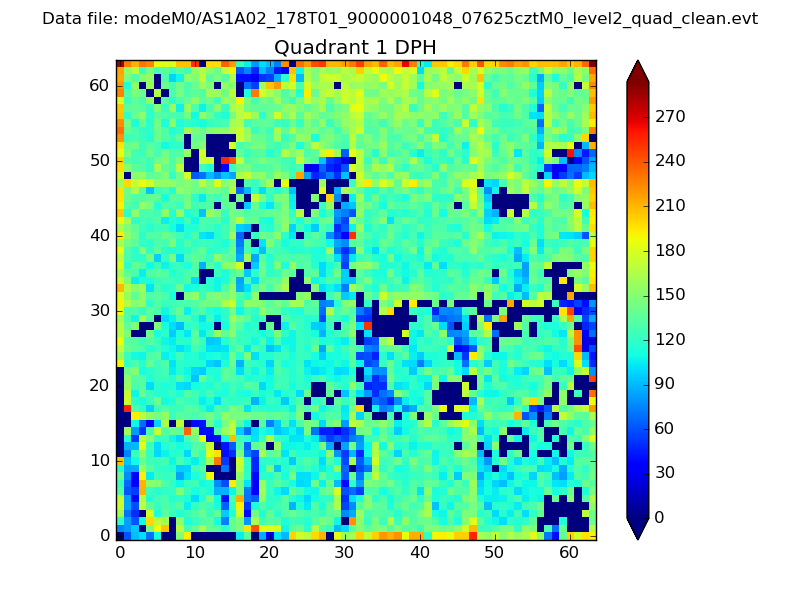 |
Quadrant B |
|---|---|---|---|
| Quadrant D | 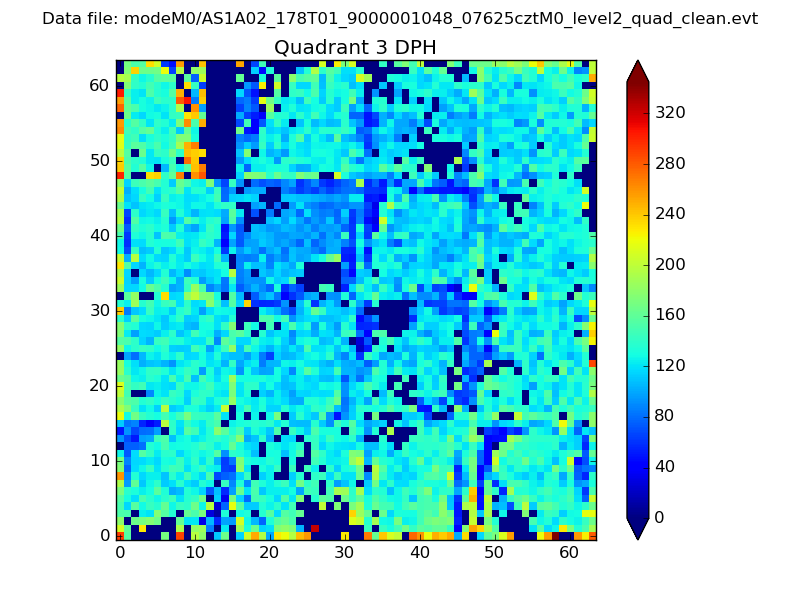 |
 |
Quadrant C |
| Plot type | Count rate plots | Images |
|---|---|---|
| Comparison with Poisson distribution Blue bars denote a histogram of data divided into 1 sec bins. Red curve is a Poisson curve with rate = median count rate of data. |
 |
 |
| Quadrant-wise count rates Data is divided into 100 sec bins |
 |
|
| Module-wise count rates for Quadrant A Data is divided into 100 sec bins |
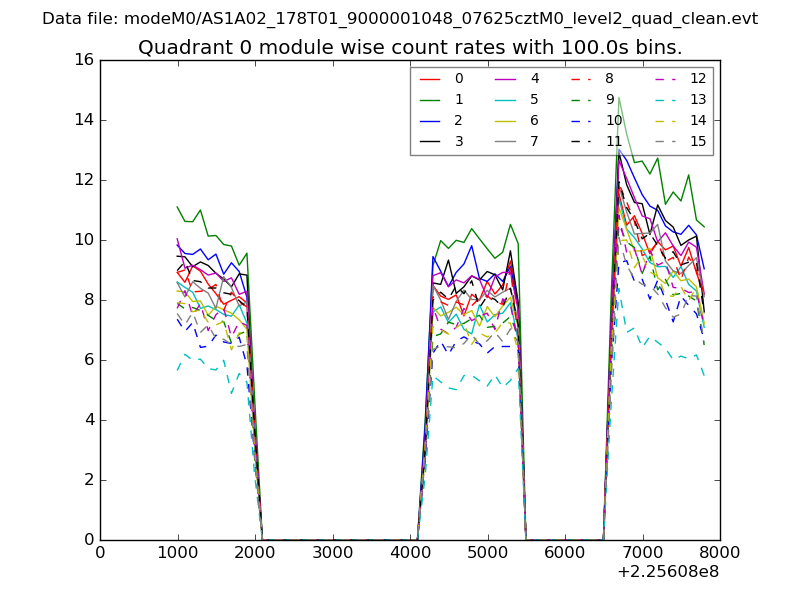 |
 |
| Module-wise count rates for Quadrant B Data is divided into 100 sec bins |
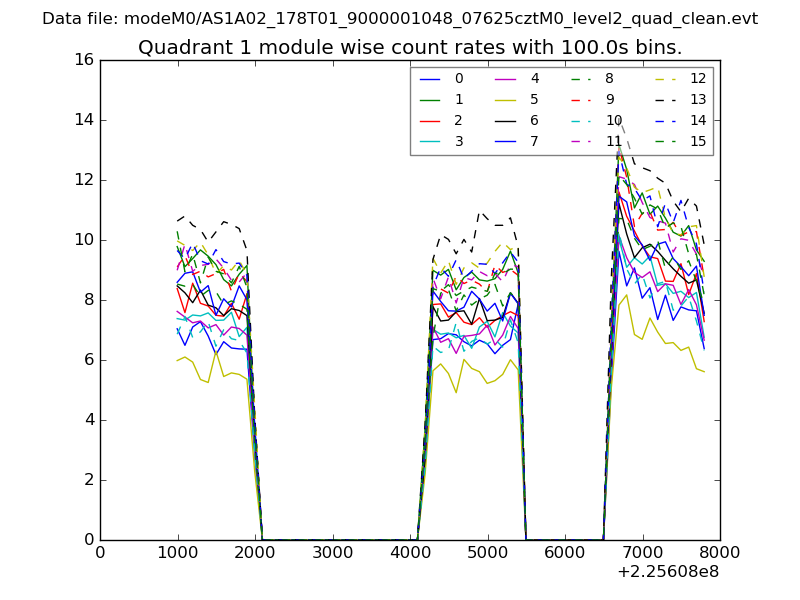 |
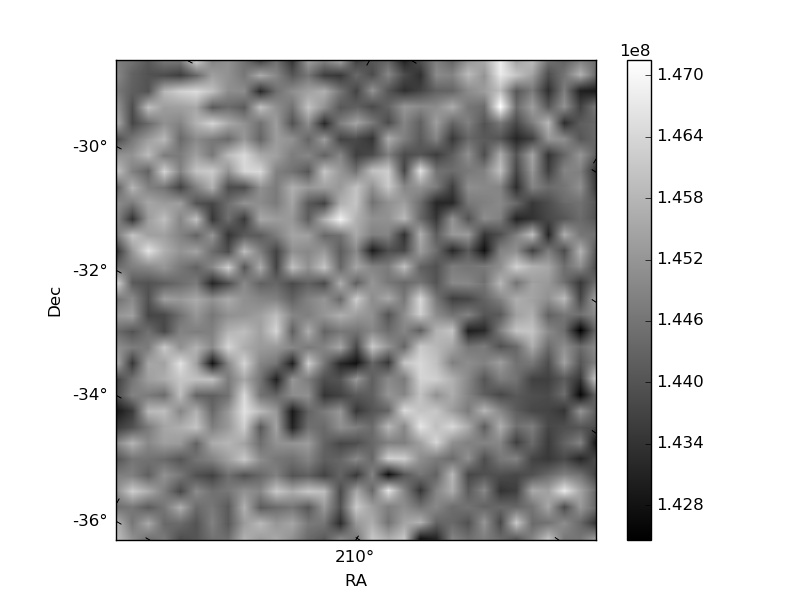 |
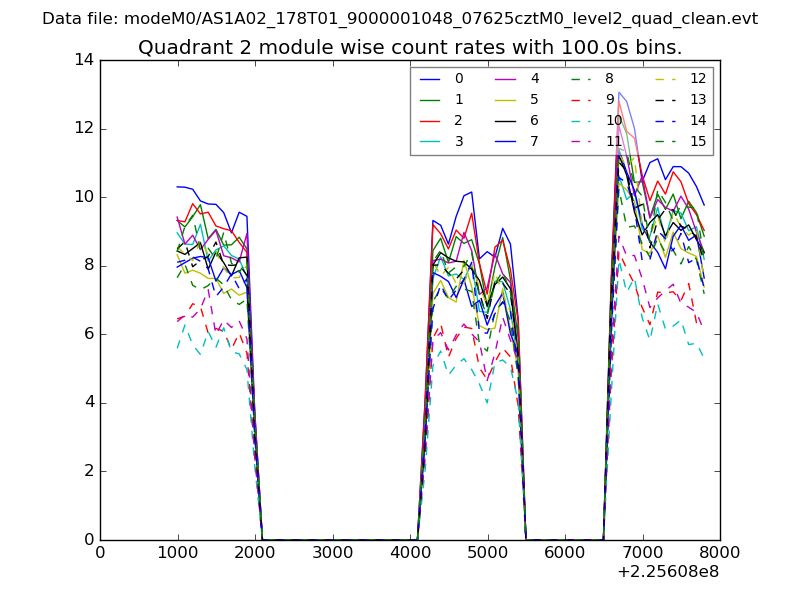
| Module-wise count rates for Quadrant C Data is divided into 100 sec bins |
 |
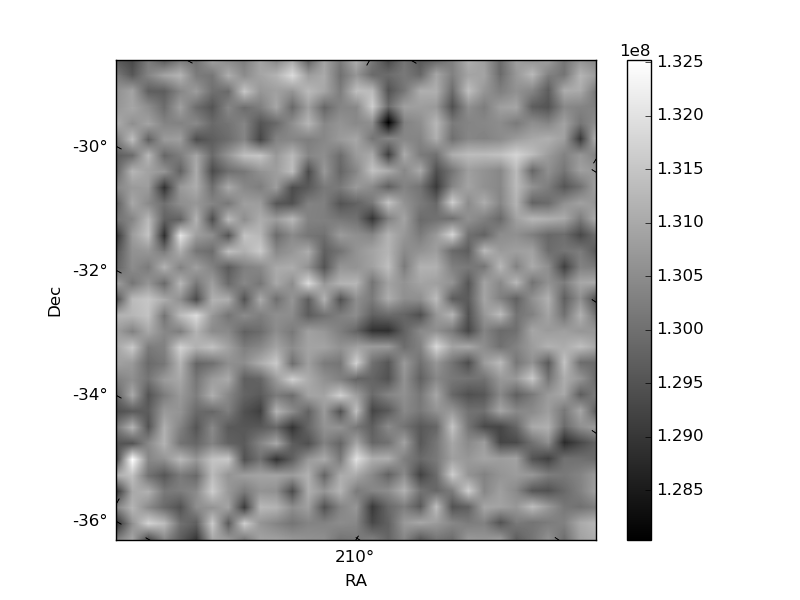 |
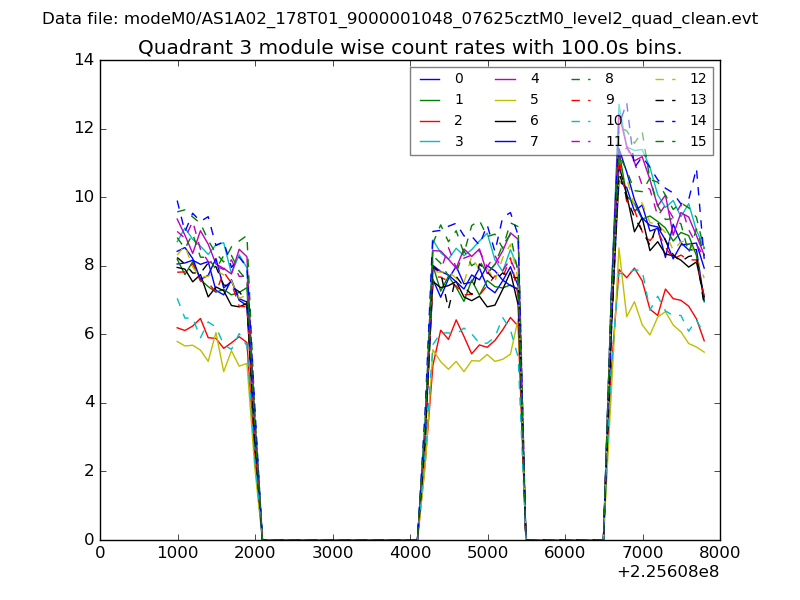
| Module-wise count rates for Quadrant D Data is divided into 100 sec bins |
 |
 |
| Parameter | Plot |
|---|---|
| CZT HV Monitor | 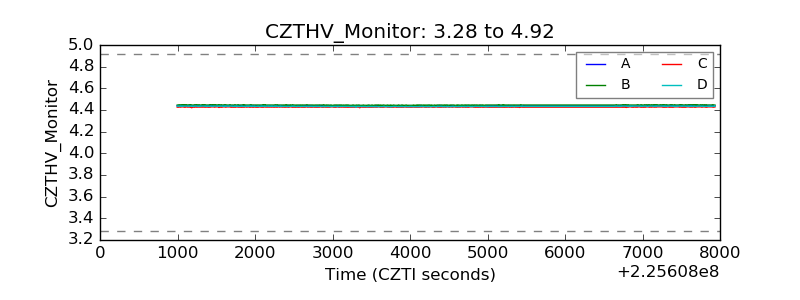 |
| D_VDD | 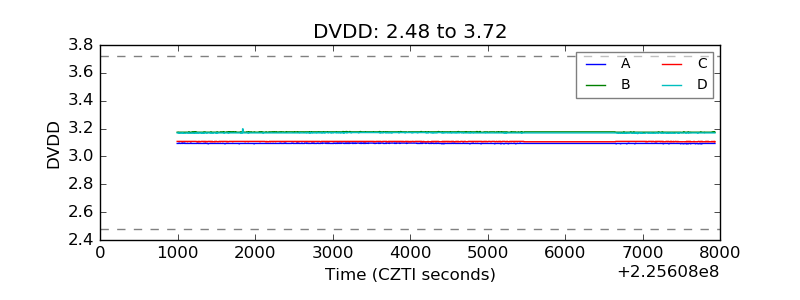 |
| Temperature 1 | 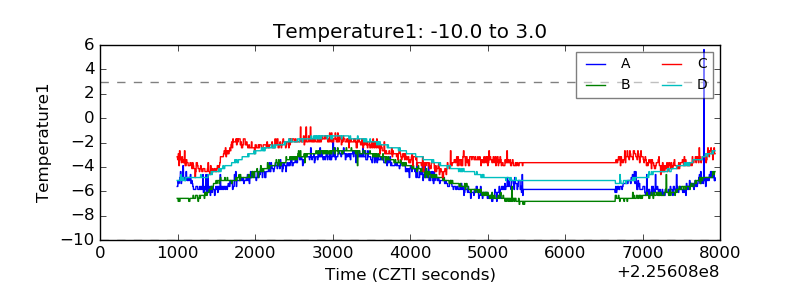 |
| Veto HV Monitor | 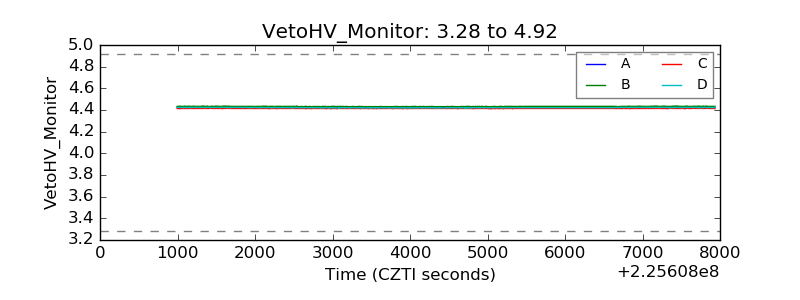 |
| Veto LLD | 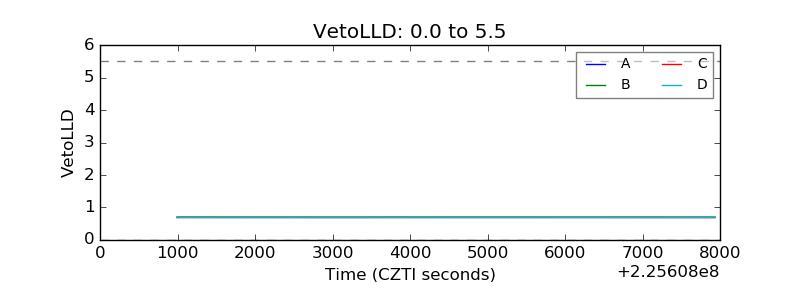 |
| Alpha Counter |  |
| _CPM_Rate |  |
| CZT Counter | 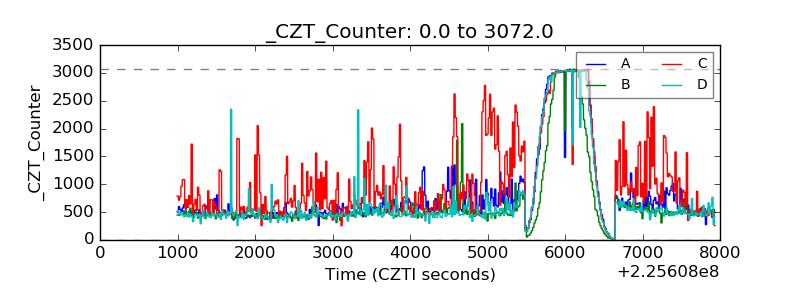 |
| +2.5 Volts monitor |  |
| +5 Volts monitor |  |
| _ROLL_ROT | 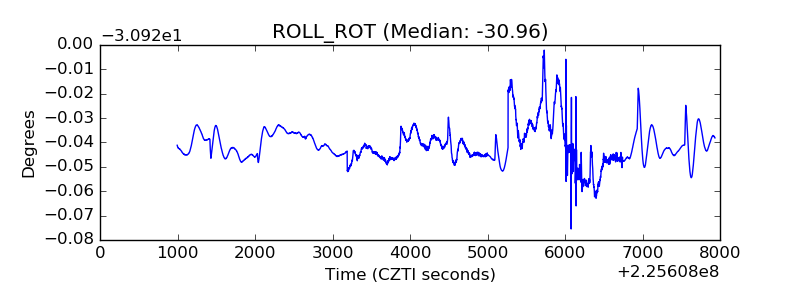 |
| _Roll_DEC | 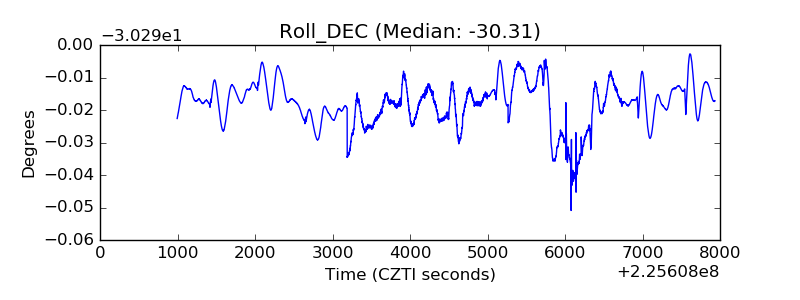 |
| _Roll_RA |  |
| Veto Counter | 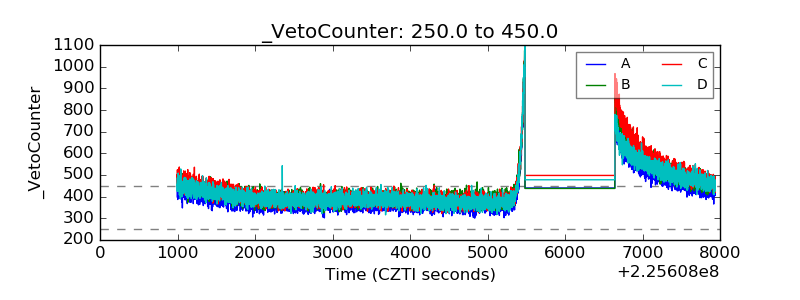 |