| Param | Original file | Final file |
|---|---|---|
| Filename | modeM0/AS1A02_178T01_9000001048_07626cztM0_level2.evt | modeM0/AS1A02_178T01_9000001048_07626cztM0_level2_quad_clean.evt |
| Size (bytes) | 471,268,800 | 74,416,320 |
| Size | 449.4 MB | 71.0 MB |
| Events in quadrant A | 3,809,650 | 463,867 |
| Events in quadrant B | 3,087,906 | 473,609 |
| Events in quadrant C | 3,877,203 | 457,955 |
| Events in quadrant D | 3,097,076 | 445,285 |
| Mode M9 | |||
|---|---|---|---|
| Quadrant | BADHDUFLAG | Total packets | Discarded packets |
| A | 0 | 12 | 0 |
| B | 0 | 12 | 0 |
| C | 0 | 12 | 0 |
| D | 0 | 12 | 0 |
| Mode M0 | |||
|---|---|---|---|
| Quadrant | BADHDUFLAG | Total packets | Discarded packets |
| A | 0 | 15202 | 2 |
| B | 0 | 12742 | 1 |
| C | 0 | 15387 | 1 |
| D | 0 | 12924 | 1 |
| Mode SS | |||
|---|---|---|---|
| Quadrant | BADHDUFLAG | Total packets | Discarded packets |
| A | 0 | 120 | 0 |
| B | 0 | 120 | 0 |
| C | 0 | 120 | 0 |
| D | 0 | 120 | 0 |
| Quadrant | Total seconds | Saturated seconds | Saturation percentage |
|---|---|---|---|
| A | 5905 | 70 | 1.185436% |
| B | 5905 | 72 | 1.219306% |
| C | 5905 | 118 | 1.998307% |
| D | 5905 | 53 | 0.897544% |
Noise dominated data is calculated using 1-second bins in cleaned event files. If a bin has >2000 counts, and if more than 50% of those come from <1% of pixels, then it is considered to be noise-dominated and hence unusable.
| Quadrant | # 1 sec bins | Bins with >0 counts | Bins with >2000 counts | High rate bins dominated by noise | Noise dominated (total time) | Noise dominated (detector-on time) | Marked lightcurve |
|---|---|---|---|---|---|---|---|
| A | 7180 | 5906 | 12 | 12 | 0.17% | 0.20% |  |
| B | 7180 | 5906 | 28 | 28 | 0.39% | 0.47% | 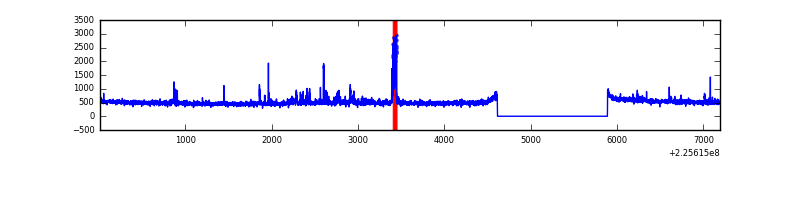 |
| C | 7180 | 5906 | 83 | 83 | 1.16% | 1.41% | 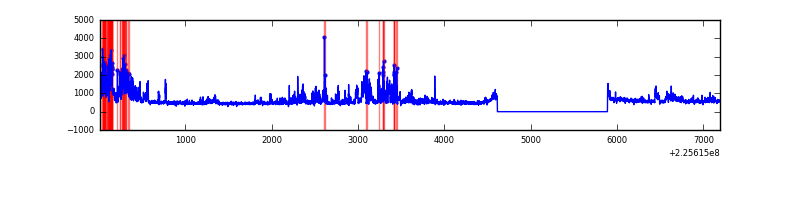 |
| D | 7180 | 5906 | 24 | 24 | 0.33% | 0.41% | 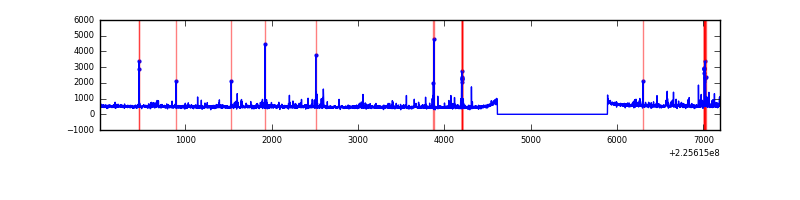 |
Top three noisy pixels from each quadrant. If the there are fewer than three noisy pixels in the level2.evt file, extra rows are filled as -1
| Pixel properties | Quadrant properties | ||||||
|---|---|---|---|---|---|---|---|
| Quadrant | DetID | PixID | Counts | Sigma | Mean | Median | Sigma |
| A | 13 | 251 | 921056 | 6080.31 | 750 | 736 | 151.4 |
| A | 0 | 226 | 7242 | 42.98 | 750 | 736 | 151.4 |
| A | 12 | 194 | 6604 | 38.77 | 750 | 736 | 151.4 |
| B | 4 | 239 | 86570 | 610.2 | 747 | 732 | 140.7 |
| B | 0 | 229 | 51013 | 357.43 | 747 | 732 | 140.7 |
| B | 10 | 245 | 14904 | 100.74 | 747 | 732 | 140.7 |
| C | 9 | 68 | 1009913 | 5986.83 | 731 | 736 | 168.6 |
| C | 1 | 16 | 11198 | 62.06 | 731 | 736 | 168.6 |
| C | 13 | 61 | 5448 | 27.95 | 731 | 736 | 168.6 |
| D | 2 | 152 | 127358 | 708.25 | 735 | 714 | 178.8 |
| D | 2 | 14 | 96846 | 537.61 | 735 | 714 | 178.8 |
| D | 5 | 233 | 40051 | 219.99 | 735 | 714 | 178.8 |
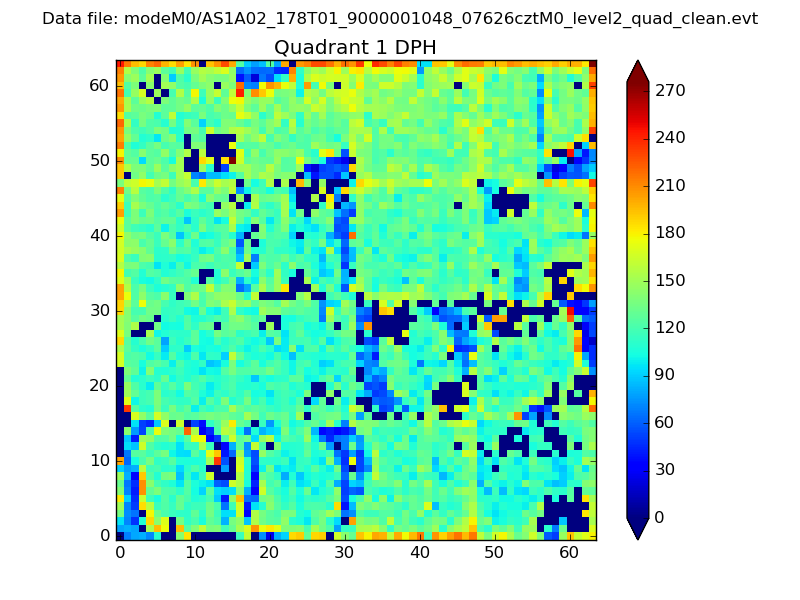
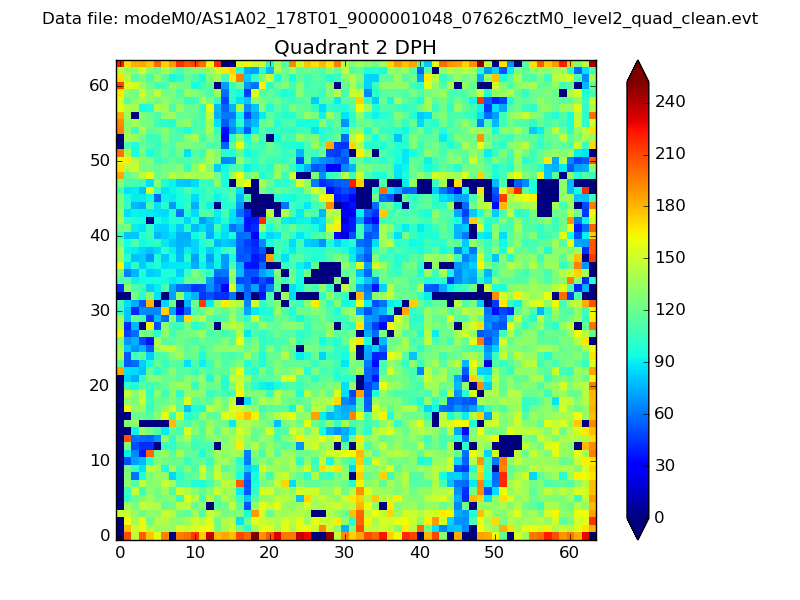
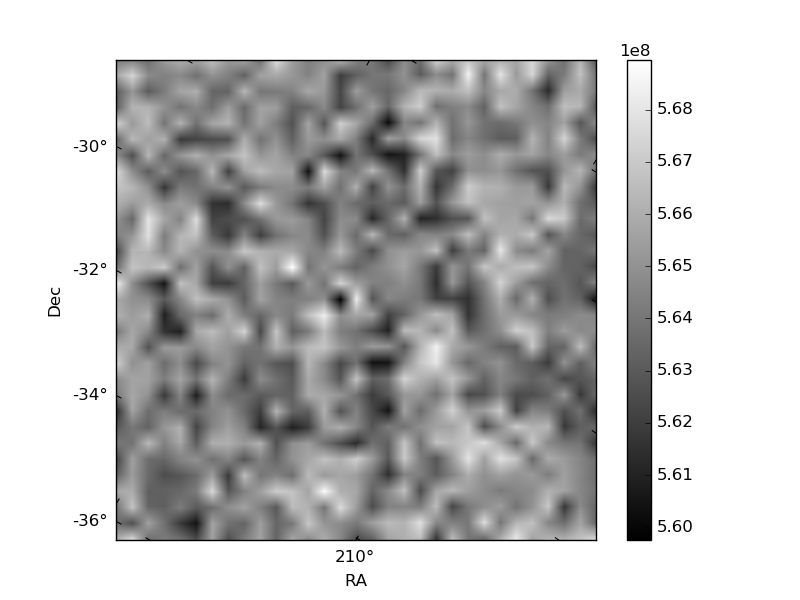
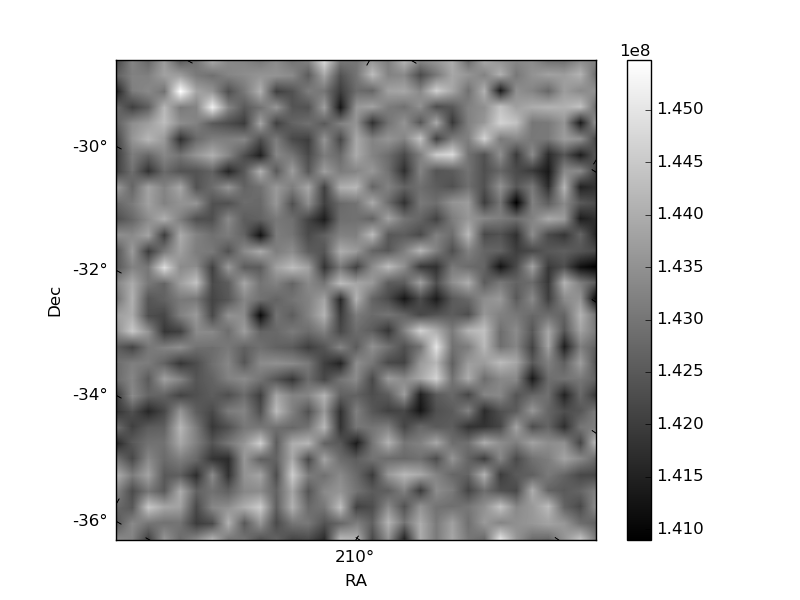
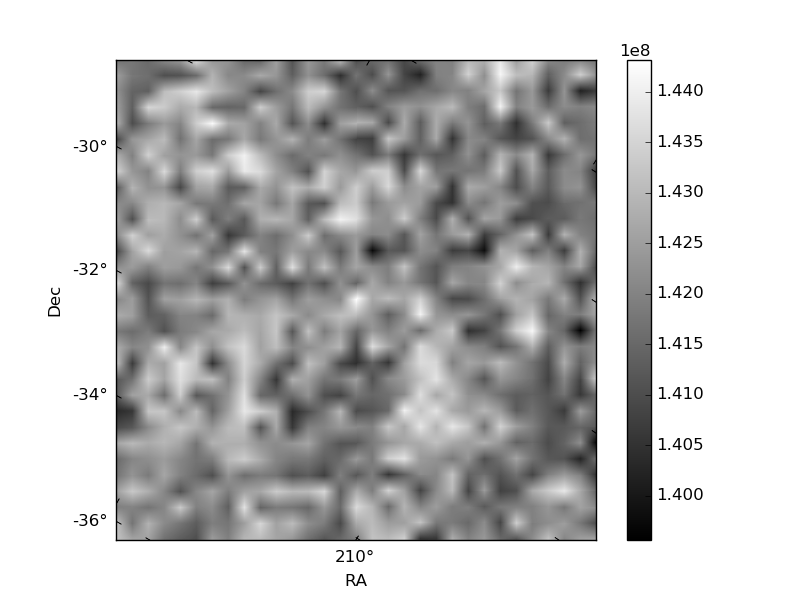
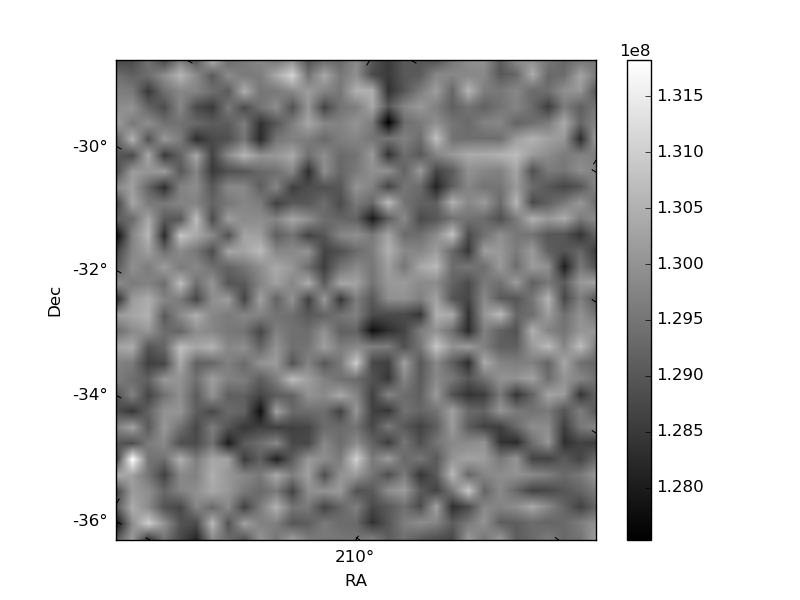
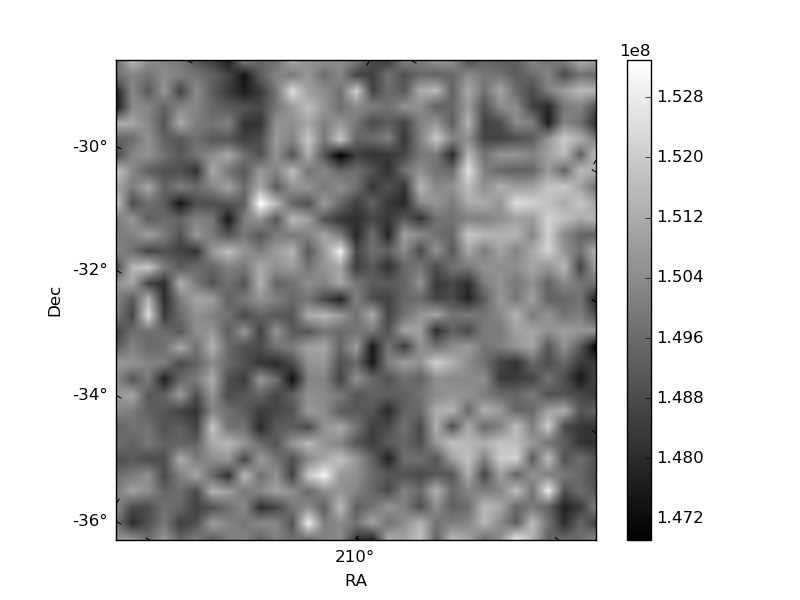
Histogram calculated using DETX and DETY for each event in the final _common_clean file
| Quadrant A | 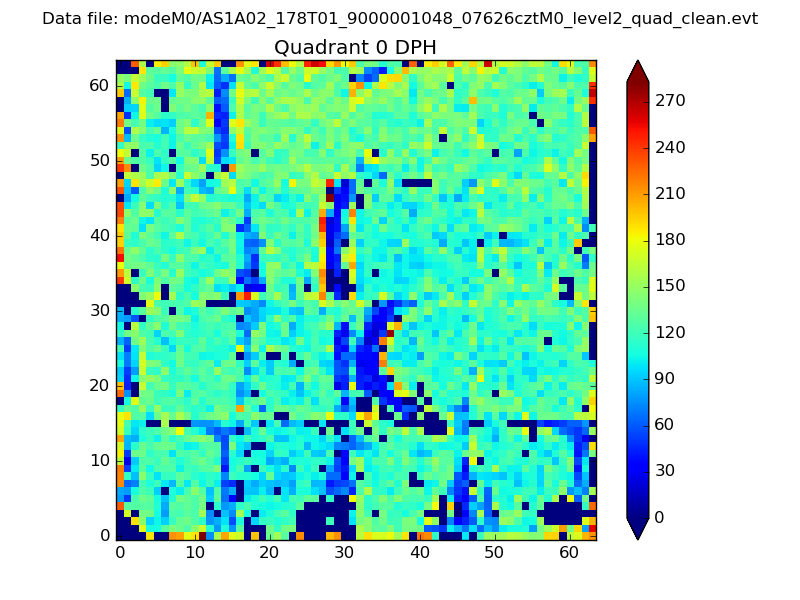 |
 |
Quadrant B |
|---|---|---|---|
| Quadrant D | 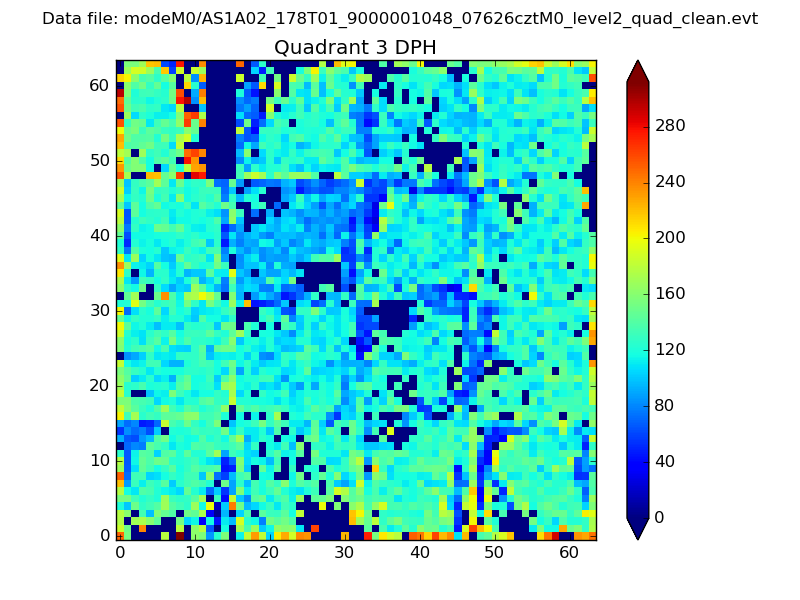 |
 |
Quadrant C |
| Plot type | Count rate plots | Images |
|---|---|---|
| Comparison with Poisson distribution Blue bars denote a histogram of data divided into 1 sec bins. Red curve is a Poisson curve with rate = median count rate of data. |
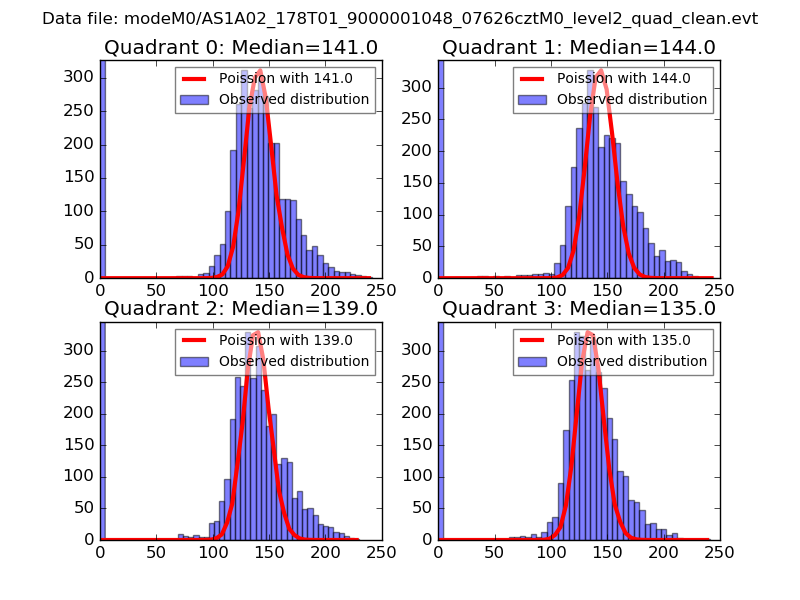 |
 |
| Quadrant-wise count rates Data is divided into 100 sec bins |
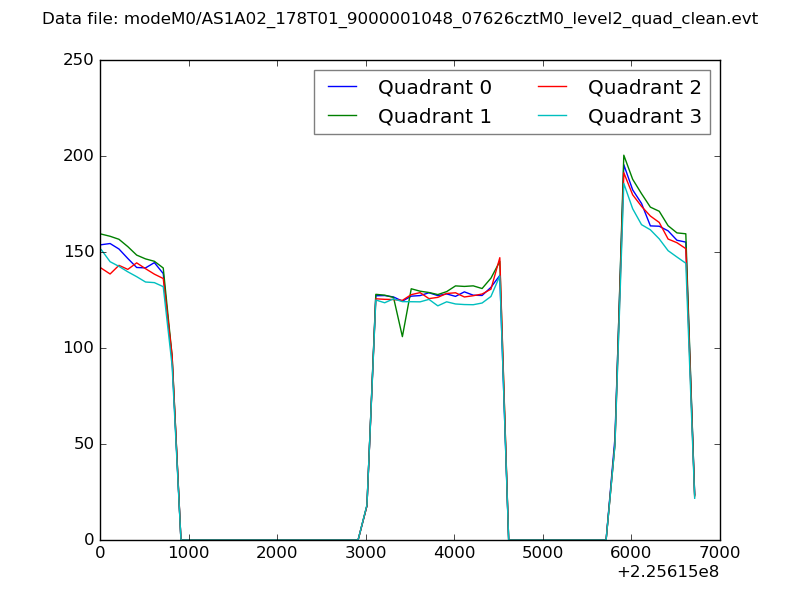 |
|
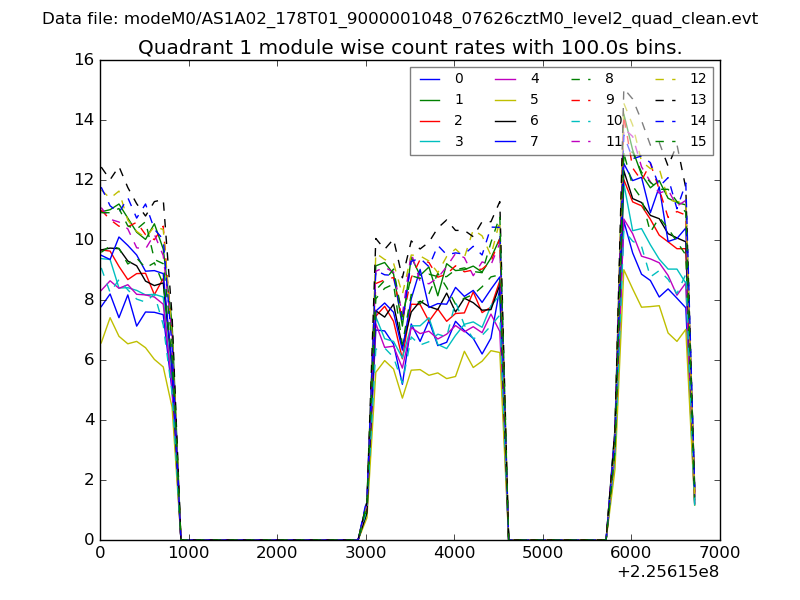
| Module-wise count rates for Quadrant A Data is divided into 100 sec bins |
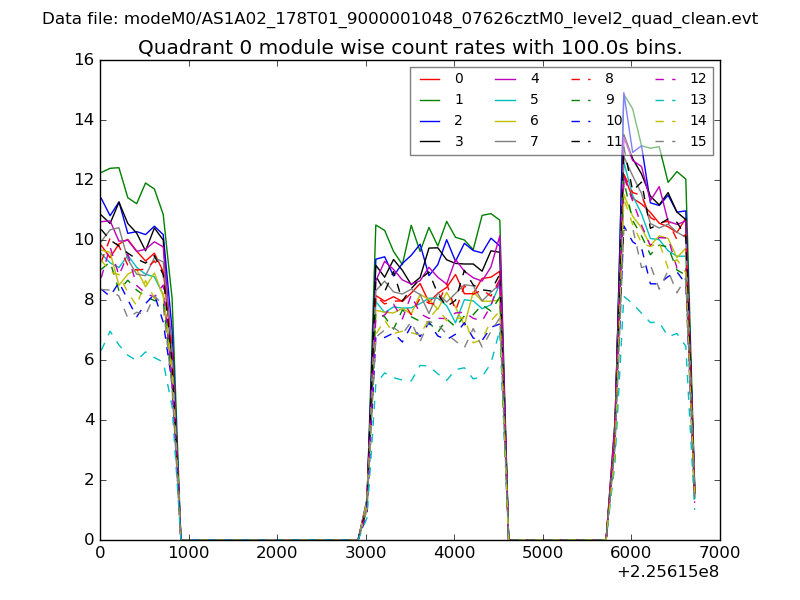 |
 |
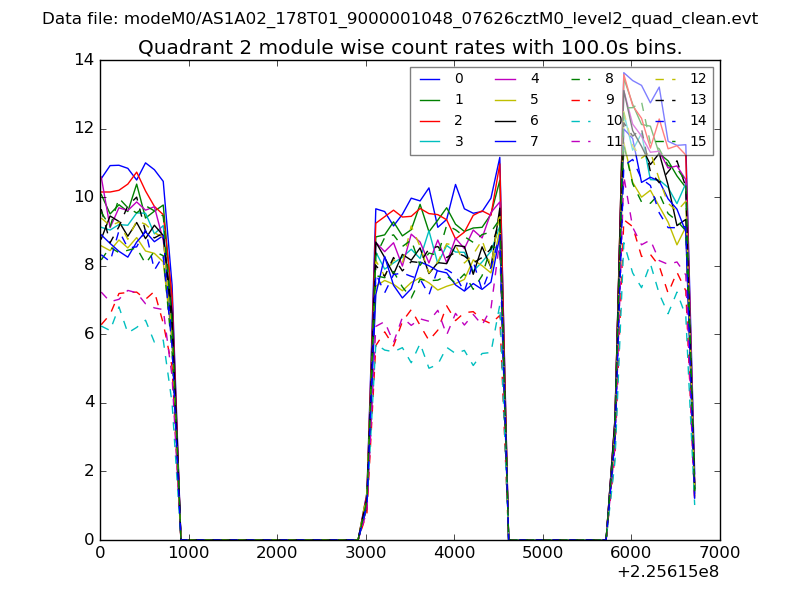
| Module-wise count rates for Quadrant B Data is divided into 100 sec bins |
 |
 |
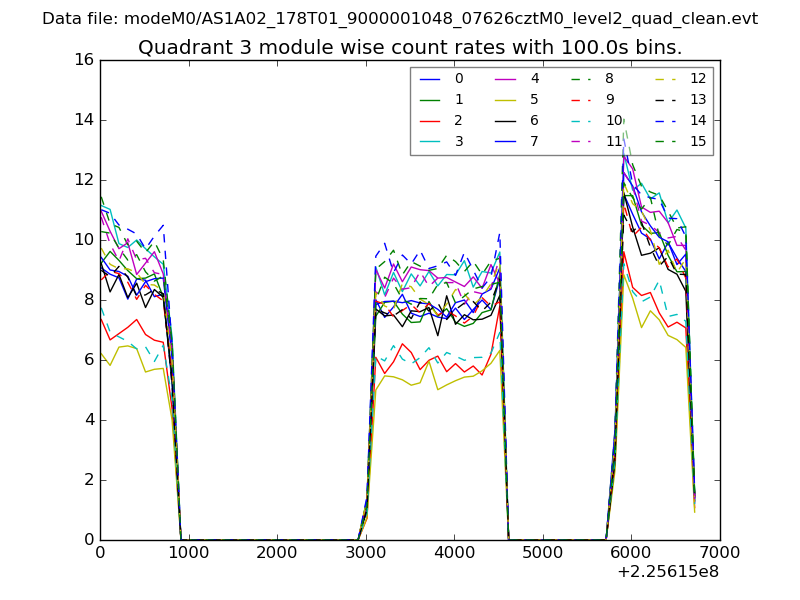
| Module-wise count rates for Quadrant C Data is divided into 100 sec bins |
 |
 |
| Module-wise count rates for Quadrant D Data is divided into 100 sec bins |
 |
 |
| Parameter | Plot |
|---|---|
| CZT HV Monitor | 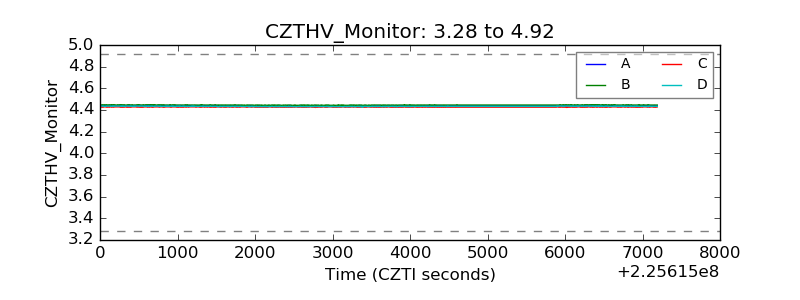 |
| D_VDD | 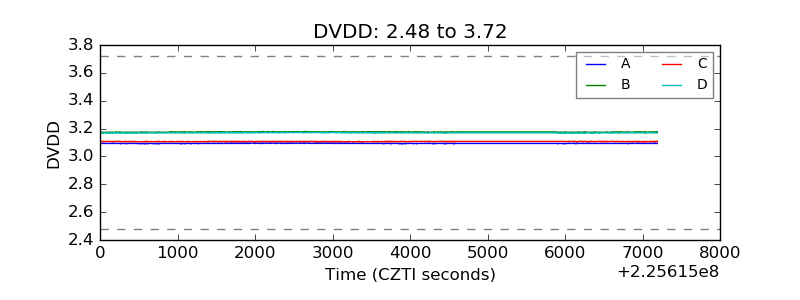 |
| Temperature 1 | 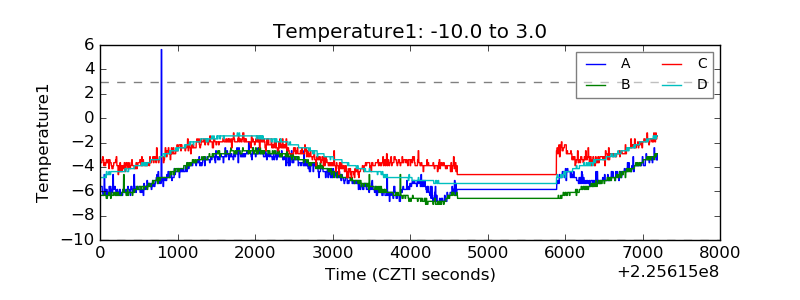 |
| Veto HV Monitor | 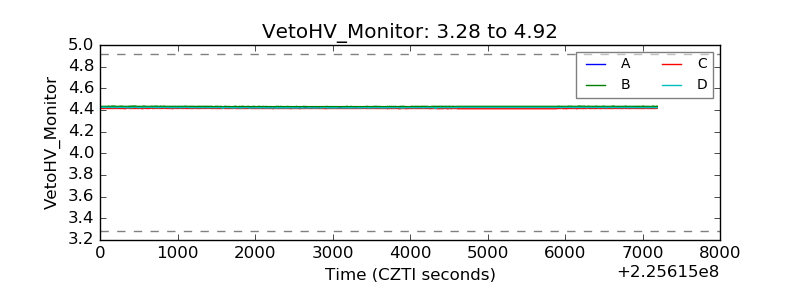 |
| Veto LLD | 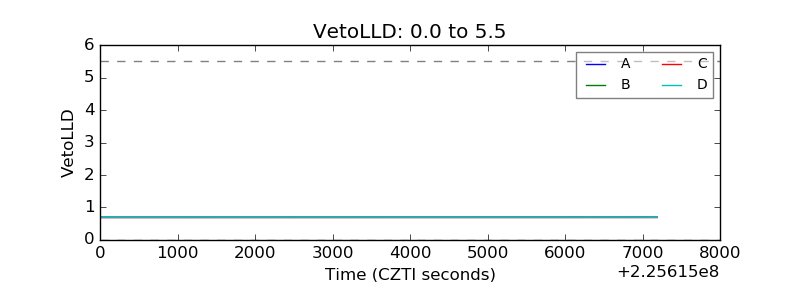 |
| Alpha Counter | 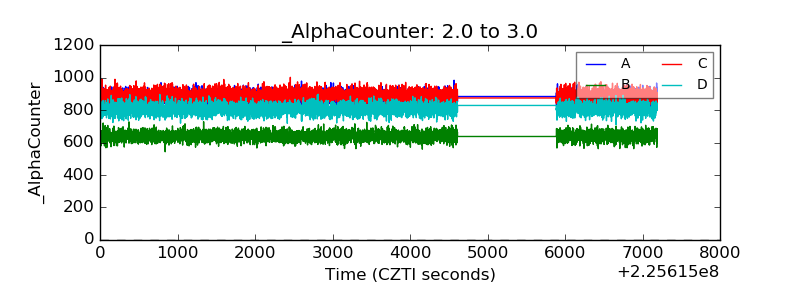 |
| _CPM_Rate | 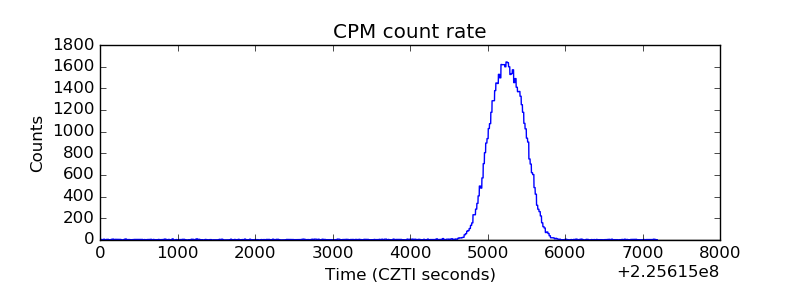 |
| CZT Counter | 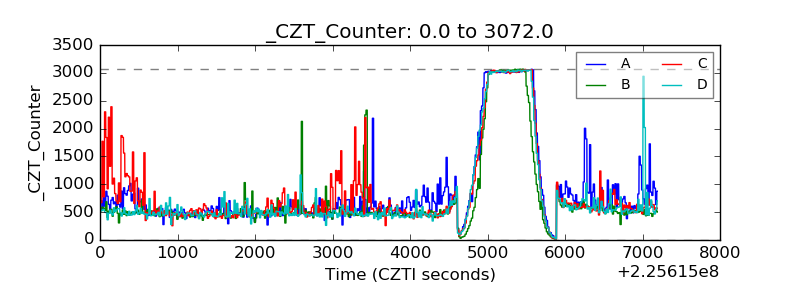 |
| +2.5 Volts monitor |  |
| +5 Volts monitor |  |
| _ROLL_ROT | 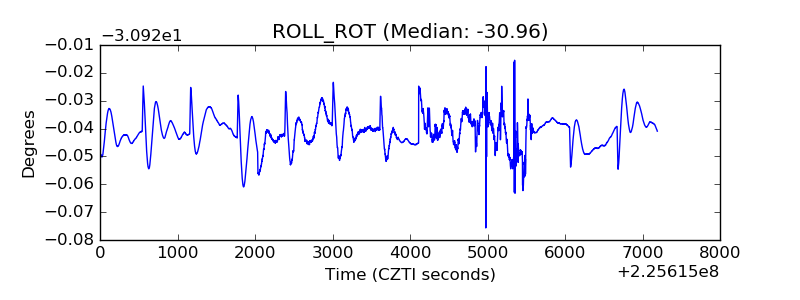 |
| _Roll_DEC | 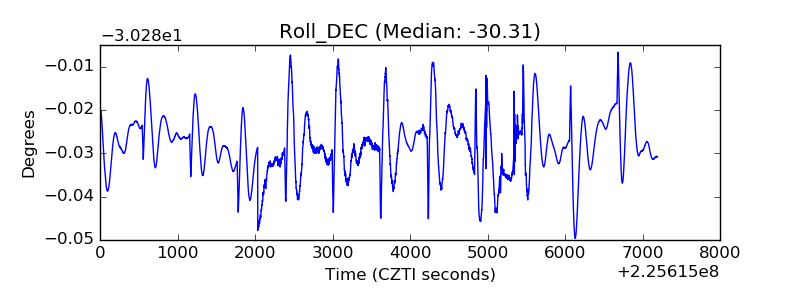 |
| _Roll_RA | 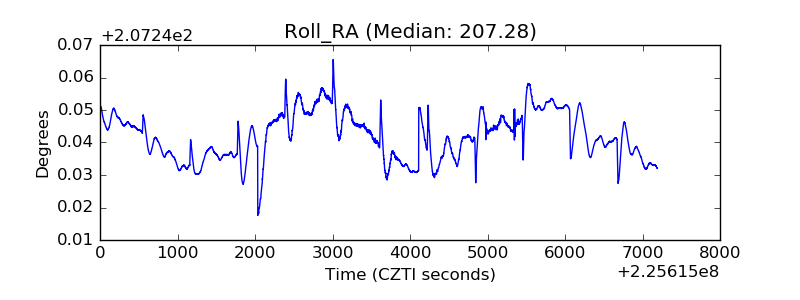 |
| Veto Counter | 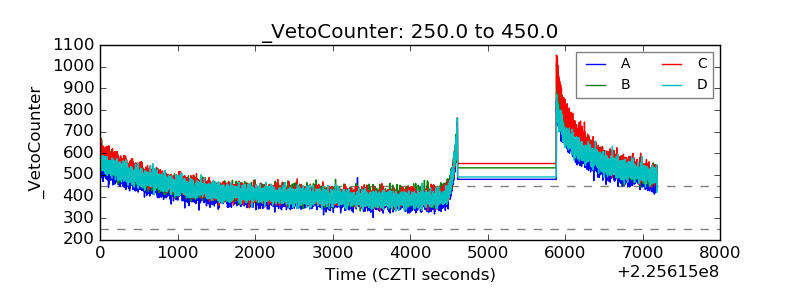 |