| Param | Original file | Final file |
|---|---|---|
| Filename | modeM0/AS1A02_178T01_9000001048_07628cztM0_level2.evt | modeM0/AS1A02_178T01_9000001048_07628cztM0_level2_quad_clean.evt |
| Size (bytes) | 540,956,160 | 67,423,680 |
| Size | 515.9 MB | 64.3 MB |
| Events in quadrant A | 3,704,100 | 401,080 |
| Events in quadrant B | 3,643,484 | 404,846 |
| Events in quadrant C | 4,767,891 | 390,756 |
| Events in quadrant D | 3,814,944 | 379,484 |
| Mode M9 | |||
|---|---|---|---|
| Quadrant | BADHDUFLAG | Total packets | Discarded packets |
| A | 0 | 19 | 0 |
| B | 0 | 19 | 0 |
| C | 0 | 19 | 0 |
| D | 0 | 20 | 0 |
| Mode M0 | |||
|---|---|---|---|
| Quadrant | BADHDUFLAG | Total packets | Discarded packets |
| A | 0 | 15193 | 3 |
| B | 0 | 14733 | 2 |
| C | 0 | 18620 | 2 |
| D | 0 | 15598 | 2 |
| Mode SS | |||
|---|---|---|---|
| Quadrant | BADHDUFLAG | Total packets | Discarded packets |
| A | 0 | 134 | 0 |
| B | 0 | 134 | 0 |
| C | 0 | 134 | 0 |
| D | 0 | 134 | 0 |
| Quadrant | Total seconds | Saturated seconds | Saturation percentage |
|---|---|---|---|
| A | 6677 | 157 | 2.351355% |
| B | 6677 | 138 | 2.066796% |
| C | 6677 | 368 | 5.511457% |
| D | 6677 | 150 | 2.246518% |
Noise dominated data is calculated using 1-second bins in cleaned event files. If a bin has >2000 counts, and if more than 50% of those come from <1% of pixels, then it is considered to be noise-dominated and hence unusable.
| Quadrant | # 1 sec bins | Bins with >0 counts | Bins with >2000 counts | High rate bins dominated by noise | Noise dominated (total time) | Noise dominated (detector-on time) | Marked lightcurve |
|---|---|---|---|---|---|---|---|
| A | 7947 | 6677 | 12 | 12 | 0.15% | 0.18% | 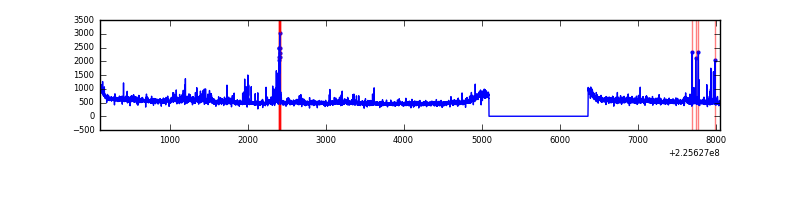 |
| B | 7947 | 6677 | 2 | 2 | 0.03% | 0.03% | 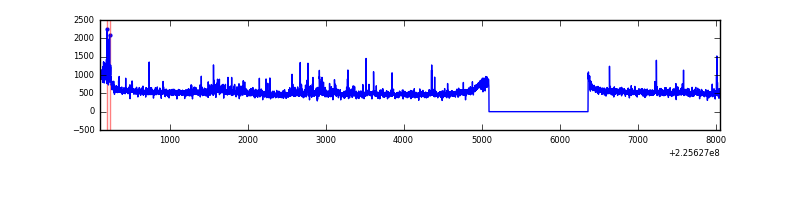 |
| C | 7947 | 6678 | 159 | 159 | 2.00% | 2.38% | 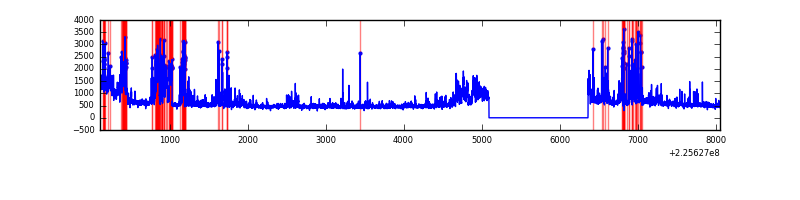 |
| D | 7947 | 6677 | 32 | 32 | 0.40% | 0.48% | 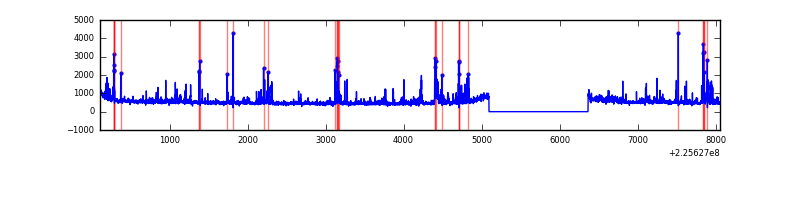 |
Top three noisy pixels from each quadrant. If the there are fewer than three noisy pixels in the level2.evt file, extra rows are filled as -1
| Pixel properties | Quadrant properties | ||||||
|---|---|---|---|---|---|---|---|
| Quadrant | DetID | PixID | Counts | Sigma | Mean | Median | Sigma |
| A | 13 | 251 | 303548 | 1703.21 | 883 | 863 | 177.7 |
| A | 0 | 226 | 8444 | 42.66 | 883 | 863 | 177.7 |
| A | 12 | 194 | 7804 | 39.06 | 883 | 863 | 177.7 |
| B | 0 | 219 | 84144 | 505.6 | 878 | 859 | 164.7 |
| B | 4 | 81 | 69767 | 418.32 | 878 | 859 | 164.7 |
| B | 0 | 214 | 31808 | 187.88 | 878 | 859 | 164.7 |
| C | 9 | 68 | 983907 | 5115.32 | 841 | 846 | 192.2 |
| C | 4 | 254 | 451202 | 2343.41 | 841 | 846 | 192.2 |
| C | 1 | 16 | 39118 | 199.15 | 841 | 846 | 192.2 |
| D | 2 | 152 | 168394 | 801.57 | 856 | 830 | 209.0 |
| D | 2 | 14 | 154415 | 734.7 | 856 | 830 | 209.0 |
| D | 14 | 34 | 92444 | 438.25 | 856 | 830 | 209.0 |
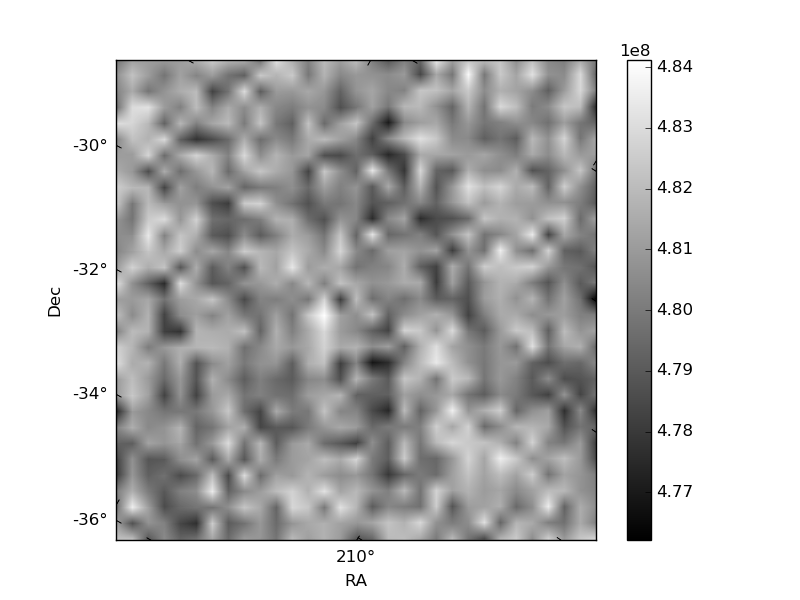
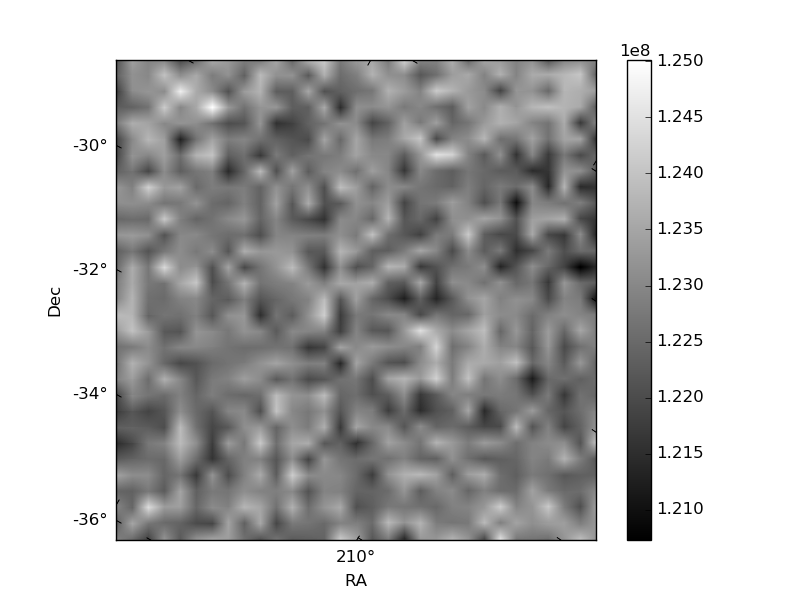
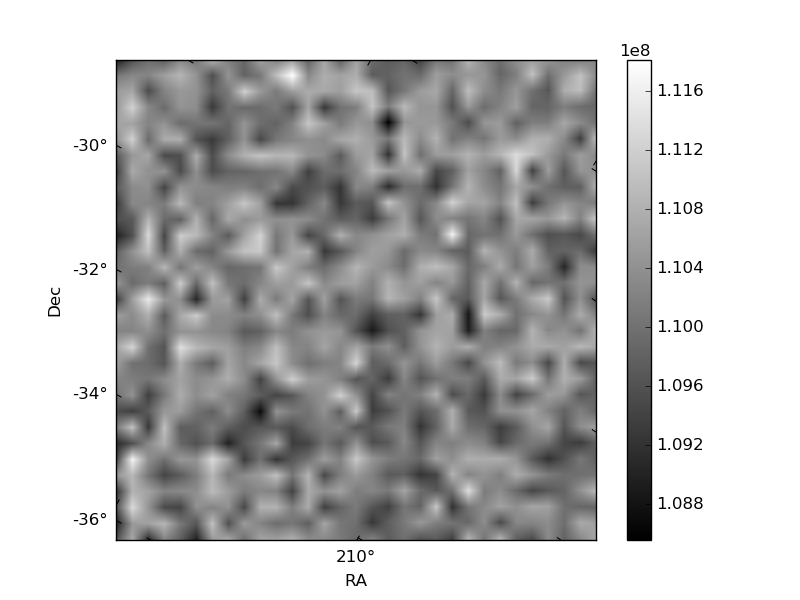
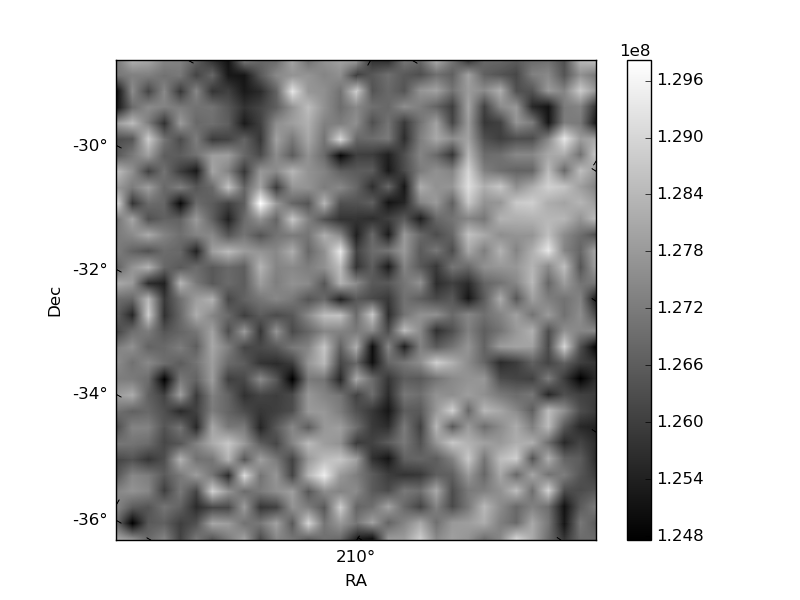
Histogram calculated using DETX and DETY for each event in the final _common_clean file
| Quadrant A | 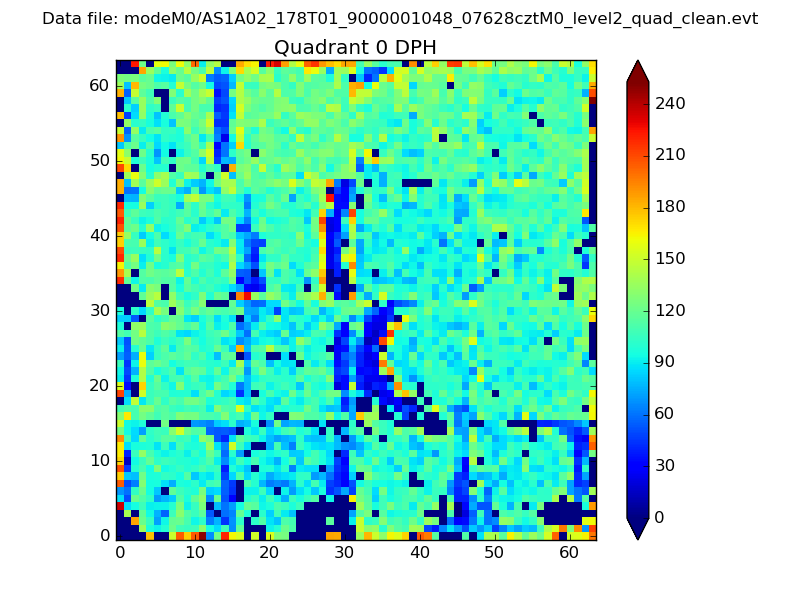 |
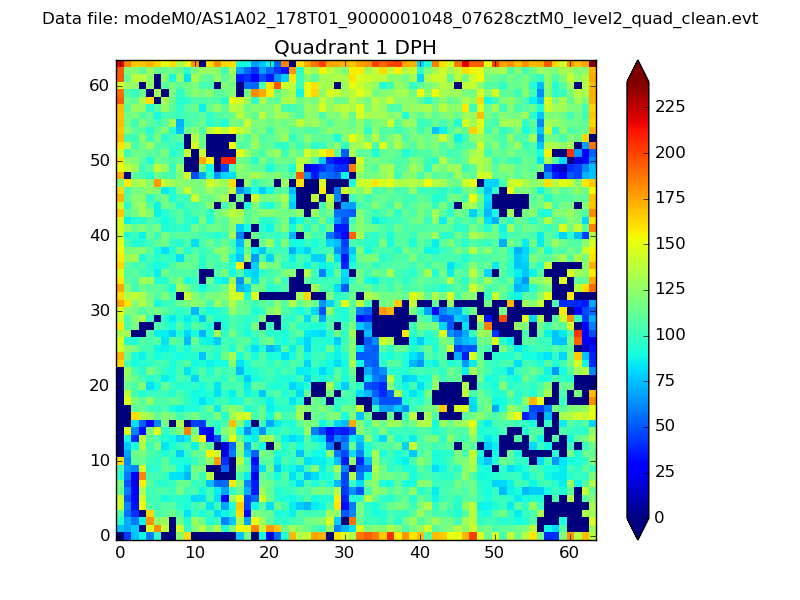 |
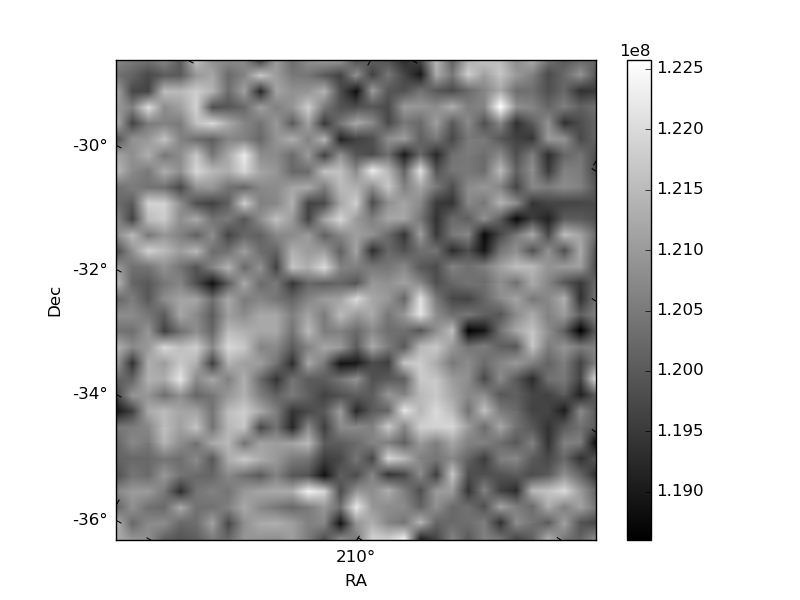
Quadrant B |
|---|---|---|---|
| Quadrant D | 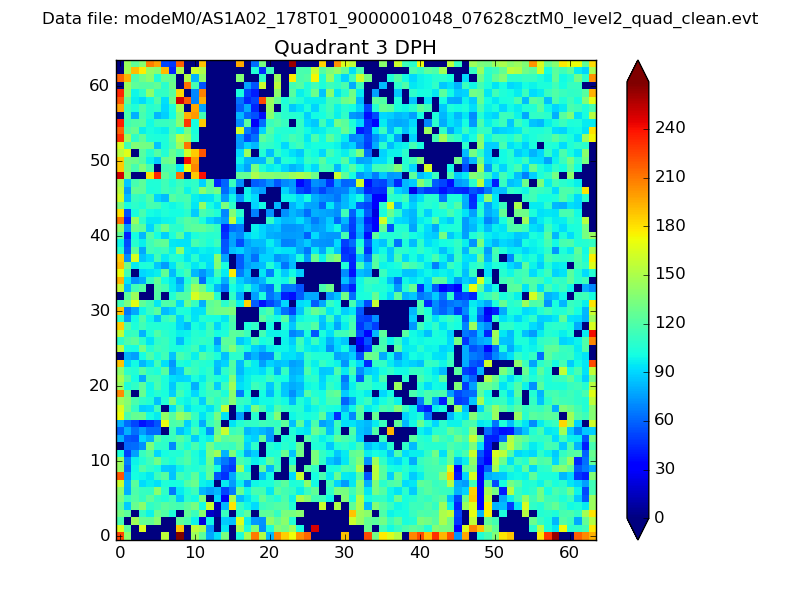 |
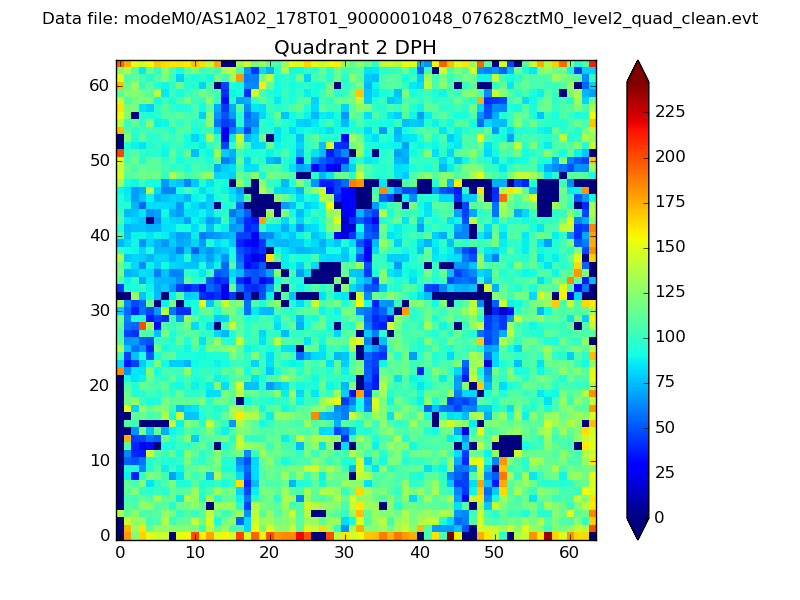 |
Quadrant C |
| Plot type | Count rate plots | Images |
|---|---|---|
| Comparison with Poisson distribution Blue bars denote a histogram of data divided into 1 sec bins. Red curve is a Poisson curve with rate = median count rate of data. |
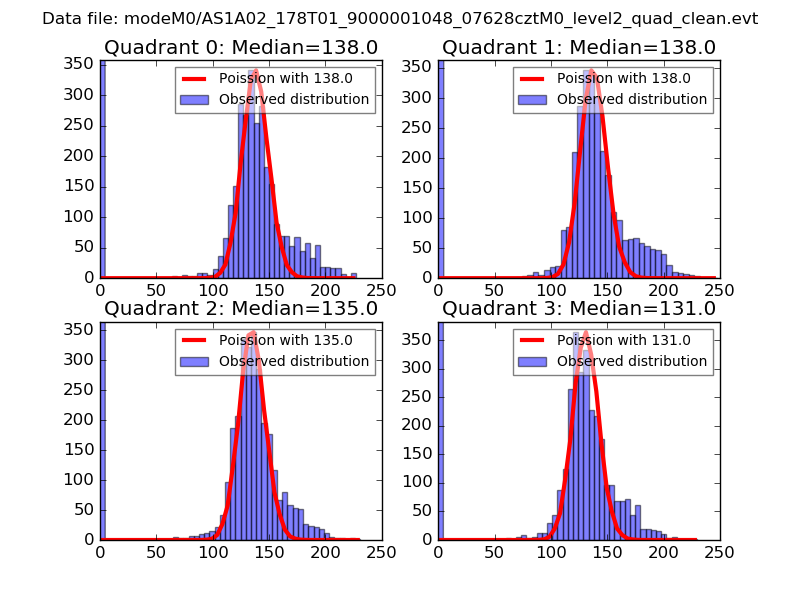 |
 |
| Quadrant-wise count rates Data is divided into 100 sec bins |
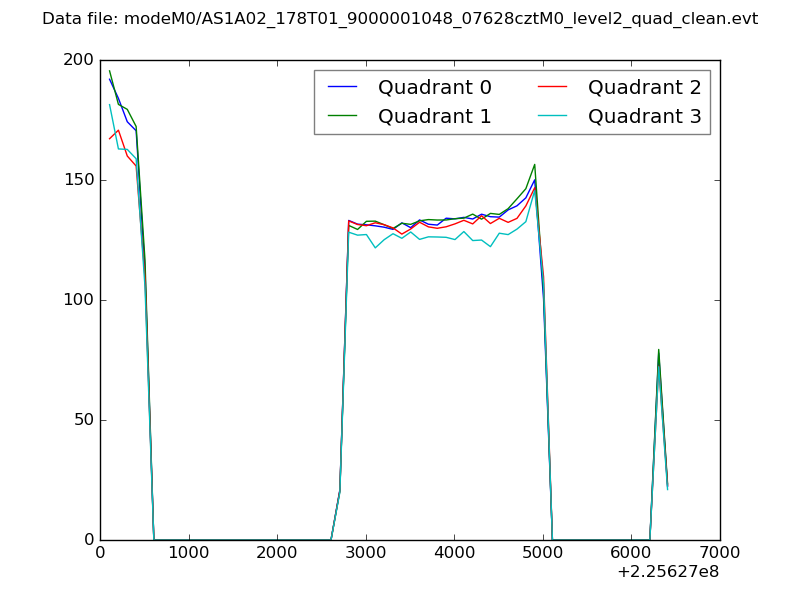 |
|
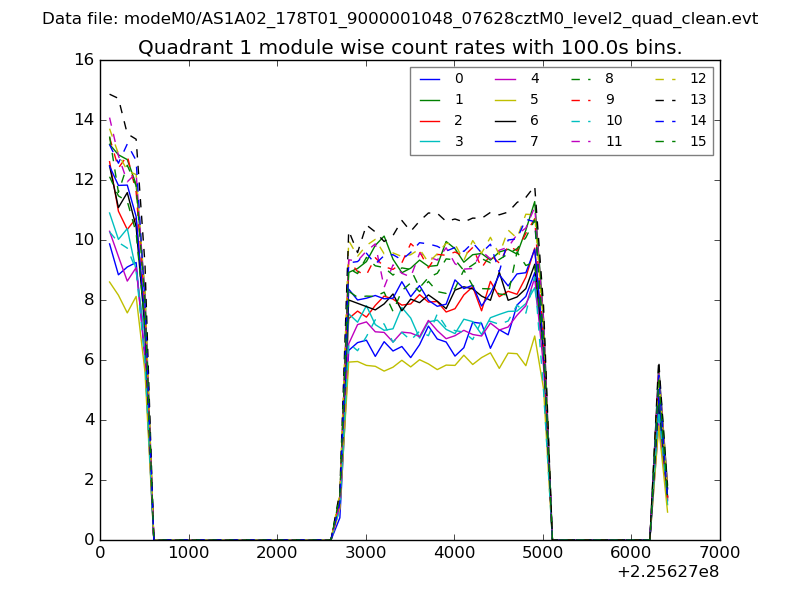
| Module-wise count rates for Quadrant A Data is divided into 100 sec bins |
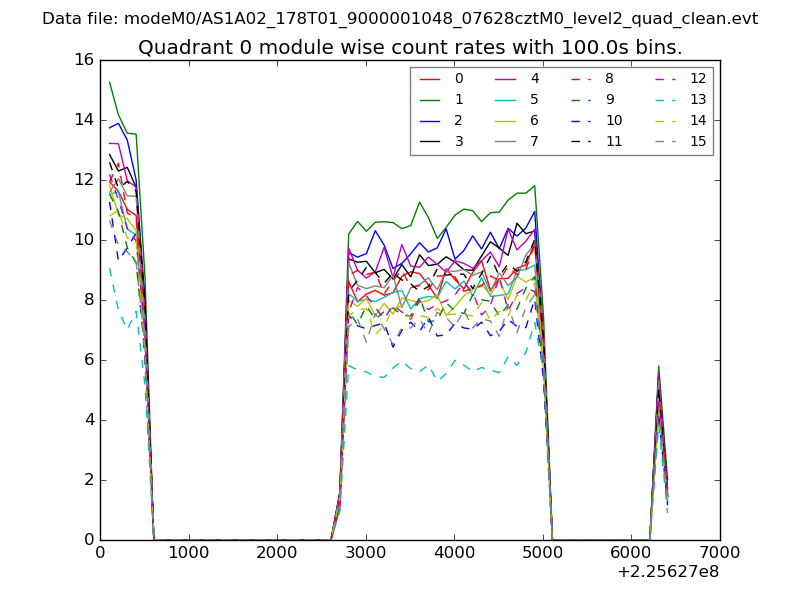 |
 |
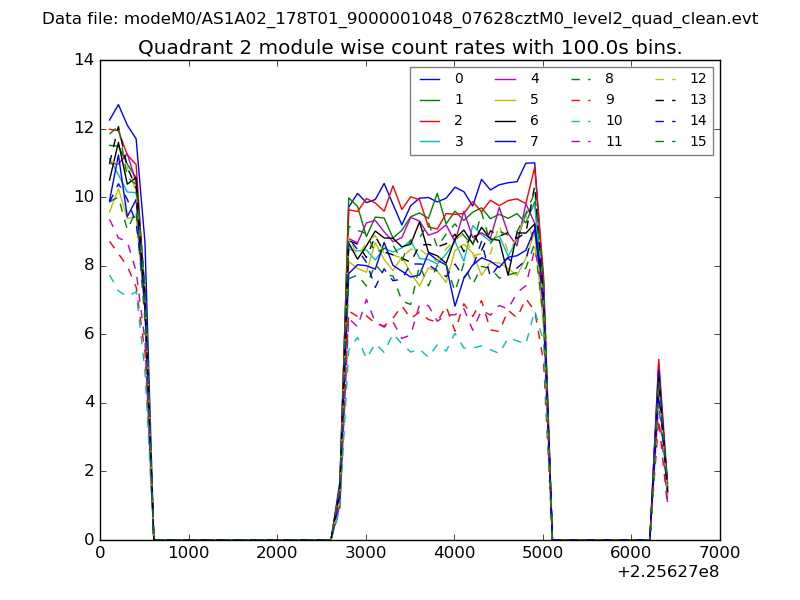
| Module-wise count rates for Quadrant B Data is divided into 100 sec bins |
 |
 |
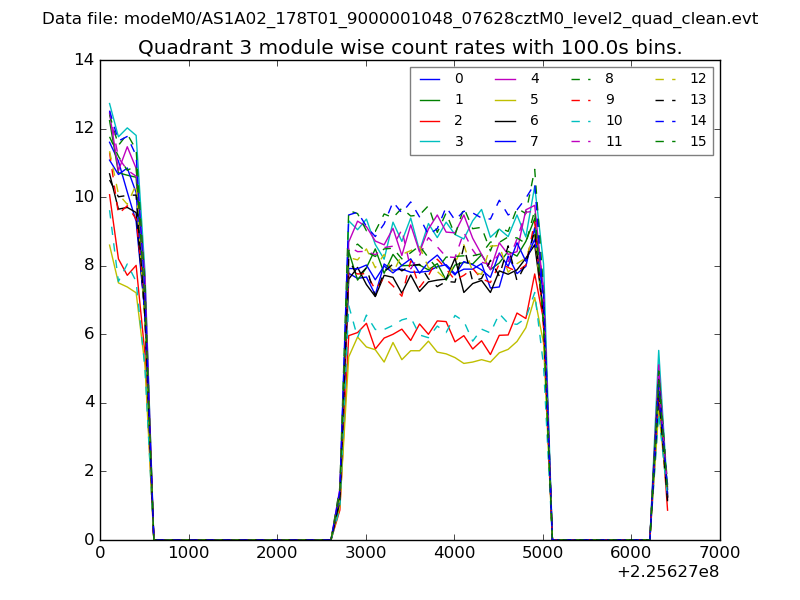
| Module-wise count rates for Quadrant C Data is divided into 100 sec bins |
 |
 |
| Module-wise count rates for Quadrant D Data is divided into 100 sec bins |
 |
 |
| Parameter | Plot |
|---|---|
| CZT HV Monitor | 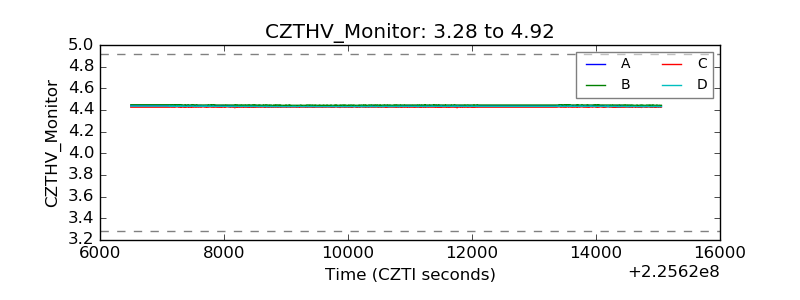 |
| D_VDD | 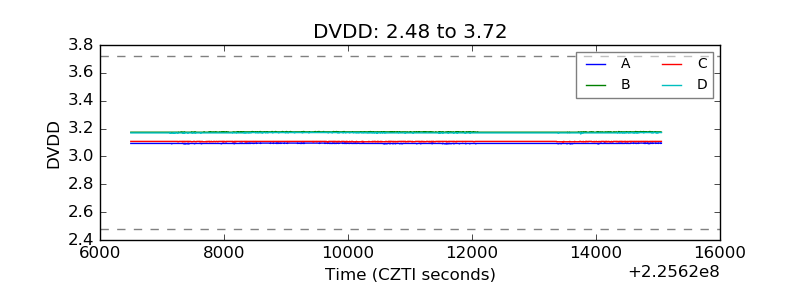 |
| Temperature 1 | 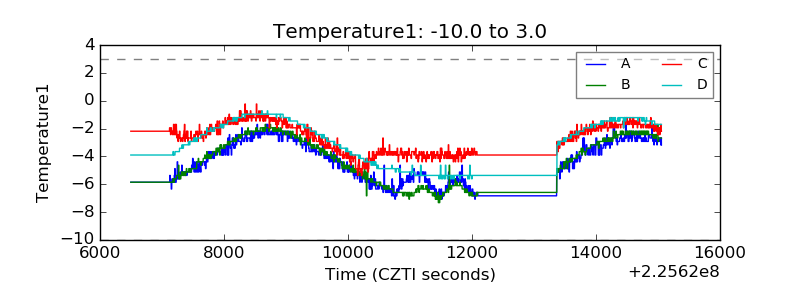 |
| Veto HV Monitor |  |
| Veto LLD | 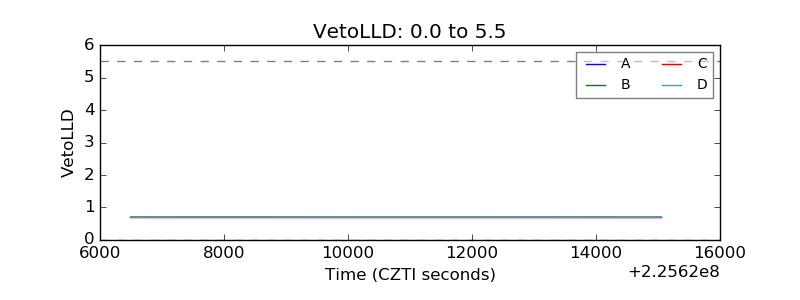 |
| Alpha Counter | 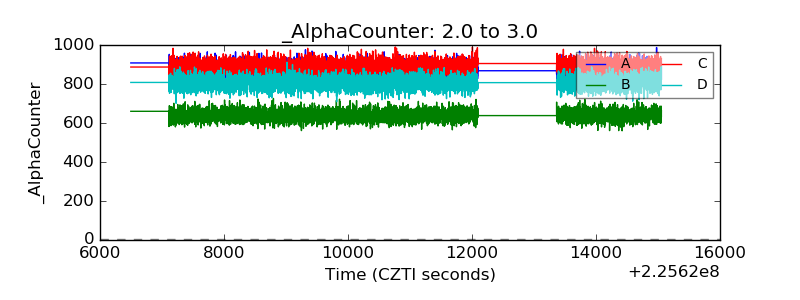 |
| _CPM_Rate | 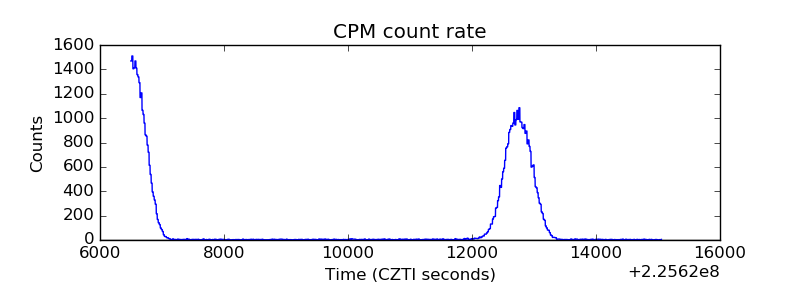 |
| CZT Counter | 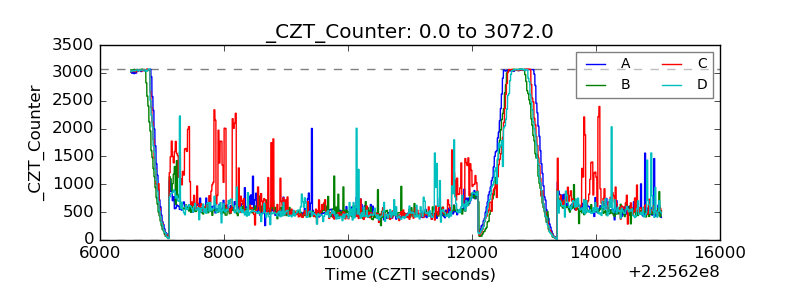 |
| +2.5 Volts monitor |  |
| +5 Volts monitor |  |
| _ROLL_ROT | 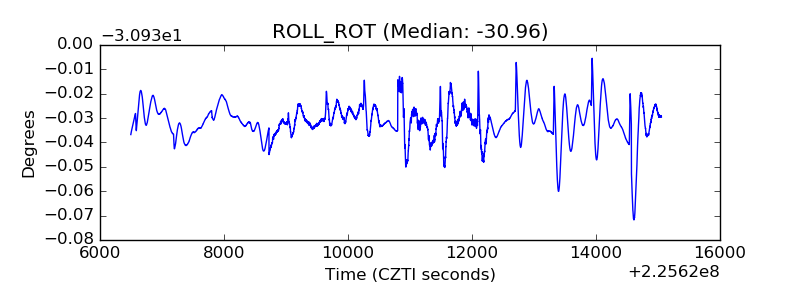 |
| _Roll_DEC | 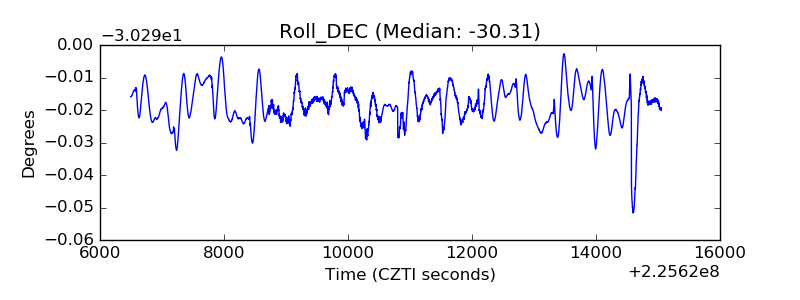 |
| _Roll_RA | 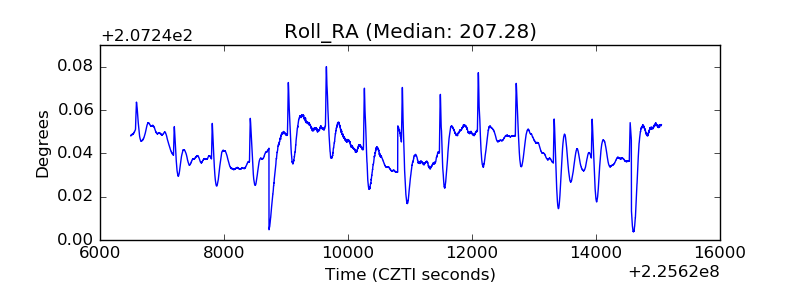 |
| Veto Counter | 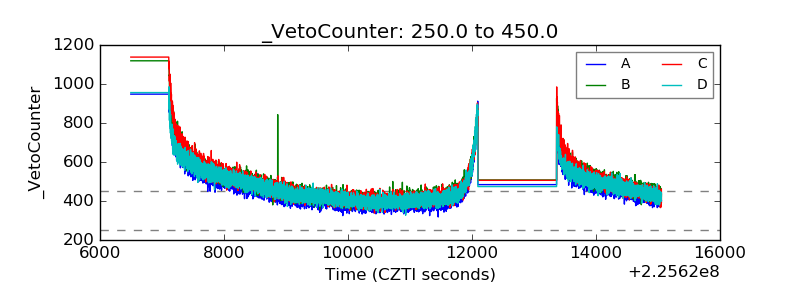 |