| Param | Original file | Final file |
|---|---|---|
| Filename | modeM0/AS1A02_178T01_9000001048_07629cztM0_level2.evt | modeM0/AS1A02_178T01_9000001048_07629cztM0_level2_quad_clean.evt |
| Size (bytes) | 342,624,960 | 50,100,480 |
| Size | 326.8 MB | 47.8 MB |
| Events in quadrant A | 2,460,948 | 302,927 |
| Events in quadrant B | 2,248,742 | 306,674 |
| Events in quadrant C | 2,688,859 | 298,563 |
| Events in quadrant D | 2,667,046 | 287,569 |
| Mode M9 | |||
|---|---|---|---|
| Quadrant | BADHDUFLAG | Total packets | Discarded packets |
| A | 0 | 3 | 0 |
| B | 0 | 3 | 0 |
| C | 0 | 3 | 0 |
| D | 0 | 4 | 0 |
| Mode M0 | |||
|---|---|---|---|
| Quadrant | BADHDUFLAG | Total packets | Discarded packets |
| A | 0 | 10186 | 1 |
| B | 0 | 9499 | 1 |
| C | 0 | 11053 | 1 |
| D | 0 | 10994 | 1 |
| Mode SS | |||
|---|---|---|---|
| Quadrant | BADHDUFLAG | Total packets | Discarded packets |
| A | 0 | 92 | 0 |
| B | 0 | 92 | 0 |
| C | 0 | 92 | 0 |
| D | 0 | 92 | 0 |
| Quadrant | Total seconds | Saturated seconds | Saturation percentage |
|---|---|---|---|
| A | 4562 | 13 | 0.284963% |
| B | 4562 | 12 | 0.263043% |
| C | 4562 | 80 | 1.753617% |
| D | 4562 | 60 | 1.315213% |
Noise dominated data is calculated using 1-second bins in cleaned event files. If a bin has >2000 counts, and if more than 50% of those come from <1% of pixels, then it is considered to be noise-dominated and hence unusable.
| Quadrant | # 1 sec bins | Bins with >0 counts | Bins with >2000 counts | High rate bins dominated by noise | Noise dominated (total time) | Noise dominated (detector-on time) | Marked lightcurve |
|---|---|---|---|---|---|---|---|
| A | 4562 | 4562 | 7 | 7 | 0.15% | 0.15% |  |
| B | 4562 | 4562 | 3 | 3 | 0.07% | 0.07% | 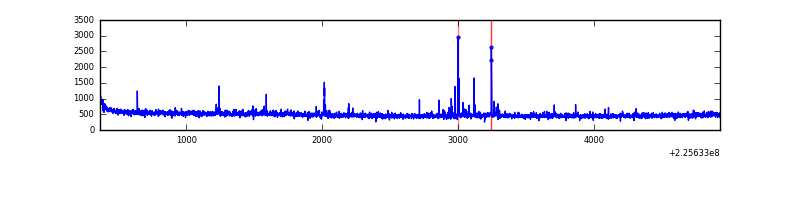 |
| C | 4562 | 4562 | 50 | 50 | 1.10% | 1.10% | 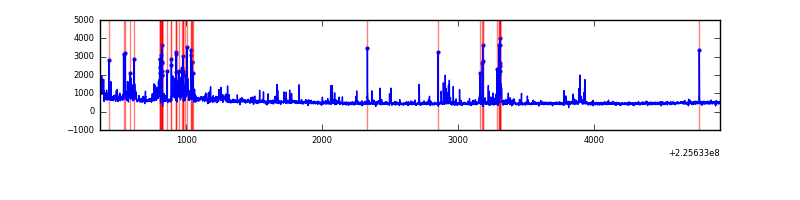 |
| D | 4562 | 4562 | 44 | 44 | 0.96% | 0.96% | 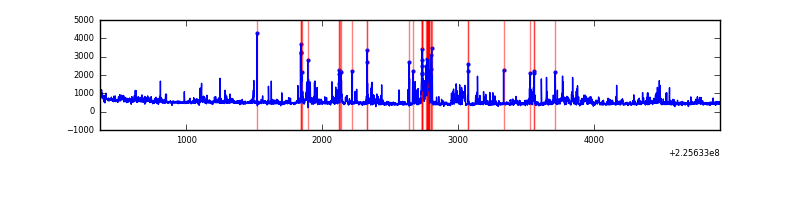 |
Top three noisy pixels from each quadrant. If the there are fewer than three noisy pixels in the level2.evt file, extra rows are filled as -1
| Pixel properties | Quadrant properties | ||||||
|---|---|---|---|---|---|---|---|
| Quadrant | DetID | PixID | Counts | Sigma | Mean | Median | Sigma |
| A | 13 | 251 | 309564 | 2731.03 | 558 | 547 | 113.2 |
| A | 0 | 226 | 5406 | 42.94 | 558 | 547 | 113.2 |
| A | 12 | 194 | 4879 | 38.29 | 558 | 547 | 113.2 |
| B | 0 | 214 | 35052 | 326.15 | 560 | 547 | 105.8 |
| B | 0 | 229 | 14579 | 132.63 | 560 | 547 | 105.8 |
| B | 12 | 111 | 10603 | 95.05 | 560 | 547 | 105.8 |
| C | 4 | 254 | 383568 | 3068.4 | 537 | 541 | 124.8 |
| C | 9 | 68 | 169757 | 1355.57 | 537 | 541 | 124.8 |
| C | 1 | 16 | 33093 | 260.77 | 537 | 541 | 124.8 |
| D | 2 | 152 | 285549 | 2148.6 | 538 | 521 | 132.7 |
| D | 14 | 34 | 142954 | 1073.69 | 538 | 521 | 132.7 |
| D | 2 | 14 | 69949 | 523.36 | 538 | 521 | 132.7 |
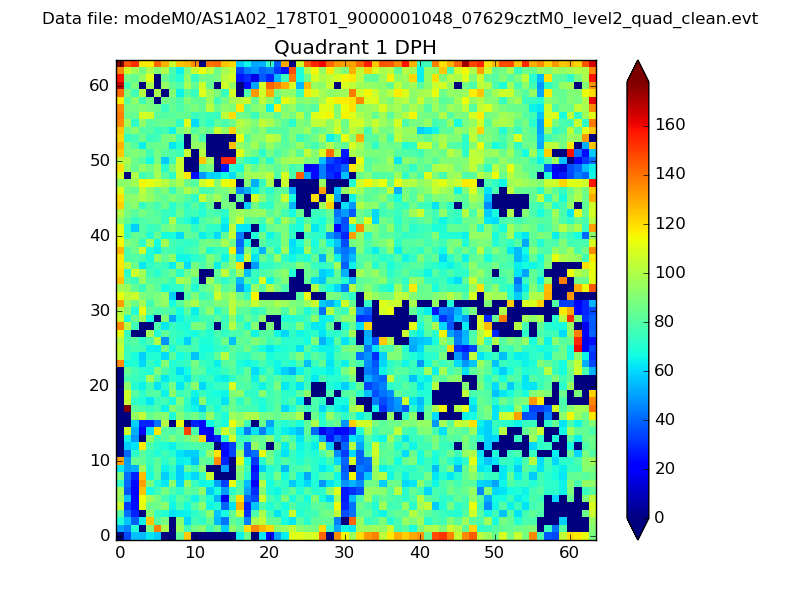
Histogram calculated using DETX and DETY for each event in the final _common_clean file
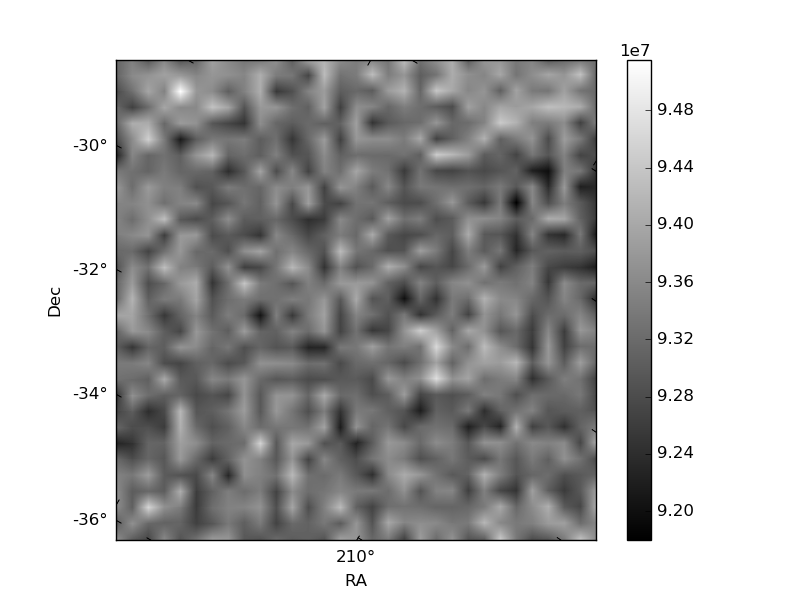
| Quadrant A | 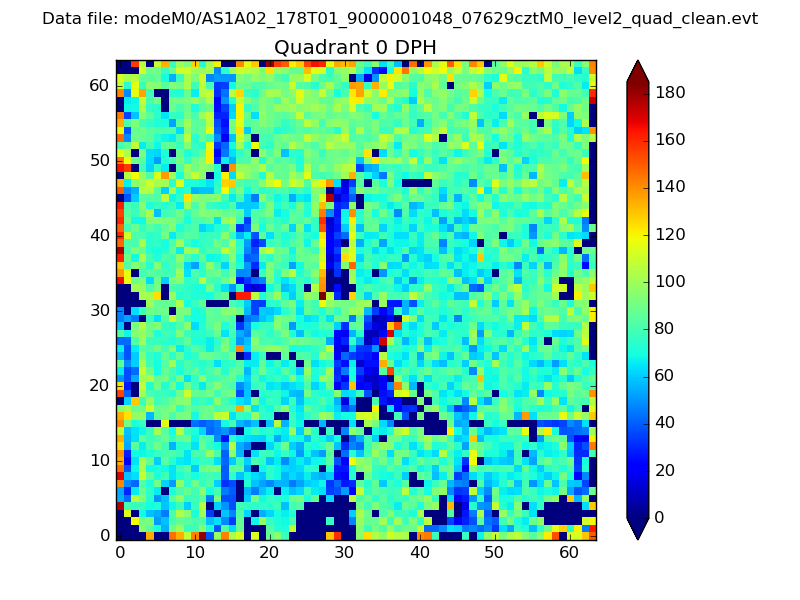 |
 |
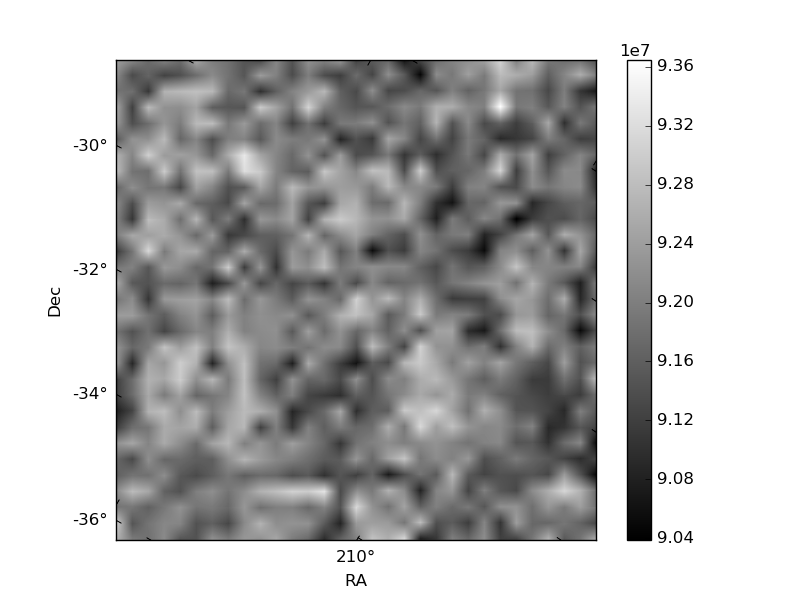
Quadrant B |
|---|---|---|---|
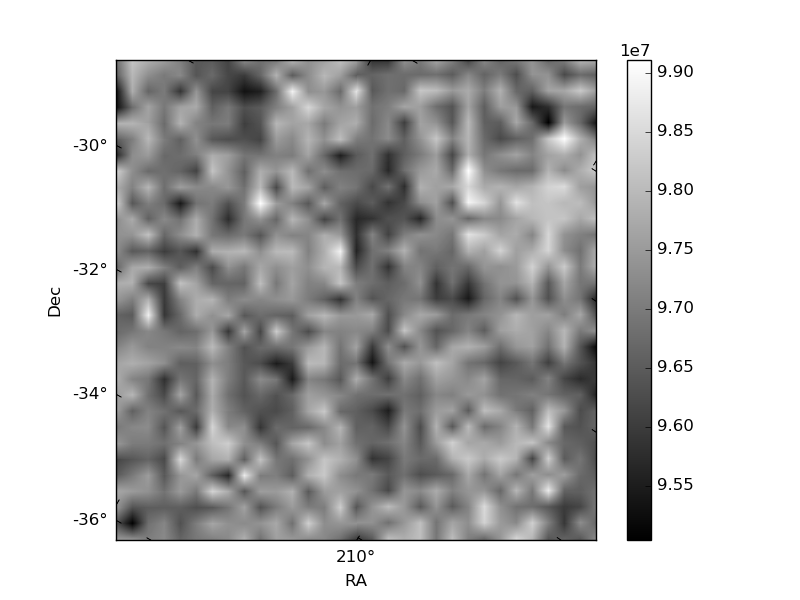
| Quadrant D | 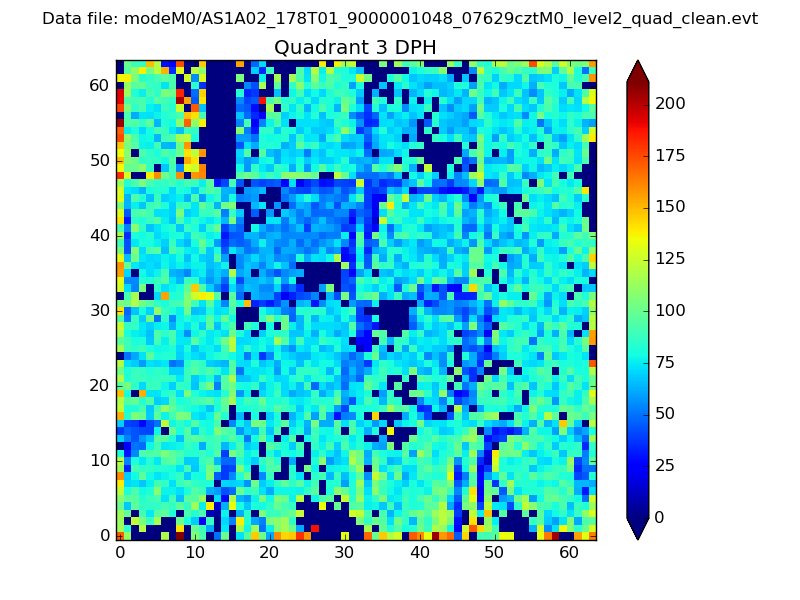 |
 |
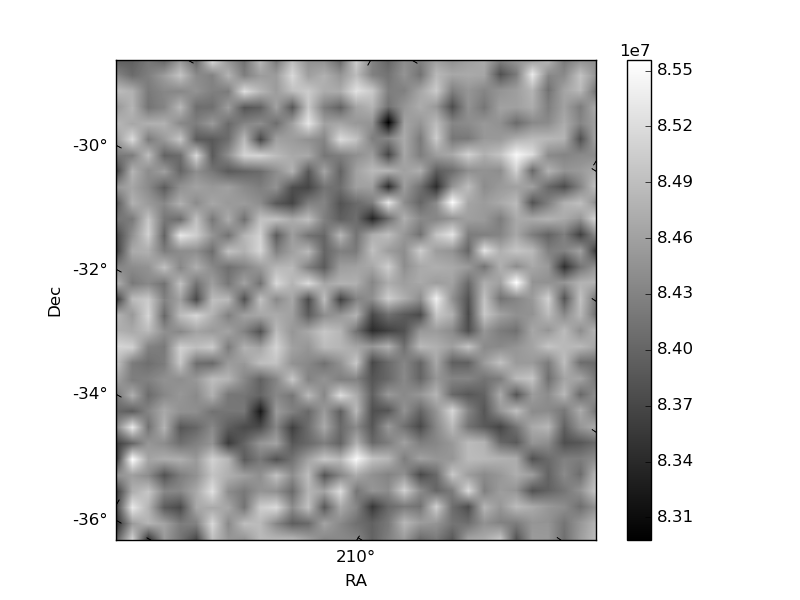
Quadrant C |
| Plot type | Count rate plots | Images |
|---|---|---|
| Comparison with Poisson distribution Blue bars denote a histogram of data divided into 1 sec bins. Red curve is a Poisson curve with rate = median count rate of data. |
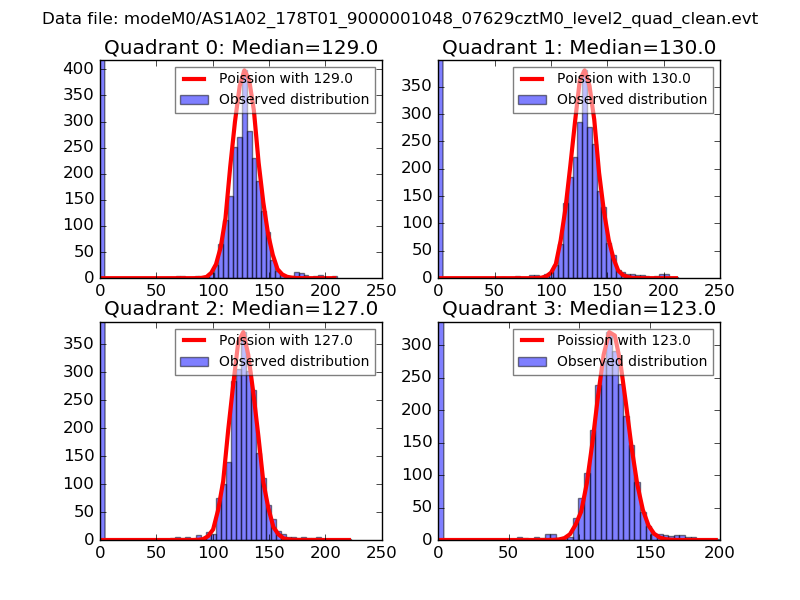 |
 |
| Quadrant-wise count rates Data is divided into 100 sec bins |
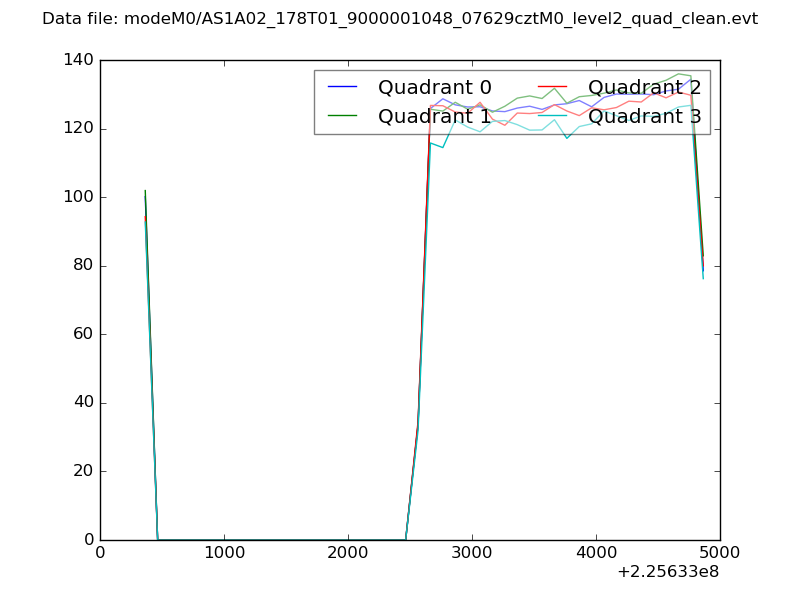 |
|
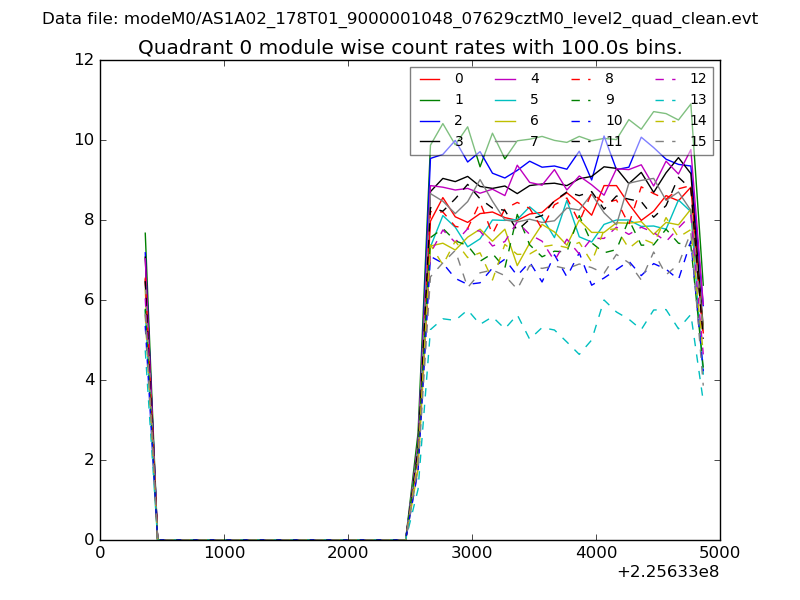
| Module-wise count rates for Quadrant A Data is divided into 100 sec bins |
 |
 |
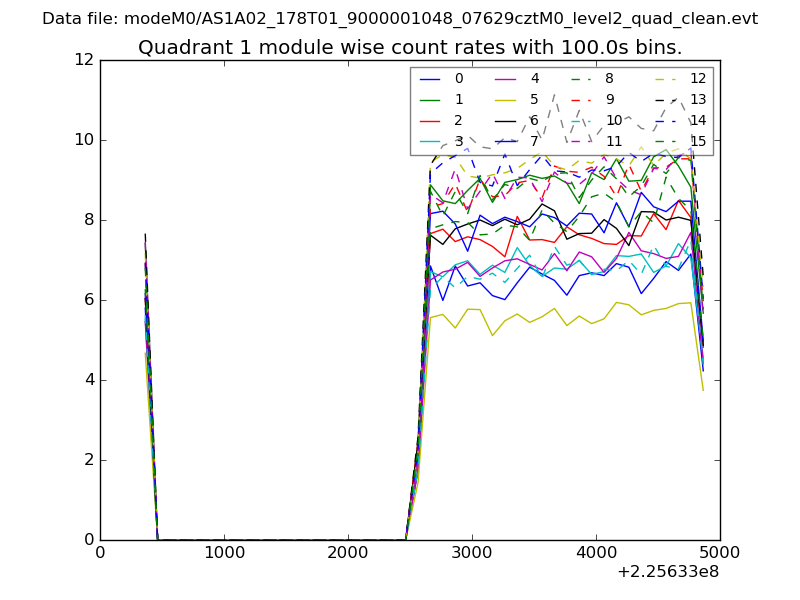
| Module-wise count rates for Quadrant B Data is divided into 100 sec bins |
 |
 |
| Module-wise count rates for Quadrant C Data is divided into 100 sec bins |
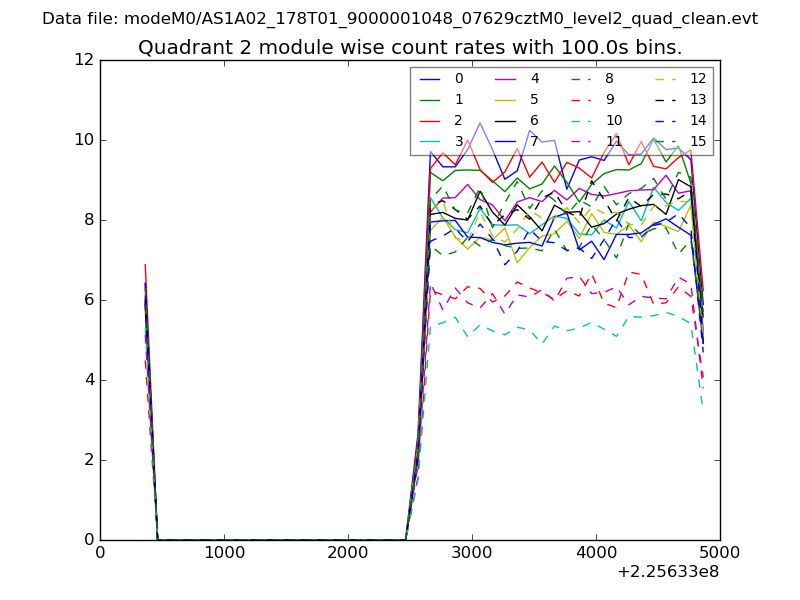 |
 |
| Module-wise count rates for Quadrant D Data is divided into 100 sec bins |
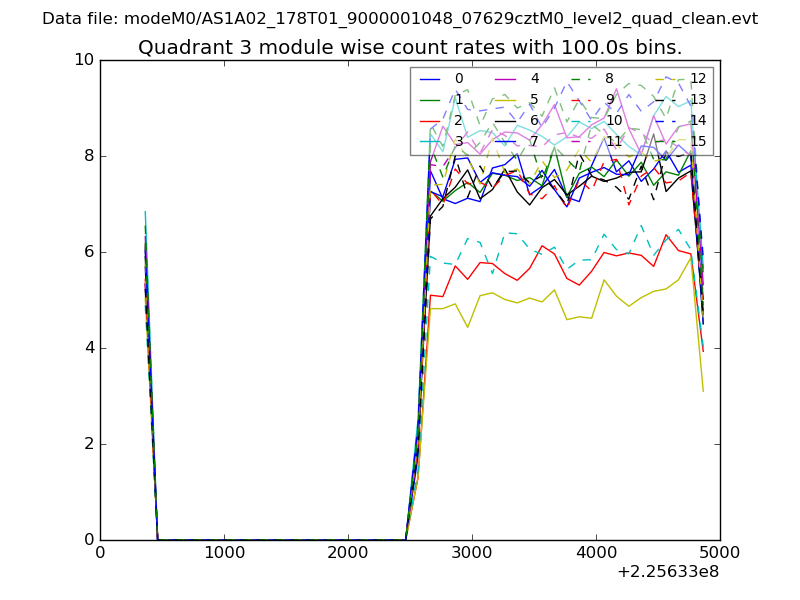 |
 |
| Parameter | Plot |
|---|---|
| CZT HV Monitor | 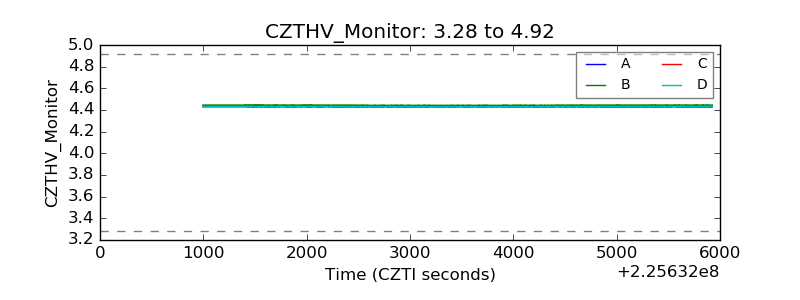 |
| D_VDD | 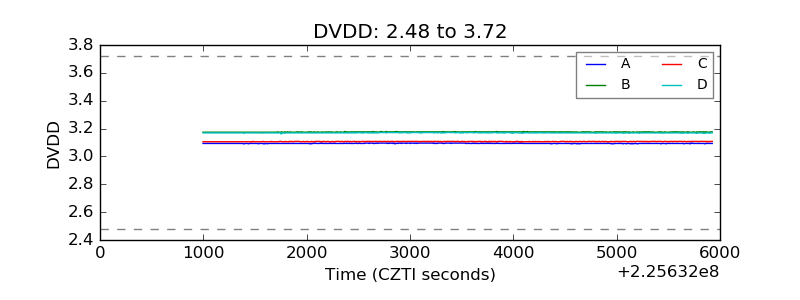 |
| Temperature 1 | 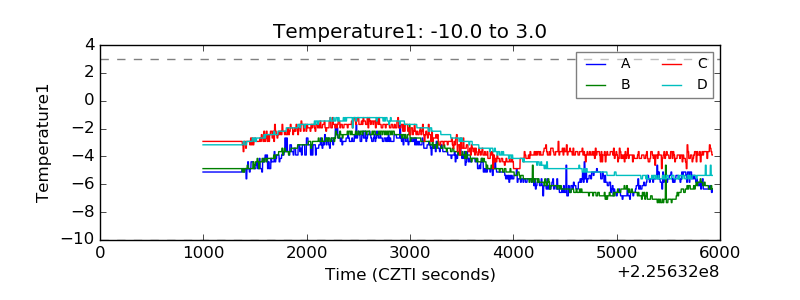 |
| Veto HV Monitor | 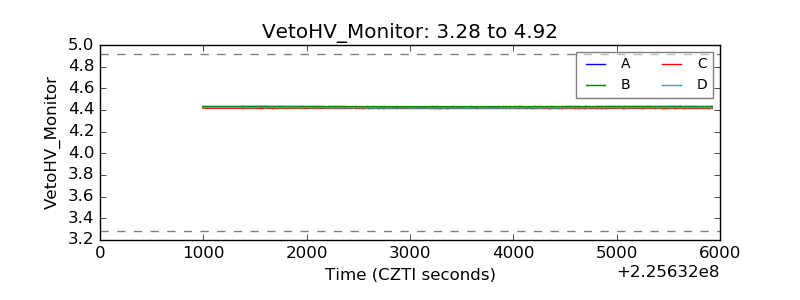 |
| Veto LLD | 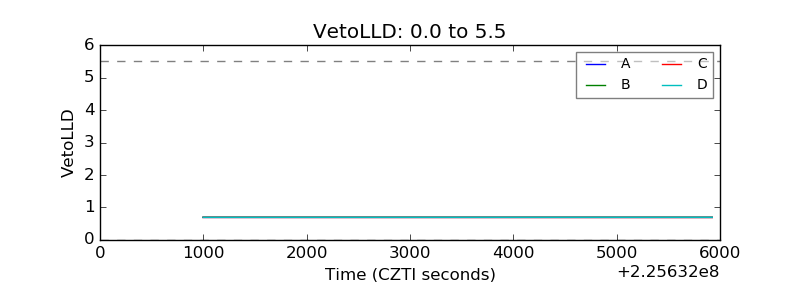 |
| Alpha Counter | 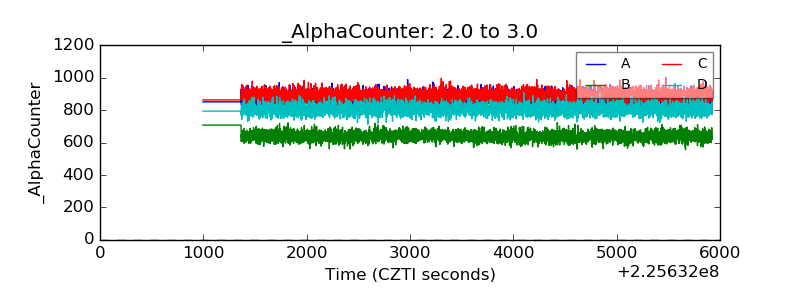 |
| _CPM_Rate | 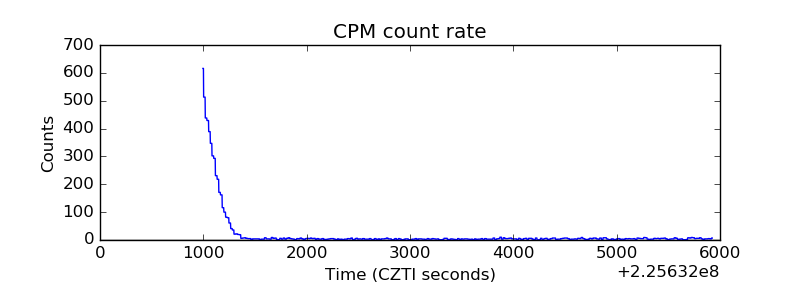 |
| CZT Counter |  |
| +2.5 Volts monitor | 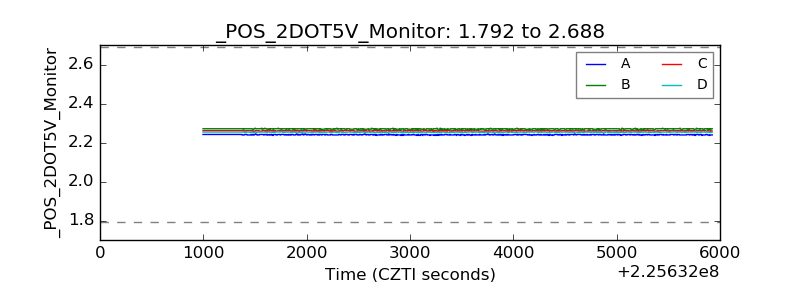 |
| +5 Volts monitor |  |
| _ROLL_ROT | 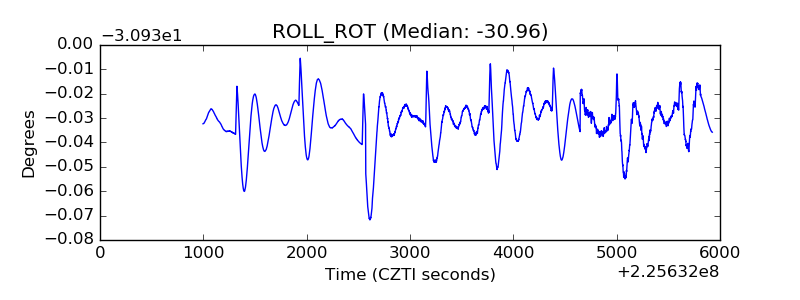 |
| _Roll_DEC | 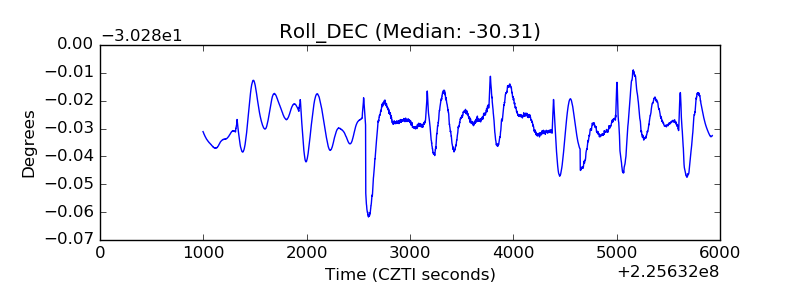 |
| _Roll_RA | 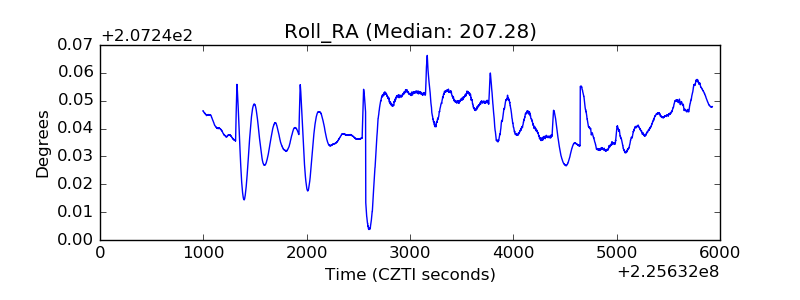 |
| Veto Counter | 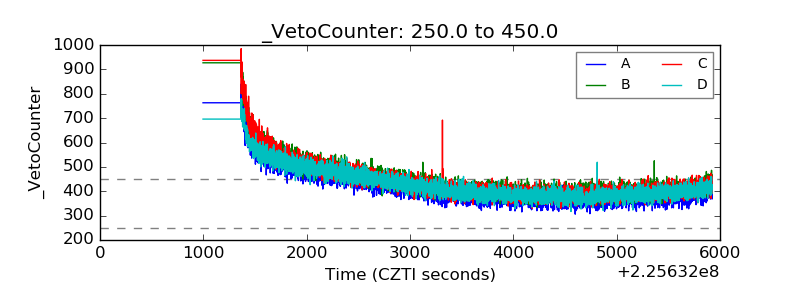 |