| Param | Original file | Final file |
|---|---|---|
| Filename | modeM0/AS1G06_016T01_9000001052cztM0_level2.fits | modeM0/AS1G06_016T01_9000001052cztM0_level2_quad_clean.evt |
| Size (bytes) | 440,256,960 | 379,117,440 |
| Size | 419.9 MB | 361.6 MB |
| Events in quadrant A | 2,808,403 | 2,251,343 |
| Events in quadrant B | 2,706,046 | 2,265,781 |
| Events in quadrant C | 2,090,848 | 1,628,965 |
| Events in quadrant D | 2,392,272 | 2,005,673 |
| Mode M0 | |||
|---|---|---|---|
| Quadrant | BADHDUFLAG | Total packets | Discarded packets |
| A | 0 | 103983 | 0 |
| B | 0 | 101978 | 0 |
| C | 0 | 211806 | 0 |
| D | 0 | 112431 | 0 |
| Mode M9 | |||
|---|---|---|---|
| Quadrant | BADHDUFLAG | Total packets | Discarded packets |
| A | 0 | 68 | 0 |
| B | 0 | 67 | 0 |
| C | 0 | 67 | 0 |
| D | 0 | 67 | 0 |
| Mode SS | |||
|---|---|---|---|
| Quadrant | BADHDUFLAG | Total packets | Discarded packets |
| A | 0 | 990 | 0 |
| B | 0 | 990 | 0 |
| C | 0 | 993 | 0 |
| D | 0 | 997 | 0 |
| Quadrant | Total seconds | Saturated seconds | Saturation percentage |
|---|---|---|---|
| A | 48773 | 670 | 1.373711% |
| B | 48804 | 584 | 1.196623% |
| C | 47657 | 11894 | 24.957509% |
| D | 48664 | 851 | 1.748726% |
Noise dominated data is calculated using 1-second bins in cleaned event files. If a bin has >2000 counts, and if more than 50% of those come from <1% of pixels, then it is considered to be noise-dominated and hence unusable.
| Quadrant | # 1 sec bins | Bins with >0 counts | Bins with >2000 counts | High rate bins dominated by noise | Noise dominated (total time) | Noise dominated (detector-on time) | Marked lightcurve |
|---|---|---|---|---|---|---|---|
| A | 57688 | 49912 | 0 | 0 | 0.00% | 0.00% | 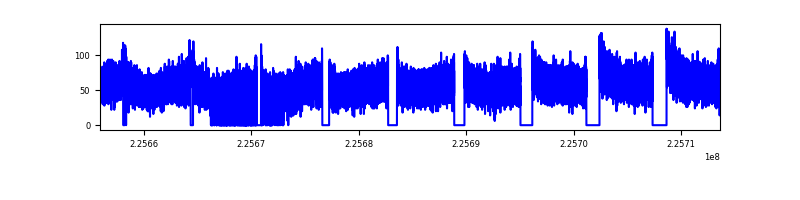 |
| B | 57688 | 49950 | 0 | 0 | 0.00% | 0.00% | 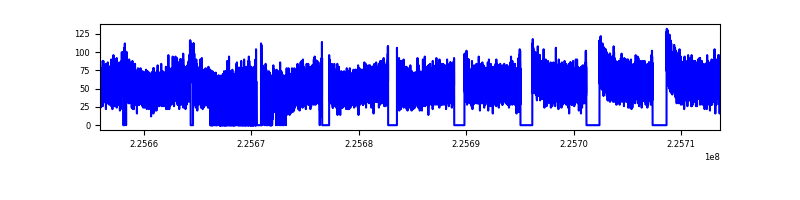 |
| C | 57688 | 48194 | 0 | 0 | 0.00% | 0.00% | 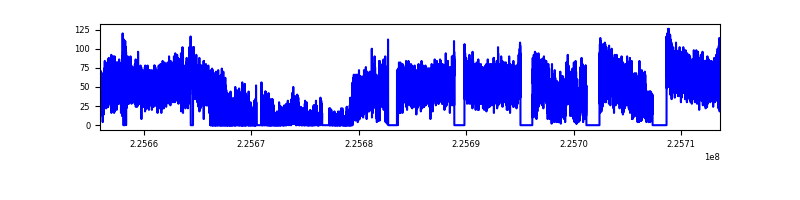 |
| D | 57688 | 49787 | 0 | 0 | 0.00% | 0.00% | 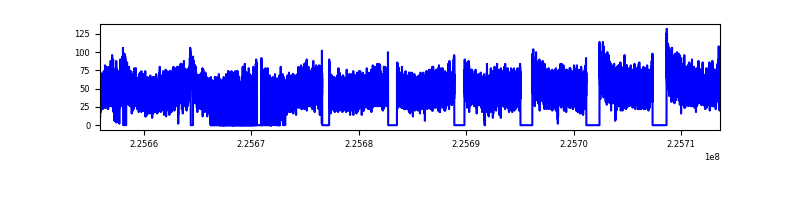 |
Top three noisy pixels from each quadrant. If the there are fewer than three noisy pixels in the level2.evt file, extra rows are filled as -1
| Pixel properties | Quadrant properties | ||||||
|---|---|---|---|---|---|---|---|
| Quadrant | DetID | PixID | Counts | Sigma | Mean | Median | Sigma |
| A | 0 | 29 | 2714 | 11.0 | 730 | 682 | 184.7 |
| A | 7 | 110 | 2265 | 8.57 | 730 | 682 | 184.7 |
| A | 0 | 30 | 2113 | 7.75 | 730 | 682 | 184.7 |
| B | 2 | 9 | 2363 | 11.66 | 713 | 676 | 144.7 |
| B | 3 | 17 | 1871 | 8.26 | 713 | 676 | 144.7 |
| B | 12 | 226 | 1820 | 7.91 | 713 | 676 | 144.7 |
| C | 1 | 81 | 1471 | 6.71 | 553 | 514 | 142.5 |
| C | 1 | 80 | 1462 | 6.65 | 553 | 514 | 142.5 |
| C | 12 | 241 | 1431 | 6.43 | 553 | 514 | 142.5 |
| D | 6 | 231 | 1746 | 6.2 | 682 | 618 | 181.9 |
| D | 7 | 5 | 1717 | 6.04 | 682 | 618 | 181.9 |
| D | 6 | 67 | 1706 | 5.98 | 682 | 618 | 181.9 |
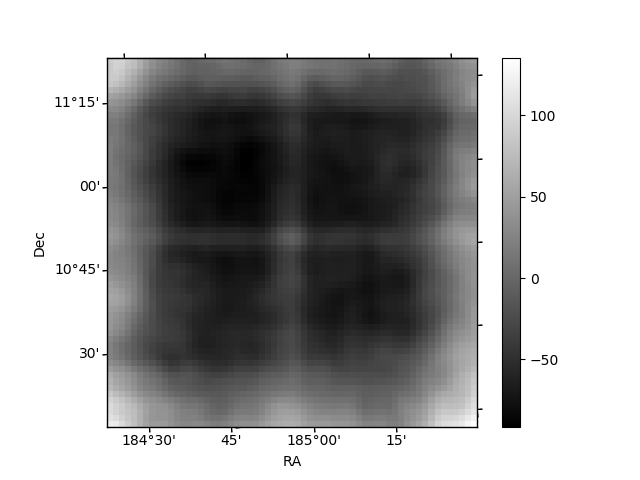
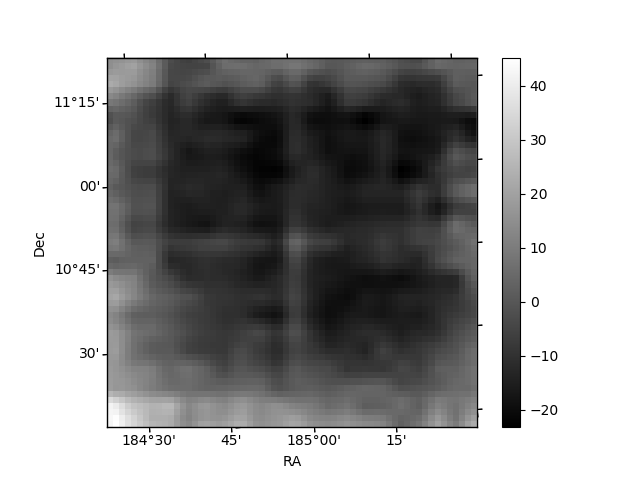
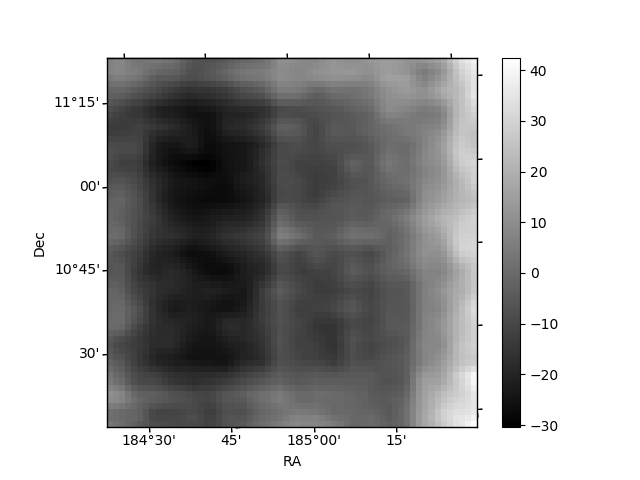
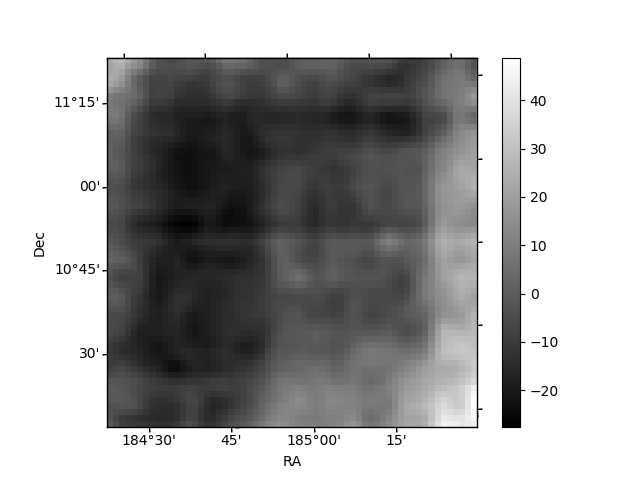
Histogram calculated using DETX and DETY for each event in the final _common_clean file
| Quadrant A | 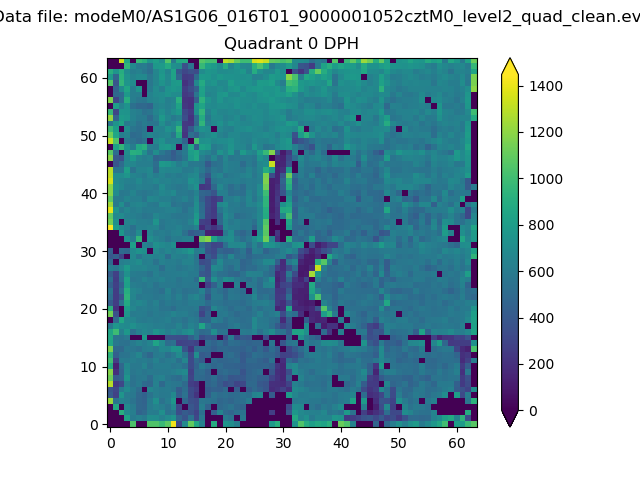 |
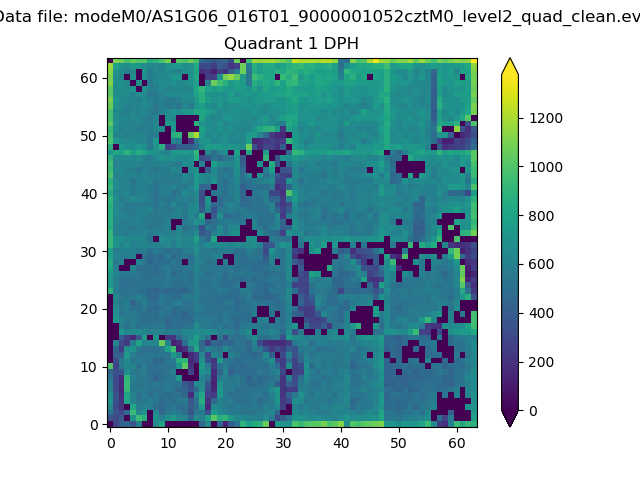 |
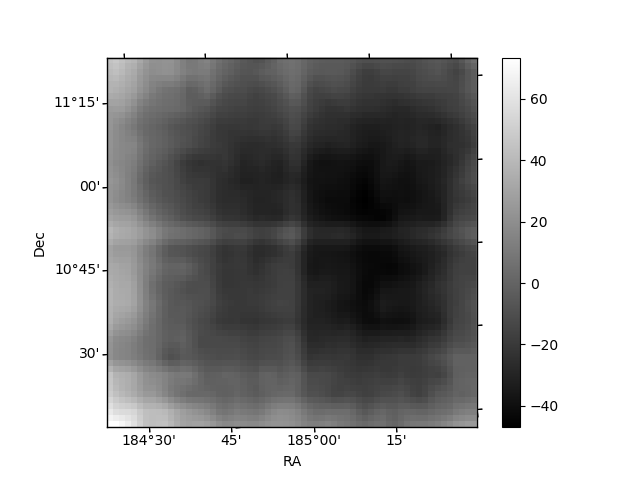
Quadrant B |
|---|---|---|---|
| Quadrant D | 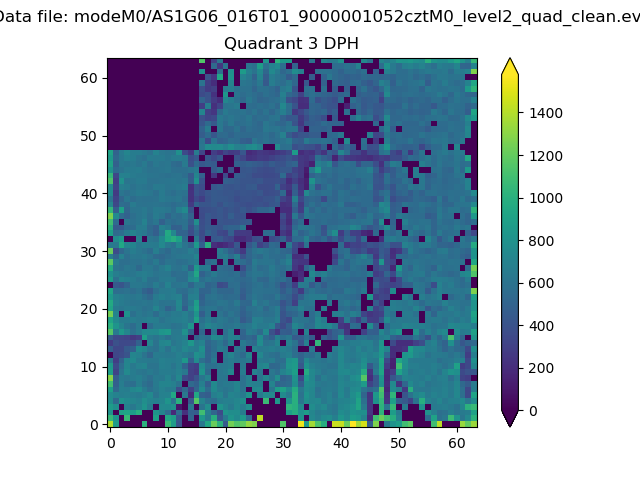 |
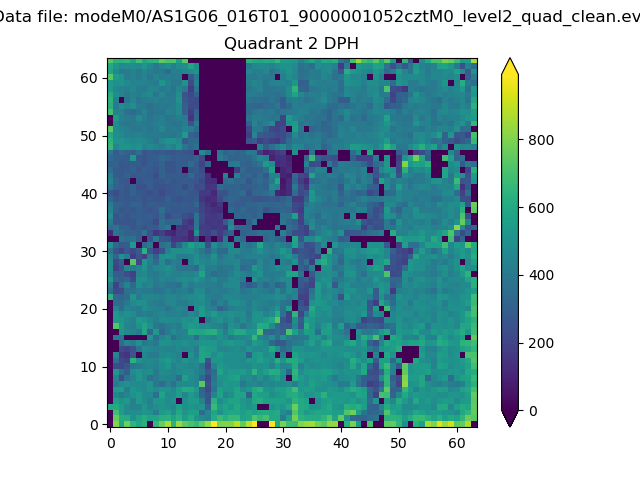 |
Quadrant C |
| Plot type | Count rate plots | Images |
|---|---|---|
| Comparison with Poisson distribution Blue bars denote a histogram of data divided into 1 sec bins. Red curve is a Poisson curve with rate = median count rate of data. |
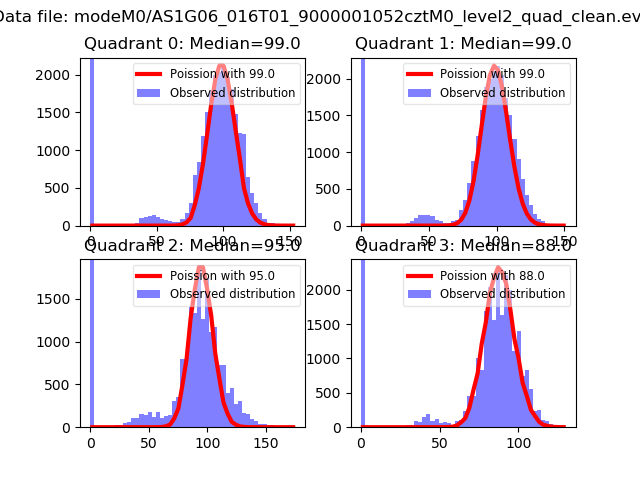 |
 |
| Quadrant-wise count rates Data is divided into 100 sec bins |
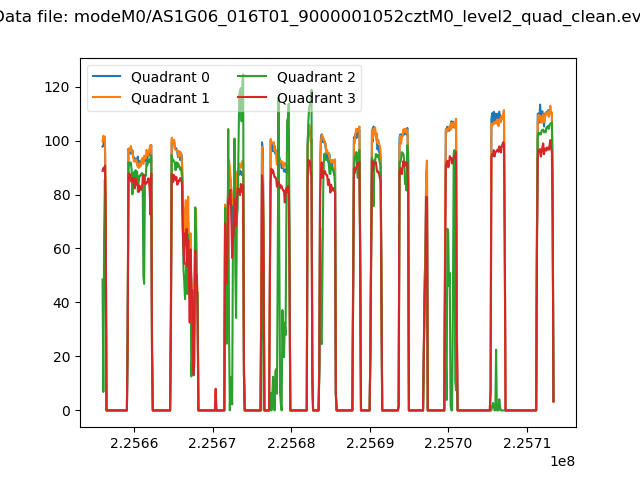 |
|
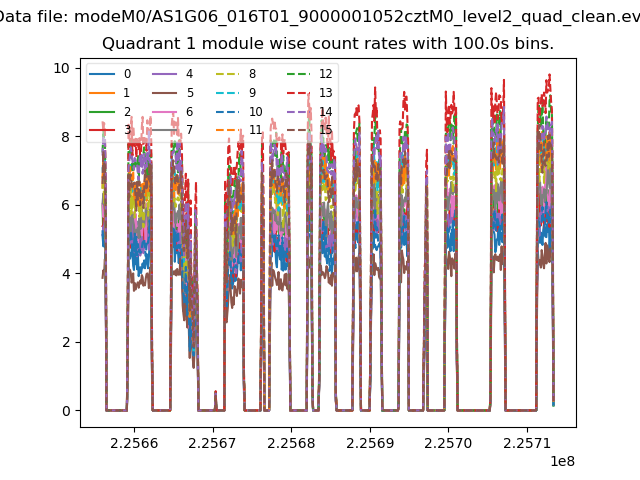
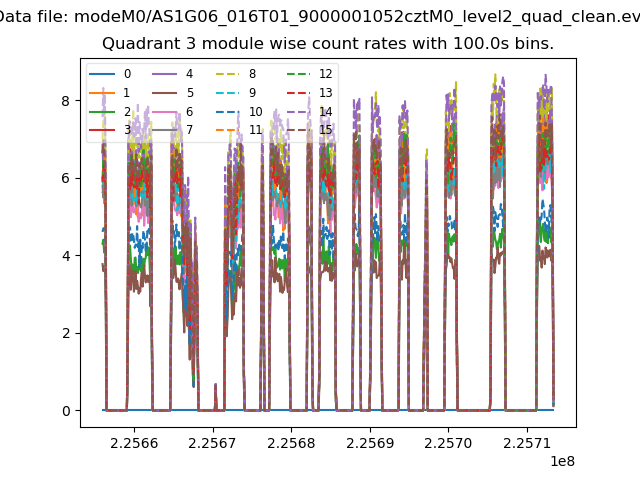
| Module-wise count rates for Quadrant A Data is divided into 100 sec bins |
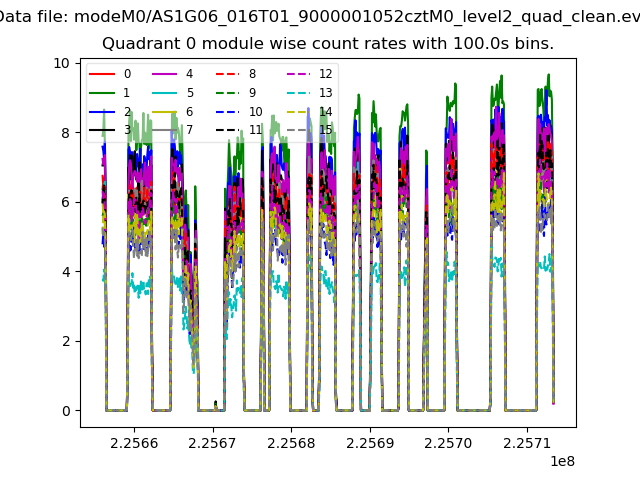 |
 |
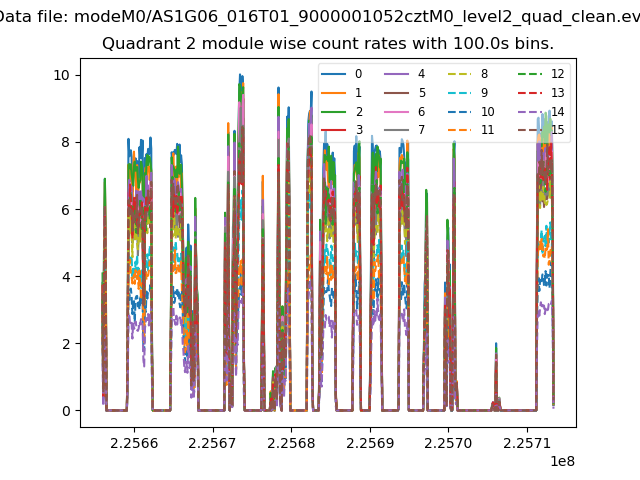
| Module-wise count rates for Quadrant B Data is divided into 100 sec bins |
 |
 |
| Module-wise count rates for Quadrant C Data is divided into 100 sec bins |
 |
 |
| Module-wise count rates for Quadrant D Data is divided into 100 sec bins |
 |
 |
| Parameter | Plot |
|---|---|
| CZT HV Monitor | 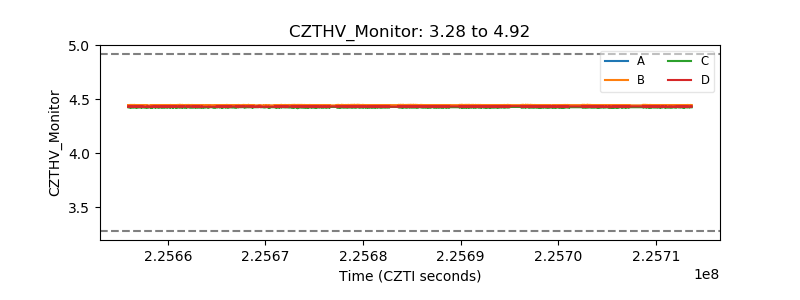 |
| D_VDD | 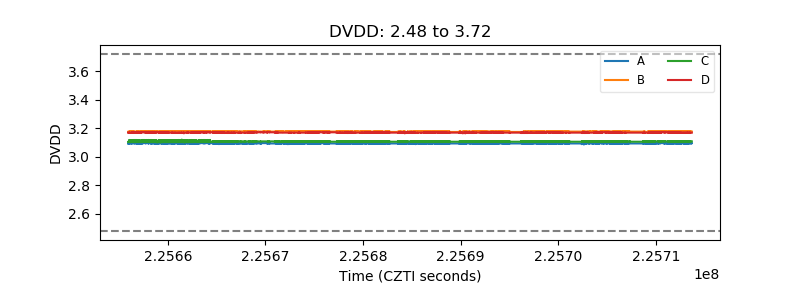 |
| Temperature 1 | 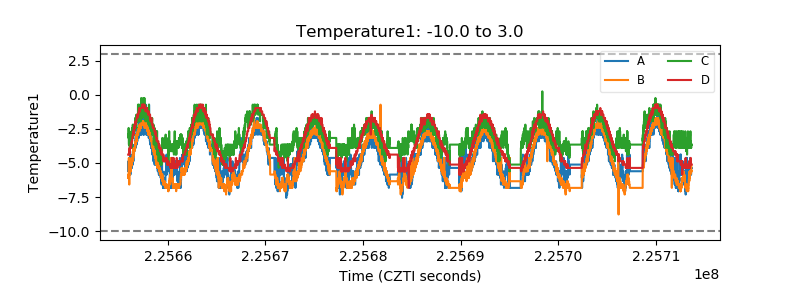 |
| Veto HV Monitor | 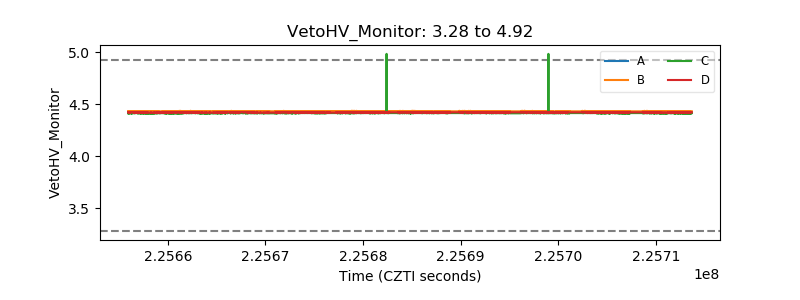 |
| Veto LLD | 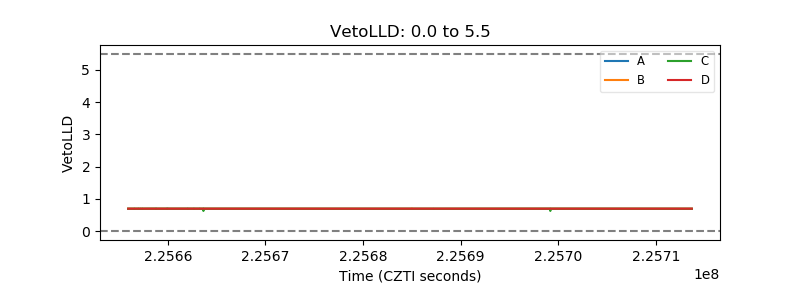 |
| Alpha Counter | 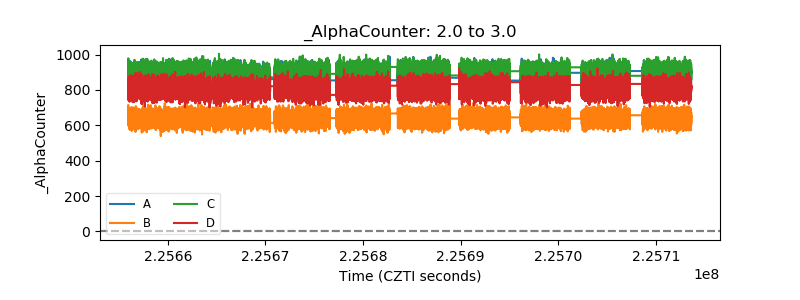 |
| _CPM_Rate | 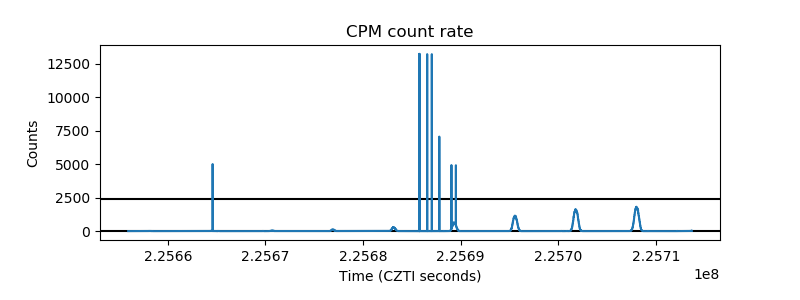 |
| CZT Counter | 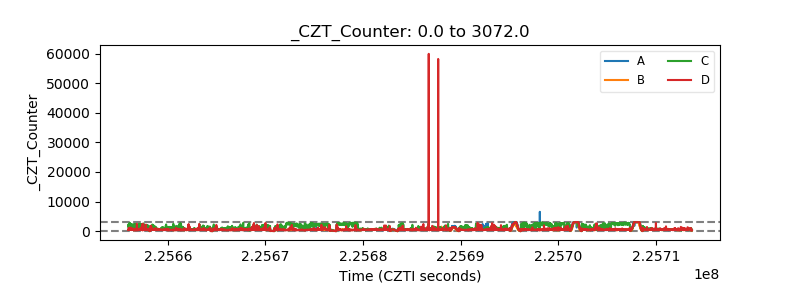 |
| +2.5 Volts monitor | 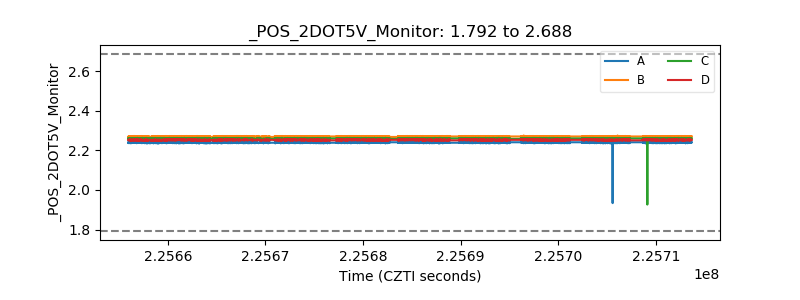 |
| +5 Volts monitor | 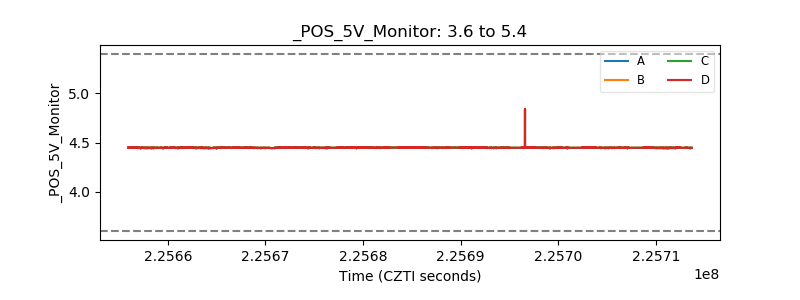 |
| _ROLL_ROT | 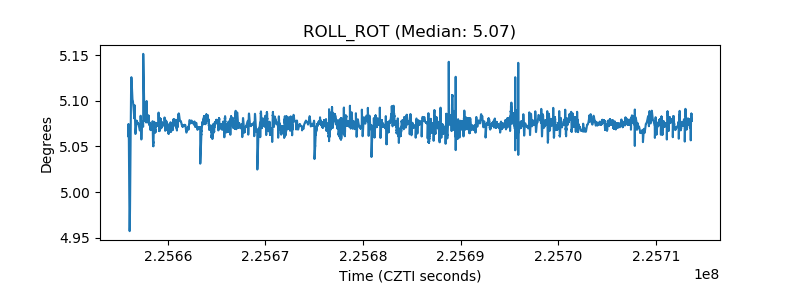 |
| _Roll_DEC | 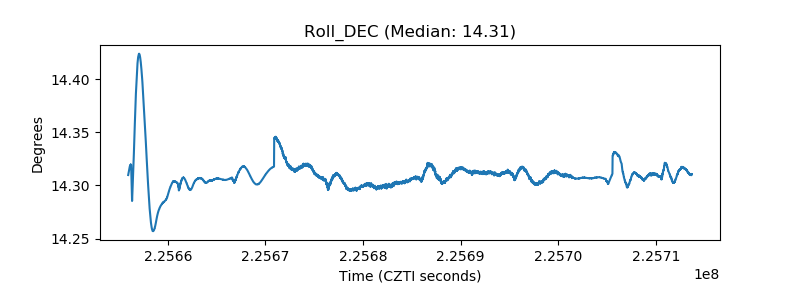 |
| _Roll_RA | 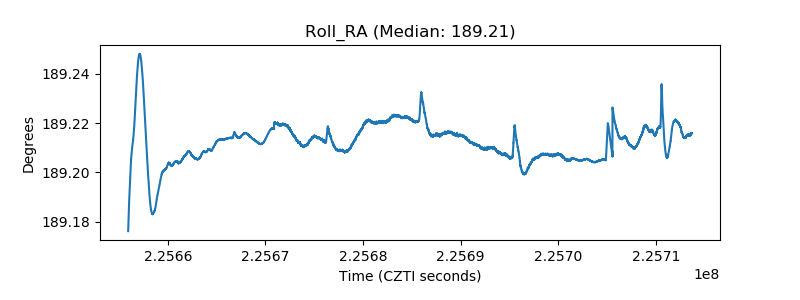 |
| Veto Counter | 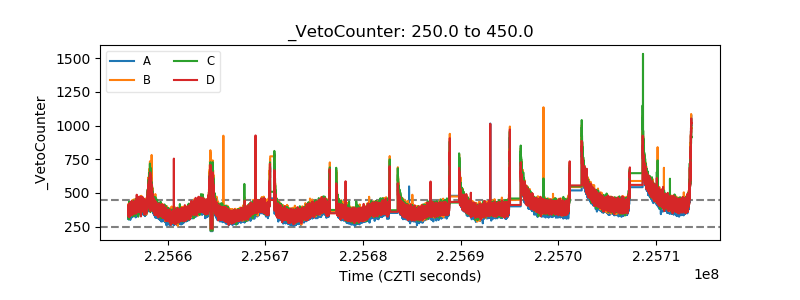 |