| Param | Original file | Final file |
|---|---|---|
| Filename | modeM0/AS1G06_016T01_9000001052_07632cztM0_level2.evt | modeM0/AS1G06_016T01_9000001052_07632cztM0_level2_quad_clean.evt |
| Size (bytes) | 385,966,080 | 33,094,080 |
| Size | 368.1 MB | 31.6 MB |
| Events in quadrant A | 1,922,645 | 187,293 |
| Events in quadrant B | 1,974,861 | 190,971 |
| Events in quadrant C | 5,207,247 | 176,536 |
| Events in quadrant D | 2,329,578 | 182,099 |
| Mode M0 | |||
|---|---|---|---|
| Quadrant | BADHDUFLAG | Total packets | Discarded packets |
| A | 0 | 8000 | 3 |
| B | 0 | 8164 | 2 |
| C | 0 | 18017 | 2 |
| D | 0 | 9397 | 6 |
| Mode SS | |||
|---|---|---|---|
| Quadrant | BADHDUFLAG | Total packets | Discarded packets |
| A | 0 | 76 | 0 |
| B | 0 | 76 | 0 |
| C | 0 | 76 | 0 |
| D | 0 | 76 | 0 |
| Quadrant | Total seconds | Saturated seconds | Saturation percentage |
|---|---|---|---|
| A | 3736 | 69 | 1.846895% |
| B | 3736 | 103 | 2.756959% |
| C | 3736 | 1059 | 28.345824% |
| D | 3735 | 145 | 3.882195% |
Noise dominated data is calculated using 1-second bins in cleaned event files. If a bin has >2000 counts, and if more than 50% of those come from <1% of pixels, then it is considered to be noise-dominated and hence unusable.
| Quadrant | # 1 sec bins | Bins with >0 counts | Bins with >2000 counts | High rate bins dominated by noise | Noise dominated (total time) | Noise dominated (detector-on time) | Marked lightcurve |
|---|---|---|---|---|---|---|---|
| A | 3818 | 3739 | 0 | 0 | 0.00% | 0.00% | 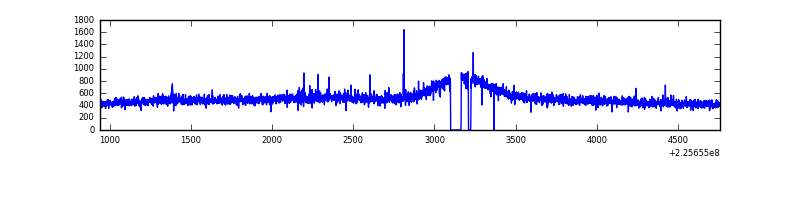 |
| B | 3818 | 3739 | 1 | 1 | 0.03% | 0.03% | 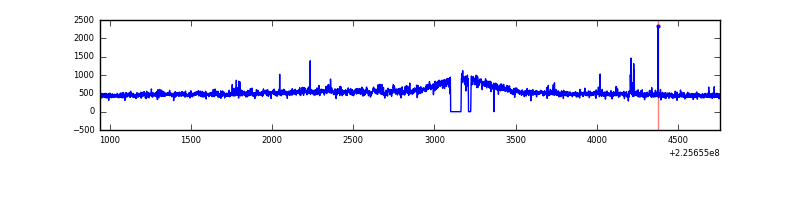 |
| C | 3818 | 3739 | 762 | 762 | 19.96% | 20.38% |  |
| D | 3818 | 3738 | 71 | 71 | 1.86% | 1.90% | 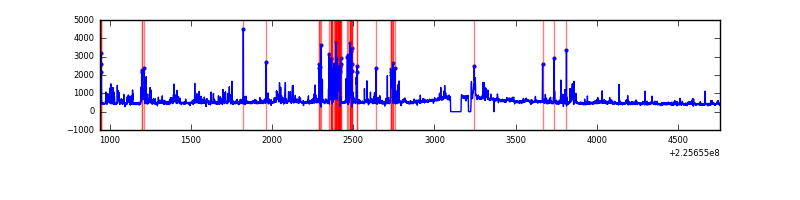 |
Top three noisy pixels from each quadrant. If the there are fewer than three noisy pixels in the level2.evt file, extra rows are filled as -1
| Pixel properties | Quadrant properties | ||||||
|---|---|---|---|---|---|---|---|
| Quadrant | DetID | PixID | Counts | Sigma | Mean | Median | Sigma |
| A | 13 | 251 | 26908 | 255.68 | 490 | 479 | 103.4 |
| A | 3 | 1 | 7356 | 66.53 | 490 | 479 | 103.4 |
| A | 0 | 226 | 4590 | 39.77 | 490 | 479 | 103.4 |
| B | 0 | 219 | 19085 | 191.75 | 491 | 479 | 97.0 |
| B | 4 | 81 | 13228 | 131.39 | 491 | 479 | 97.0 |
| B | 0 | 245 | 10001 | 98.13 | 491 | 479 | 97.0 |
| C | 9 | 243 | 2122958 | 20017.73 | 447 | 449 | 106.0 |
| C | 9 | 68 | 1319926 | 12444.2 | 447 | 449 | 106.0 |
| C | 8 | 128 | 7774 | 69.08 | 447 | 449 | 106.0 |
| D | 2 | 152 | 225879 | 1913.8 | 468 | 453 | 117.8 |
| D | 2 | 14 | 188390 | 1595.53 | 468 | 453 | 117.8 |
| D | 13 | 104 | 64242 | 541.55 | 468 | 453 | 117.8 |
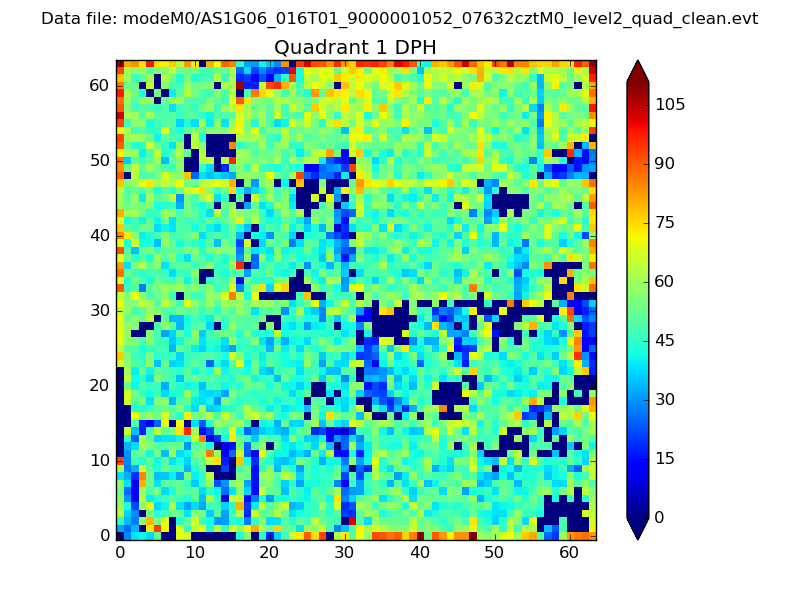
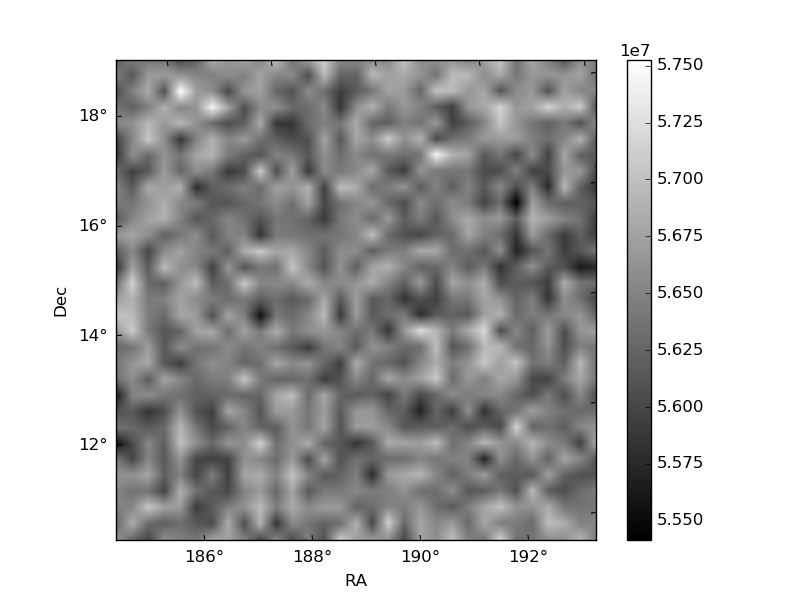
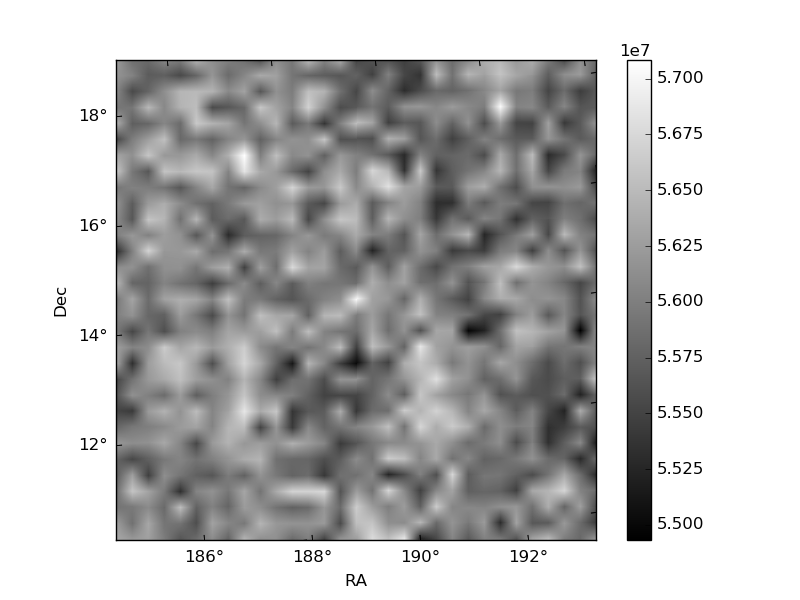
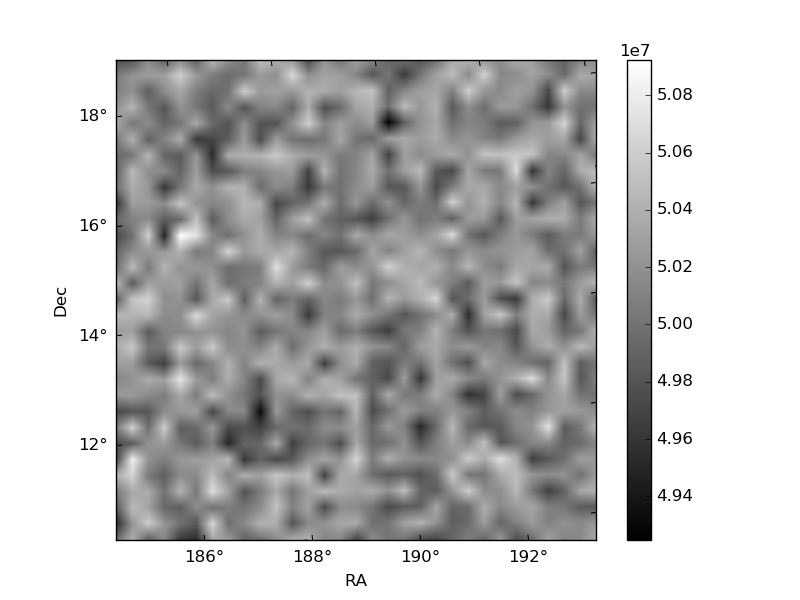
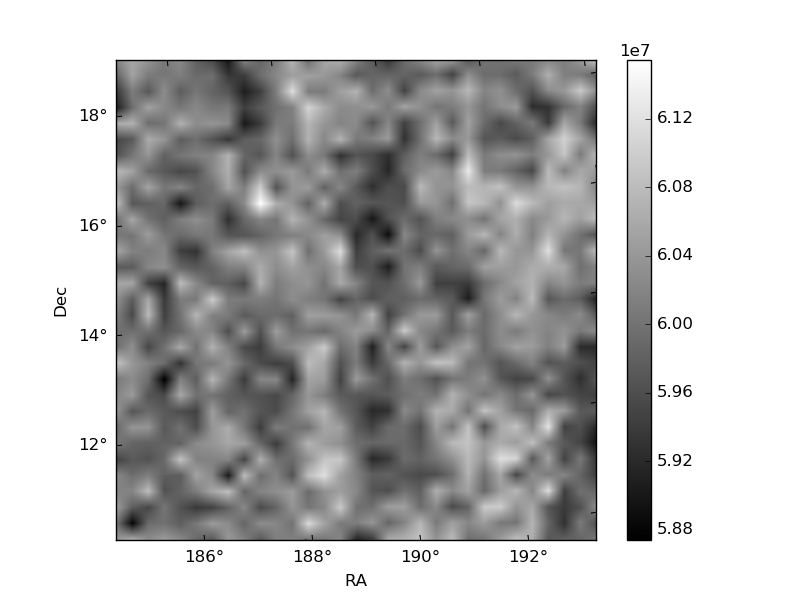
Histogram calculated using DETX and DETY for each event in the final _common_clean file
| Quadrant A | 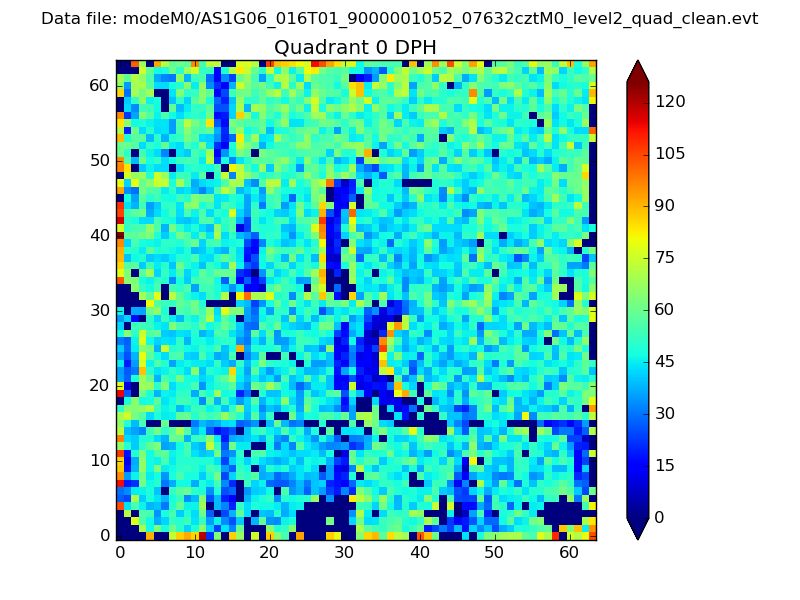 |
 |
Quadrant B |
|---|---|---|---|
| Quadrant D | 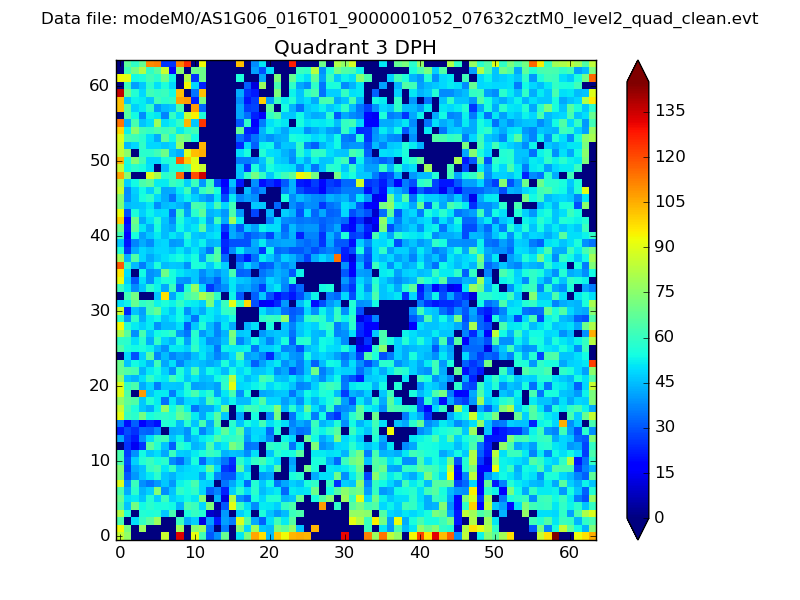 |
 |
Quadrant C |
| Plot type | Count rate plots | Images |
|---|---|---|
| Comparison with Poisson distribution Blue bars denote a histogram of data divided into 1 sec bins. Red curve is a Poisson curve with rate = median count rate of data. |
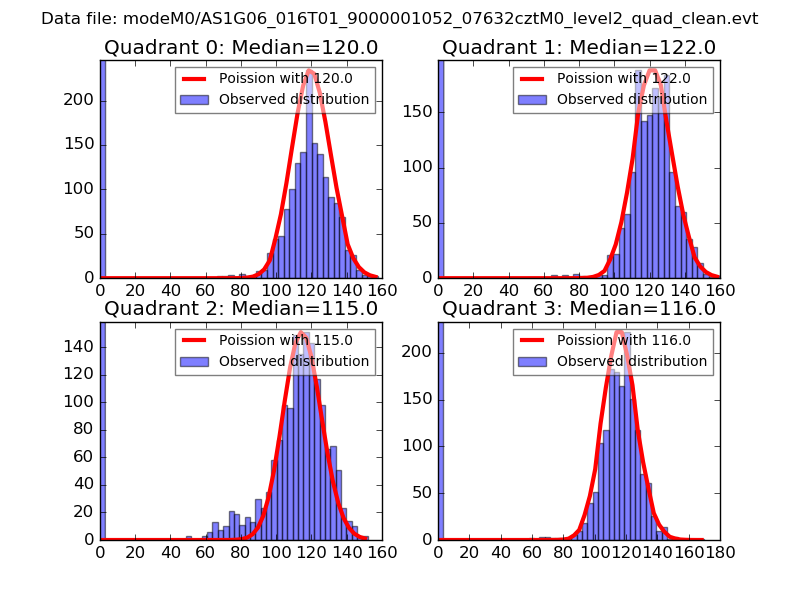 |
 |
| Quadrant-wise count rates Data is divided into 100 sec bins |
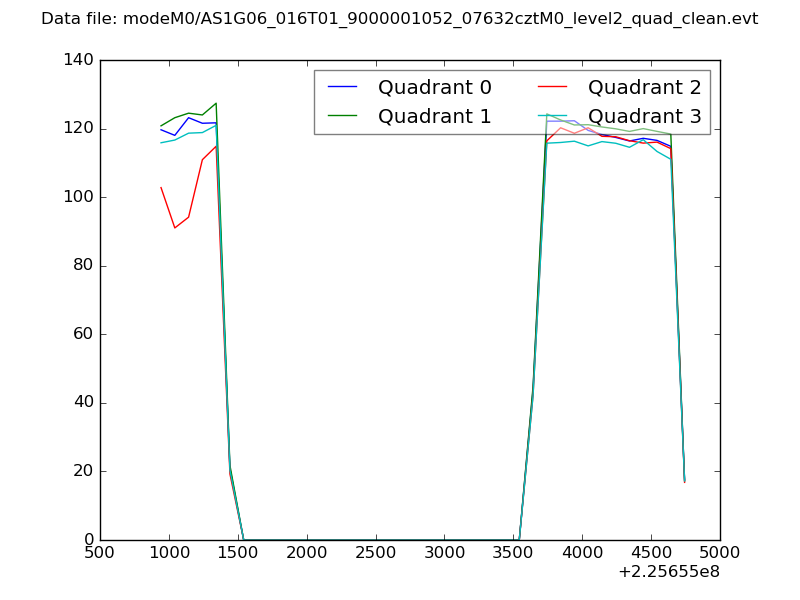 |
|
| Module-wise count rates for Quadrant A Data is divided into 100 sec bins |
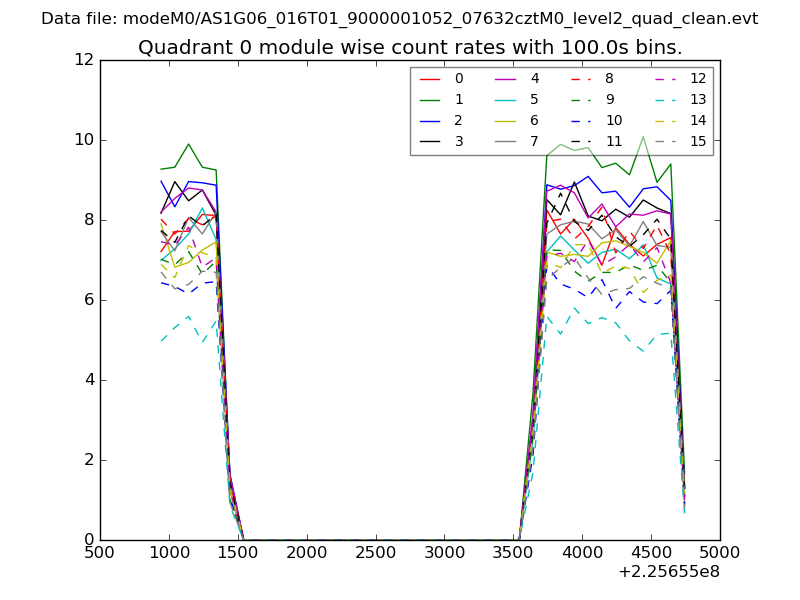 |
 |
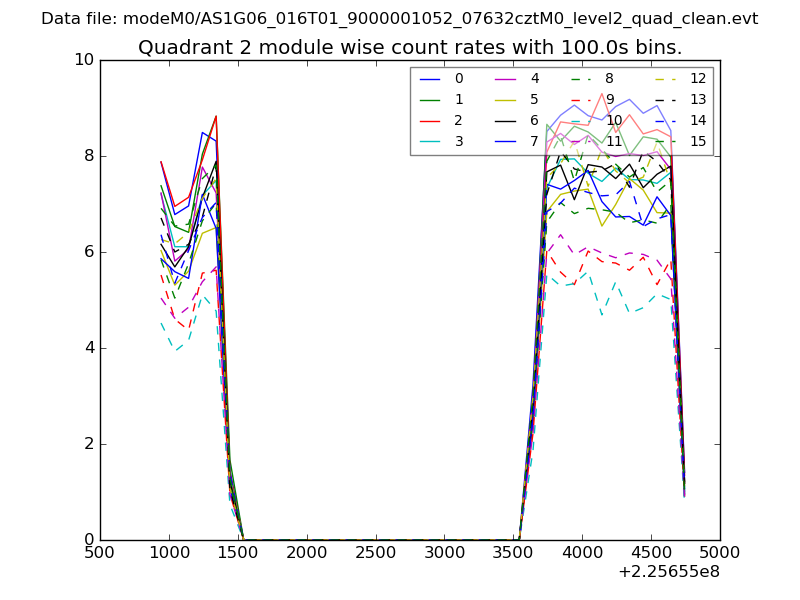
| Module-wise count rates for Quadrant B Data is divided into 100 sec bins |
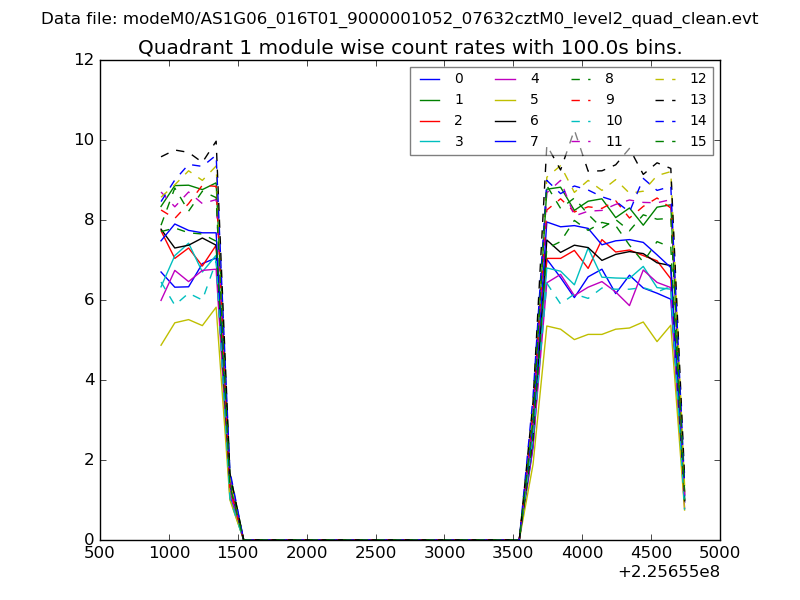 |
 |
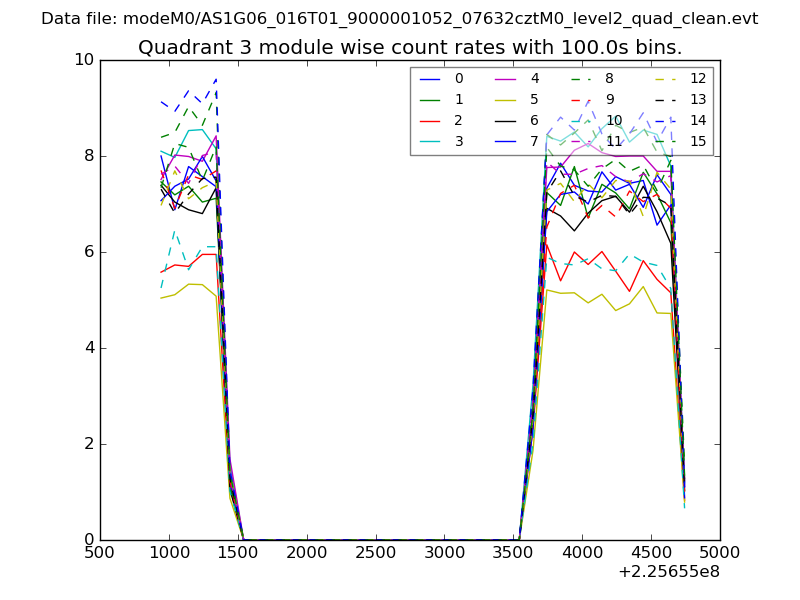
| Module-wise count rates for Quadrant C Data is divided into 100 sec bins |
 |
 |
| Module-wise count rates for Quadrant D Data is divided into 100 sec bins |
 |
 |
| Parameter | Plot |
|---|---|
| CZT HV Monitor | 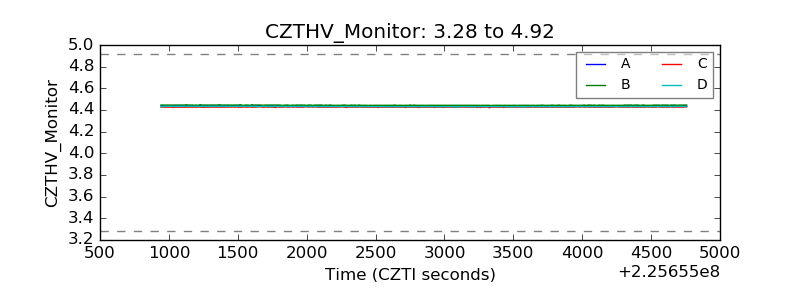 |
| D_VDD | 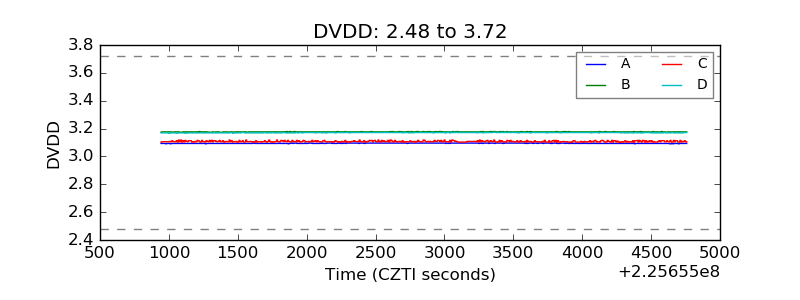 |
| Temperature 1 | 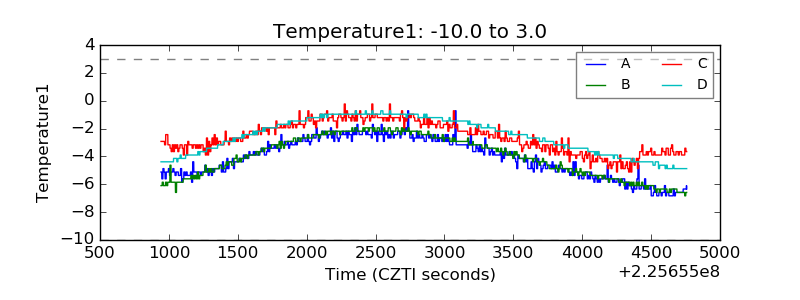 |
| Veto HV Monitor | 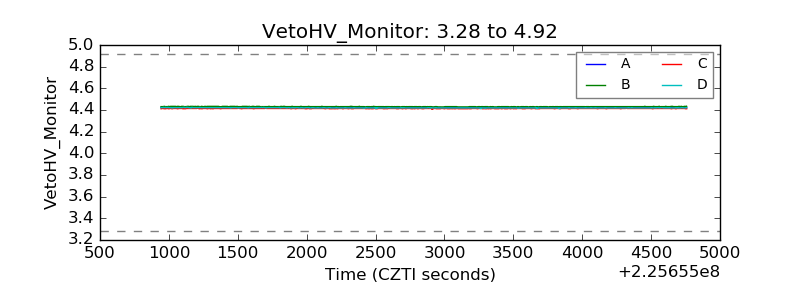 |
| Veto LLD | 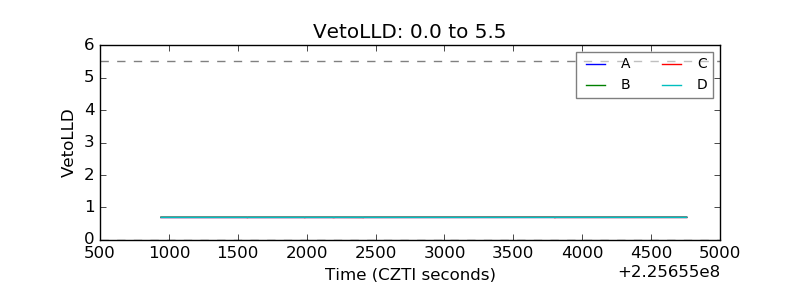 |
| Alpha Counter | 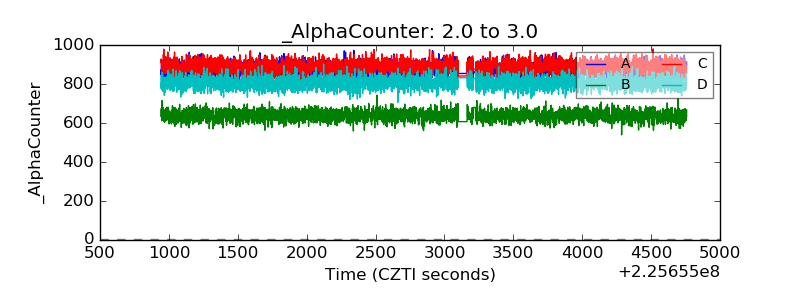 |
| _CPM_Rate | 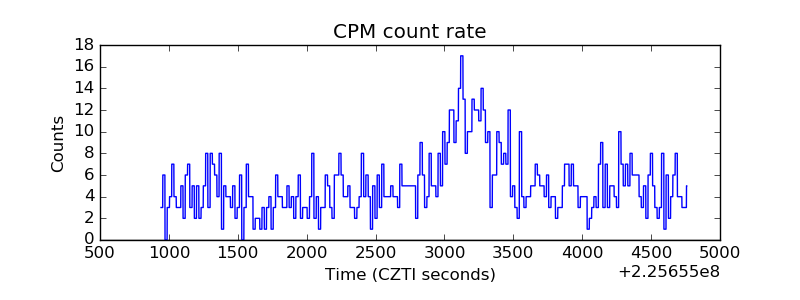 |
| CZT Counter |  |
| +2.5 Volts monitor | 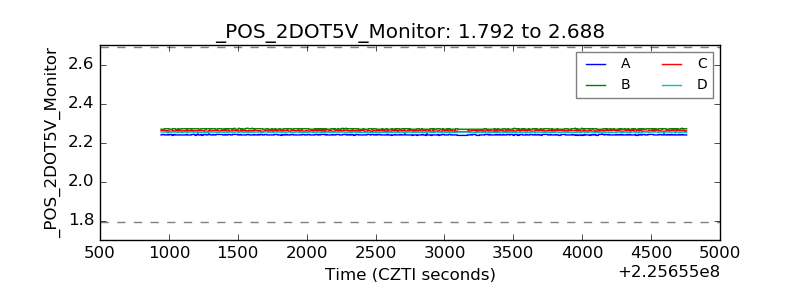 |
| +5 Volts monitor |  |
| _ROLL_ROT | 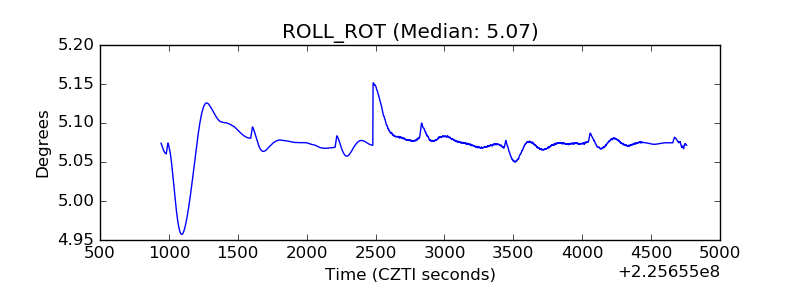 |
| _Roll_DEC | 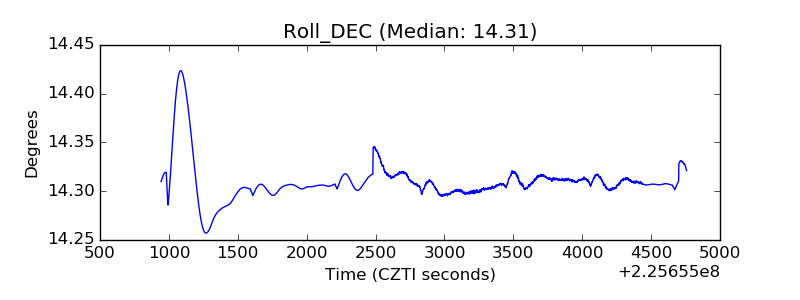 |
| _Roll_RA | 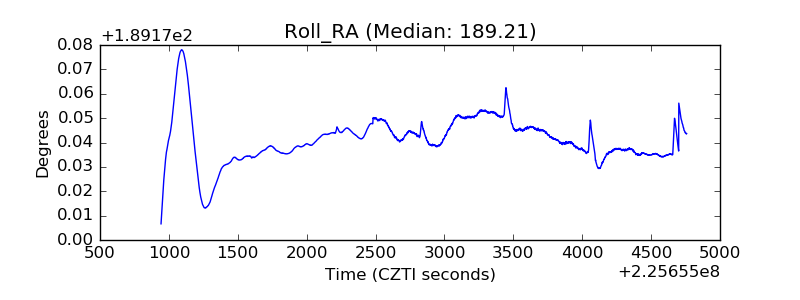 |
| Veto Counter | 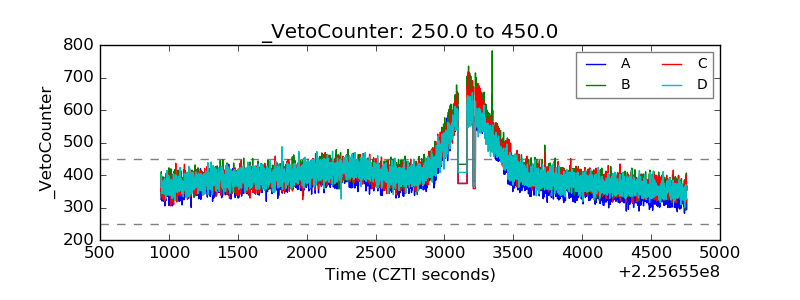 |