| Param | Original file | Final file |
|---|---|---|
| Filename | modeM0/AS1G06_016T01_9000001052_07633cztM0_level2.evt | modeM0/AS1G06_016T01_9000001052_07633cztM0_level2_quad_clean.evt |
| Size (bytes) | 747,216,000 | 99,766,080 |
| Size | 712.6 MB | 95.1 MB |
| Events in quadrant A | 4,403,008 | 608,091 |
| Events in quadrant B | 4,360,827 | 617,237 |
| Events in quadrant C | 8,475,416 | 595,368 |
| Events in quadrant D | 4,793,741 | 588,434 |
| Mode M0 | |||
|---|---|---|---|
| Quadrant | BADHDUFLAG | Total packets | Discarded packets |
| A | 0 | 19058 | 7 |
| B | 0 | 18871 | 3 |
| C | 0 | 31330 | 9 |
| D | 0 | 20484 | 8 |
| Mode M9 | |||
|---|---|---|---|
| Quadrant | BADHDUFLAG | Total packets | Discarded packets |
| A | 0 | 2 | 0 |
| B | 0 | 2 | 0 |
| C | 0 | 2 | 0 |
| D | 0 | 2 | 0 |
| Mode SS | |||
|---|---|---|---|
| Quadrant | BADHDUFLAG | Total packets | Discarded packets |
| A | 0 | 180 | 0 |
| B | 0 | 180 | 0 |
| C | 0 | 180 | 0 |
| D | 0 | 180 | 0 |
| Quadrant | Total seconds | Saturated seconds | Saturation percentage |
|---|---|---|---|
| A | 8811 | 131 | 1.486778% |
| B | 8812 | 199 | 2.258284% |
| C | 8810 | 924 | 10.488082% |
| D | 8810 | 216 | 2.451759% |
Noise dominated data is calculated using 1-second bins in cleaned event files. If a bin has >2000 counts, and if more than 50% of those come from <1% of pixels, then it is considered to be noise-dominated and hence unusable.
| Quadrant | # 1 sec bins | Bins with >0 counts | Bins with >2000 counts | High rate bins dominated by noise | Noise dominated (total time) | Noise dominated (detector-on time) | Marked lightcurve |
|---|---|---|---|---|---|---|---|
| A | 9114 | 8816 | 3 | 3 | 0.03% | 0.03% | 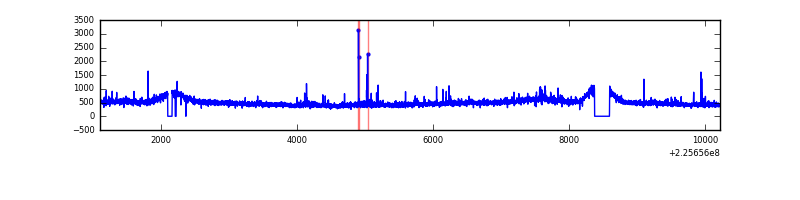 |
| B | 9114 | 8816 | 2 | 2 | 0.02% | 0.02% | 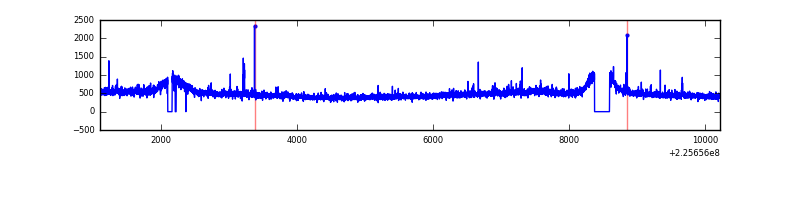 |
| C | 9114 | 8816 | 477 | 477 | 5.23% | 5.41% | 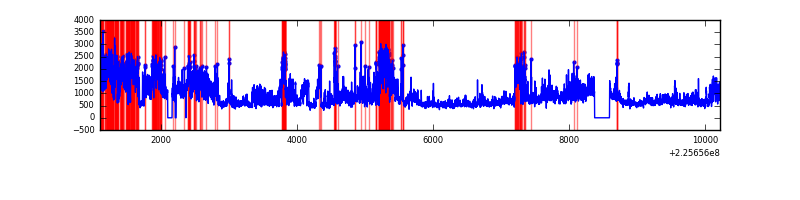 |
| D | 9113 | 8815 | 107 | 107 | 1.17% | 1.21% | 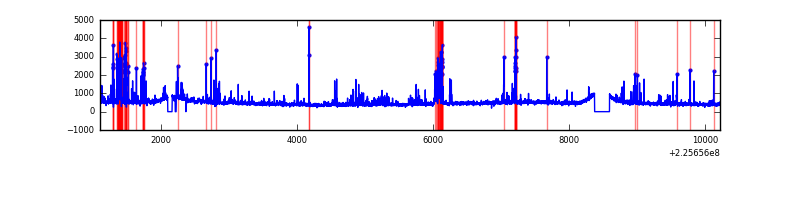 |
Top three noisy pixels from each quadrant. If the there are fewer than three noisy pixels in the level2.evt file, extra rows are filled as -1
| Pixel properties | Quadrant properties | ||||||
|---|---|---|---|---|---|---|---|
| Quadrant | DetID | PixID | Counts | Sigma | Mean | Median | Sigma |
| A | 13 | 251 | 147607 | 653.62 | 1083 | 1056 | 224.2 |
| A | 0 | 128 | 47230 | 205.94 | 1083 | 1056 | 224.2 |
| A | 13 | 248 | 25223 | 107.78 | 1083 | 1056 | 224.2 |
| B | 0 | 219 | 32747 | 149.34 | 1093 | 1065 | 212.1 |
| B | 12 | 111 | 21909 | 98.25 | 1093 | 1065 | 212.1 |
| B | 0 | 214 | 21756 | 97.53 | 1093 | 1065 | 212.1 |
| C | 9 | 68 | 2494558 | 10361.15 | 1027 | 1031 | 240.7 |
| C | 9 | 243 | 1858204 | 7716.96 | 1027 | 1031 | 240.7 |
| C | 1 | 16 | 82827 | 339.88 | 1027 | 1031 | 240.7 |
| D | 2 | 152 | 356380 | 1367.31 | 1041 | 1007 | 259.9 |
| D | 2 | 14 | 308532 | 1183.22 | 1041 | 1007 | 259.9 |
| D | 13 | 104 | 78020 | 296.31 | 1041 | 1007 | 259.9 |
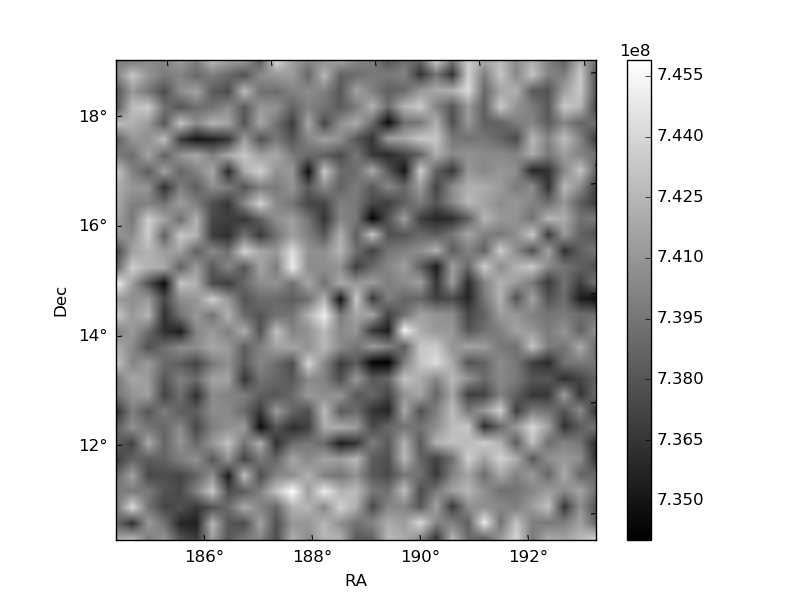
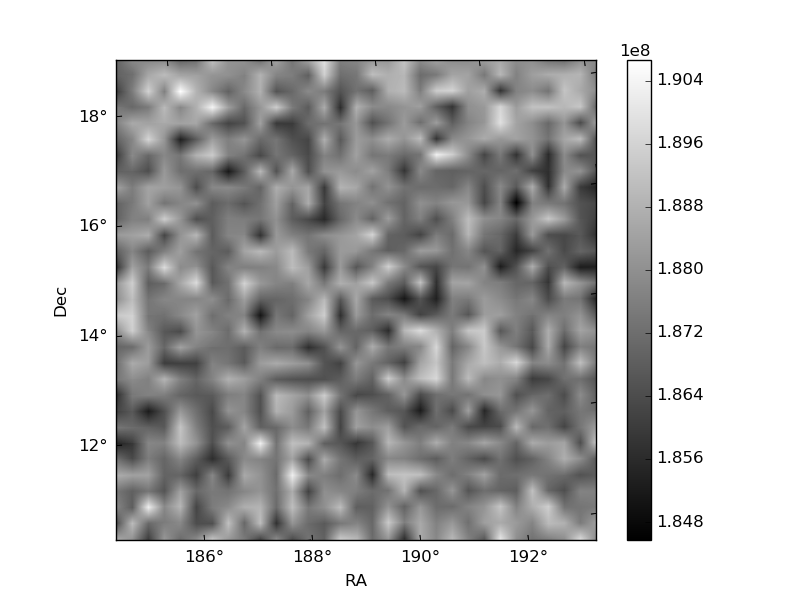
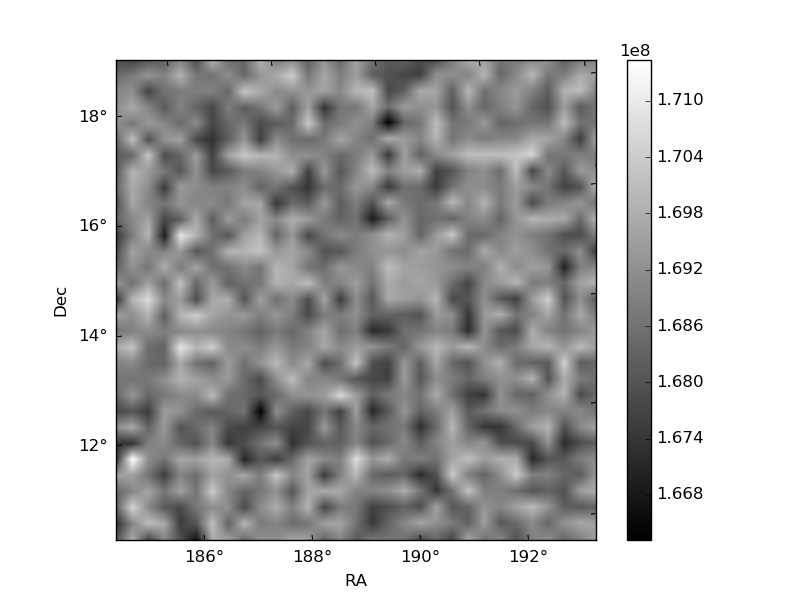
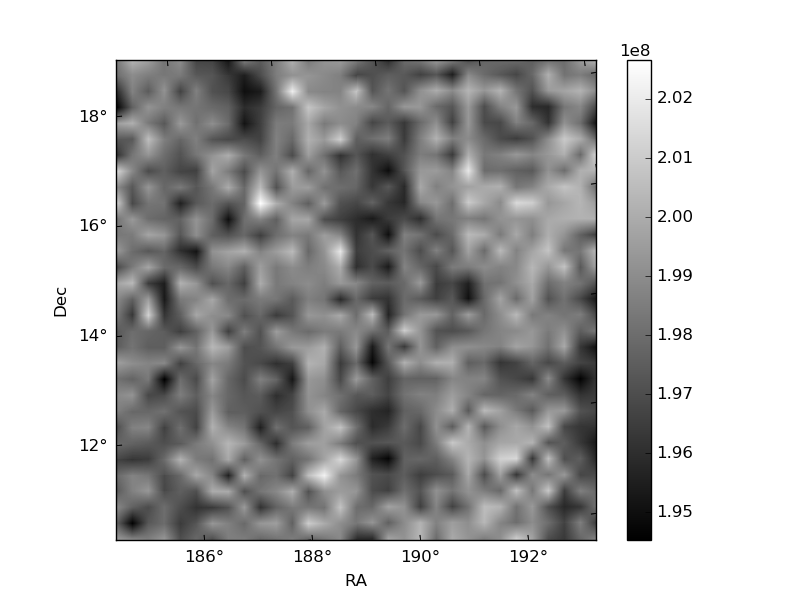
Histogram calculated using DETX and DETY for each event in the final _common_clean file
| Quadrant A | 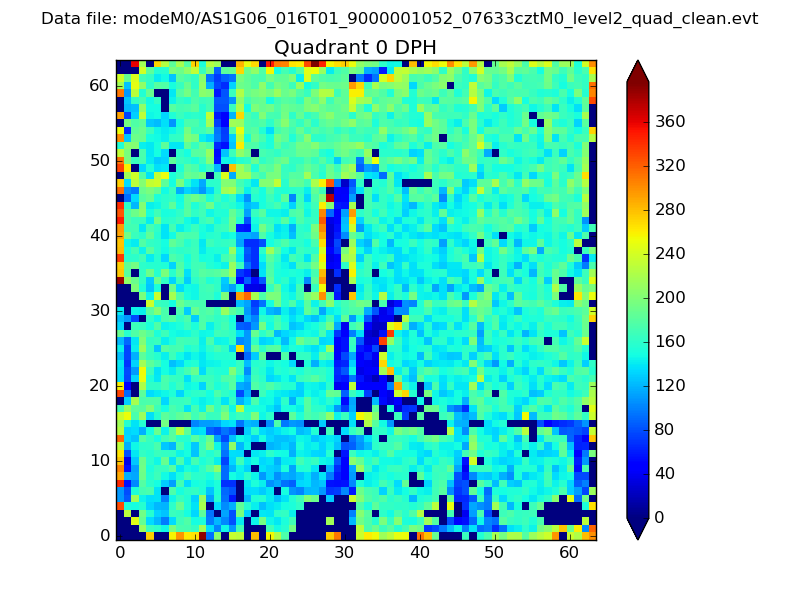 |
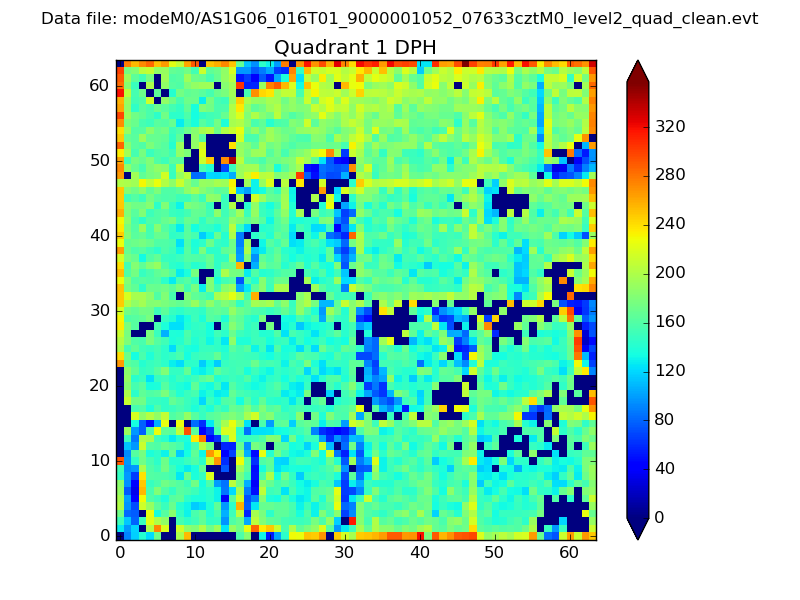 |
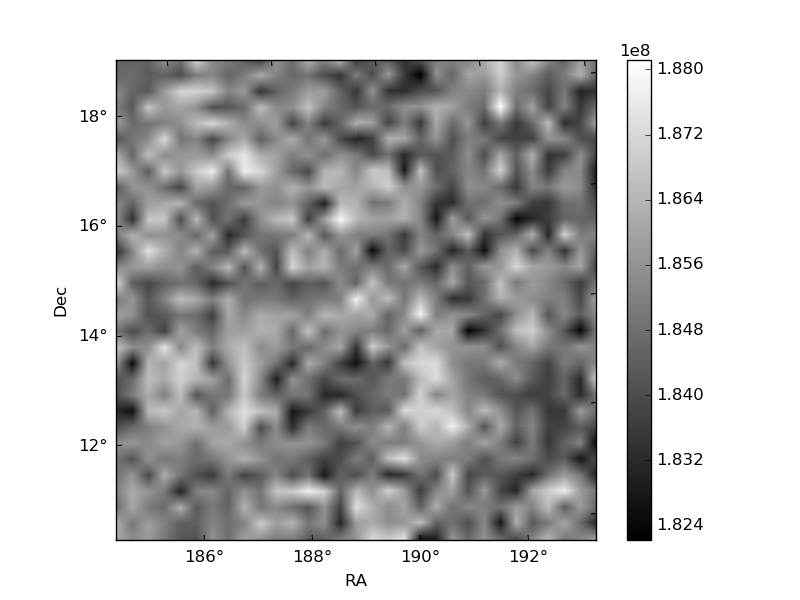
Quadrant B |
|---|---|---|---|
| Quadrant D | 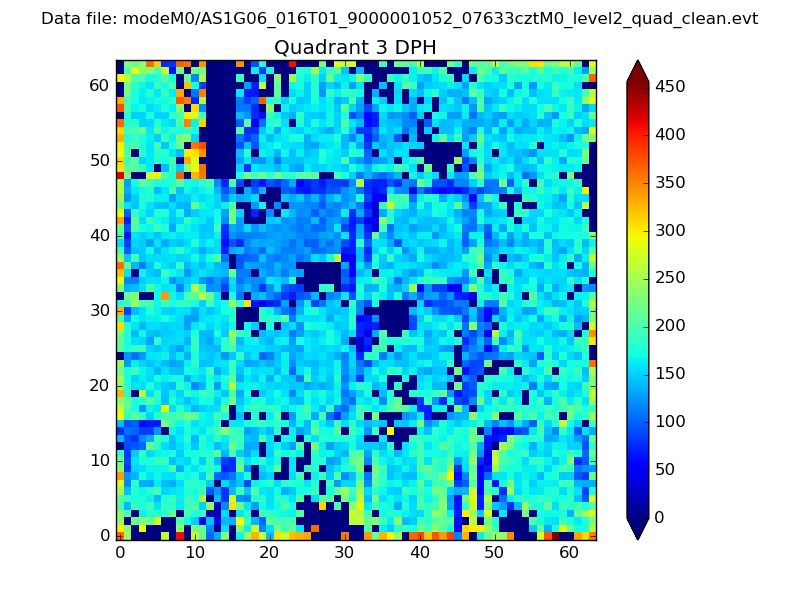 |
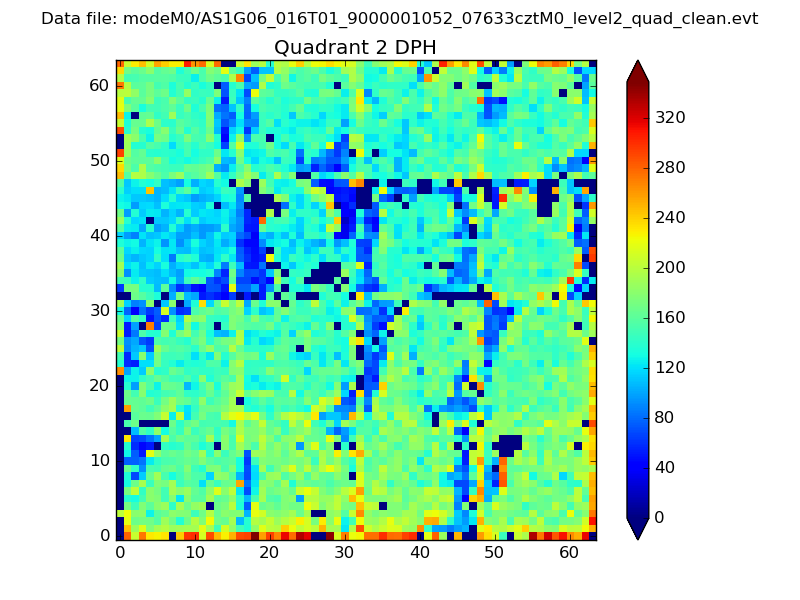 |
Quadrant C |
| Plot type | Count rate plots | Images |
|---|---|---|
| Comparison with Poisson distribution Blue bars denote a histogram of data divided into 1 sec bins. Red curve is a Poisson curve with rate = median count rate of data. |
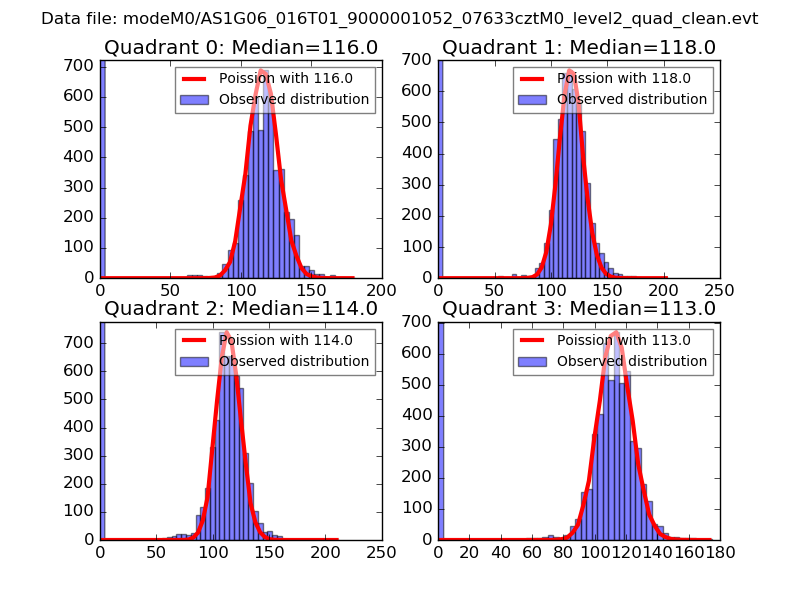 |
 |
| Quadrant-wise count rates Data is divided into 100 sec bins |
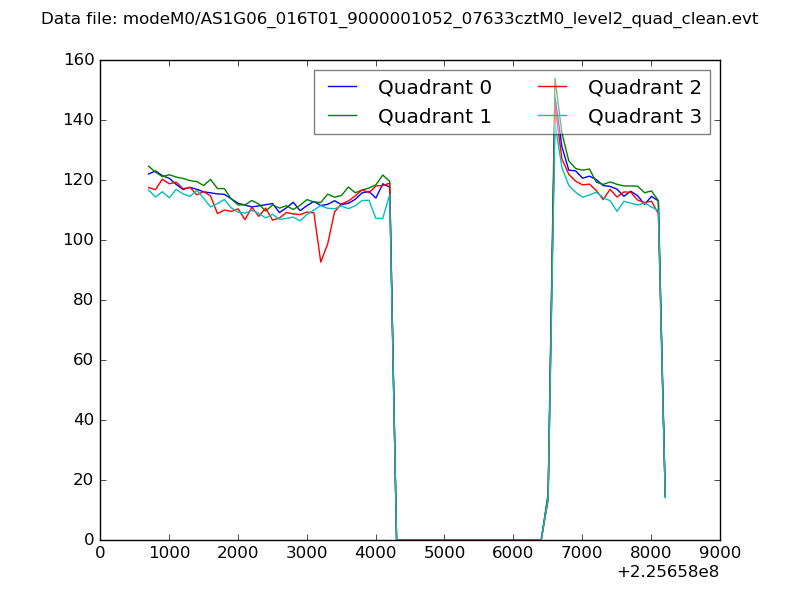 |
|
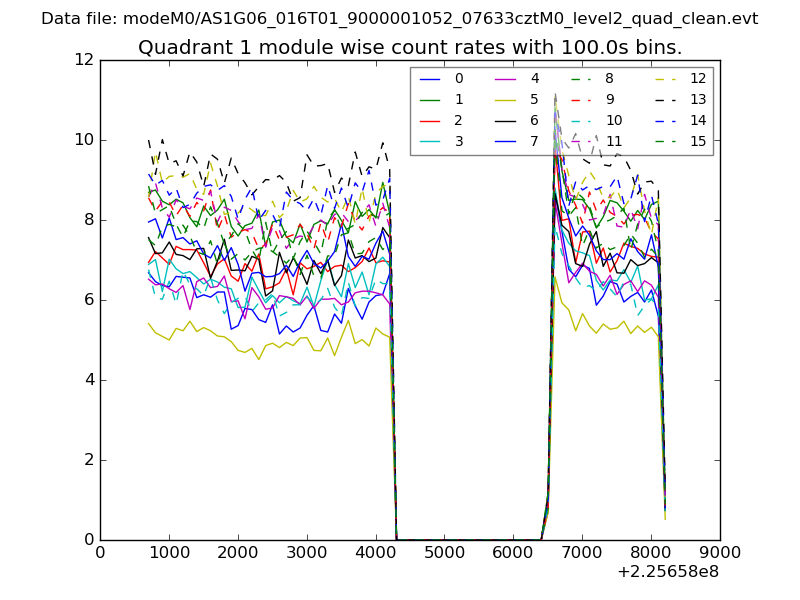
| Module-wise count rates for Quadrant A Data is divided into 100 sec bins |
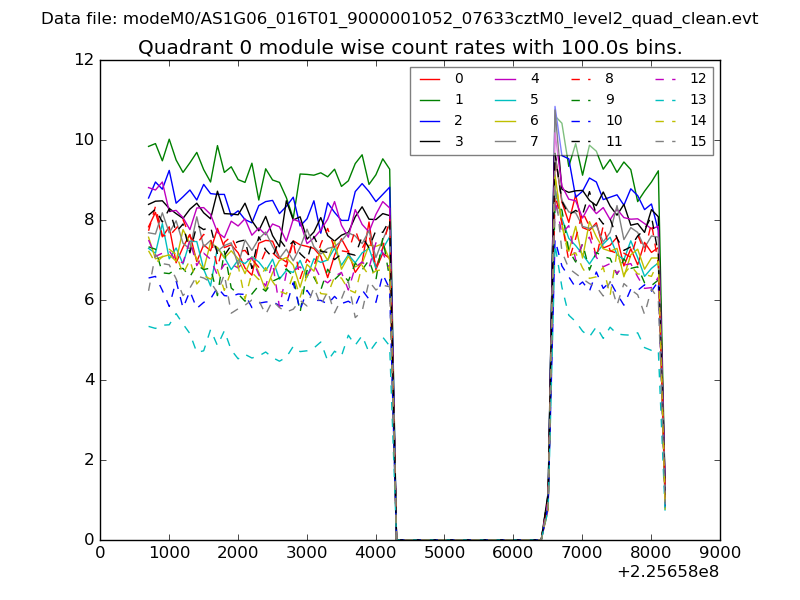 |
 |
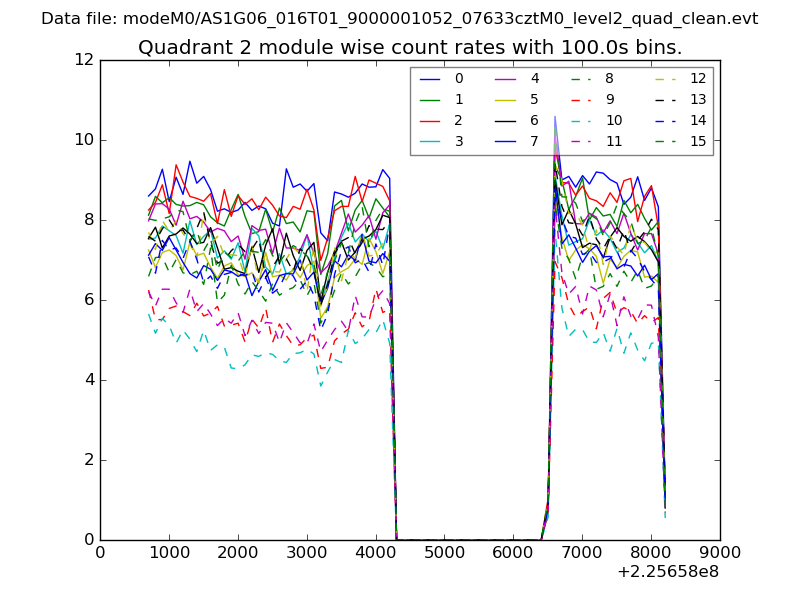
| Module-wise count rates for Quadrant B Data is divided into 100 sec bins |
 |
 |
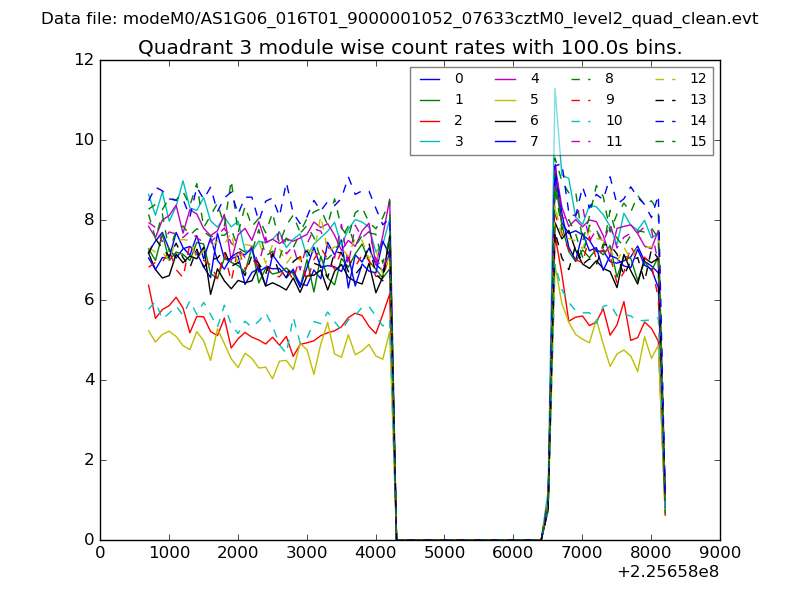
| Module-wise count rates for Quadrant C Data is divided into 100 sec bins |
 |
 |
| Module-wise count rates for Quadrant D Data is divided into 100 sec bins |
 |
 |
| Parameter | Plot |
|---|---|
| CZT HV Monitor | 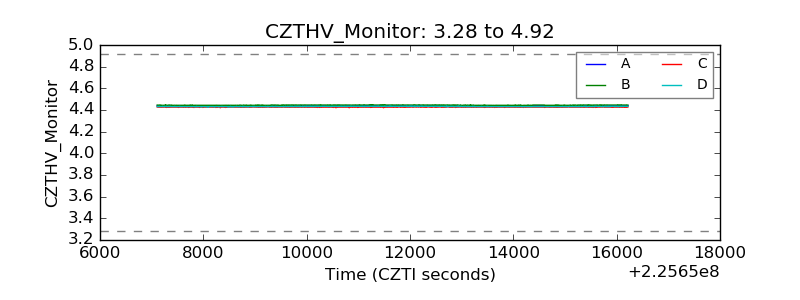 |
| D_VDD | 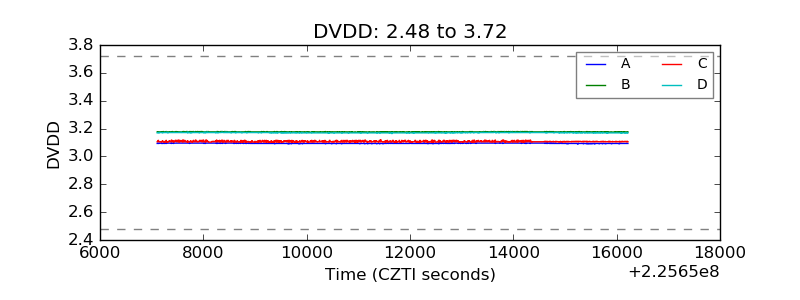 |
| Temperature 1 | 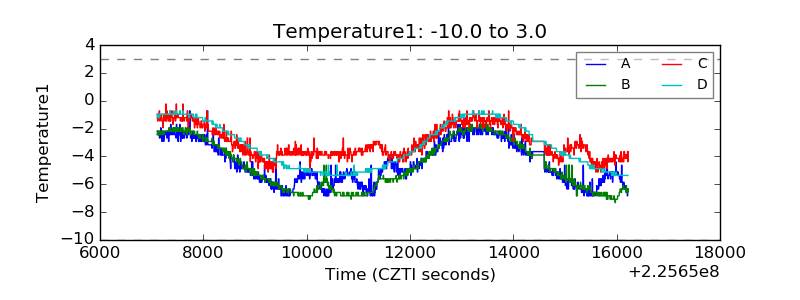 |
| Veto HV Monitor | 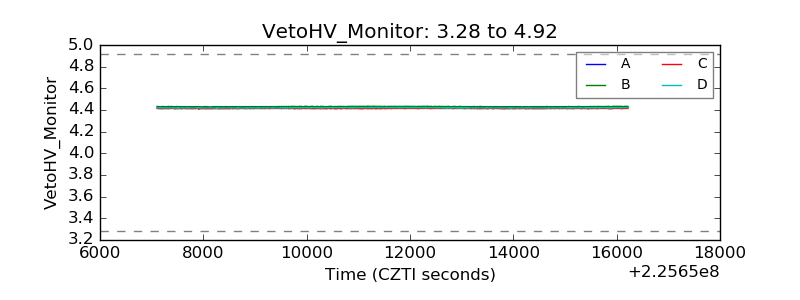 |
| Veto LLD | 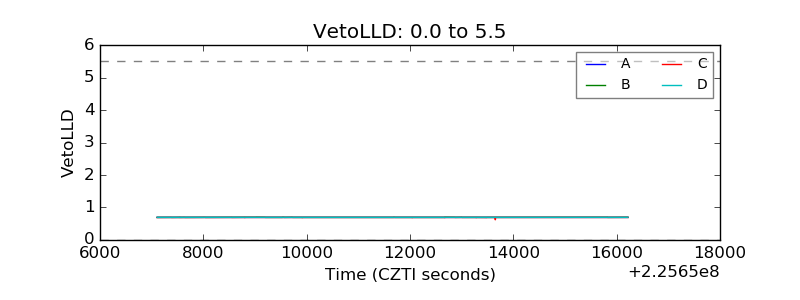 |
| Alpha Counter | 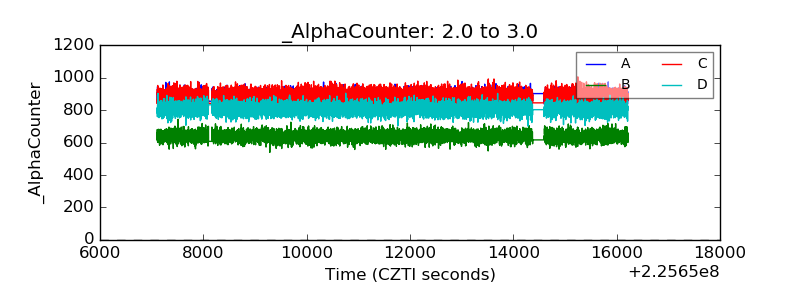 |
| _CPM_Rate | 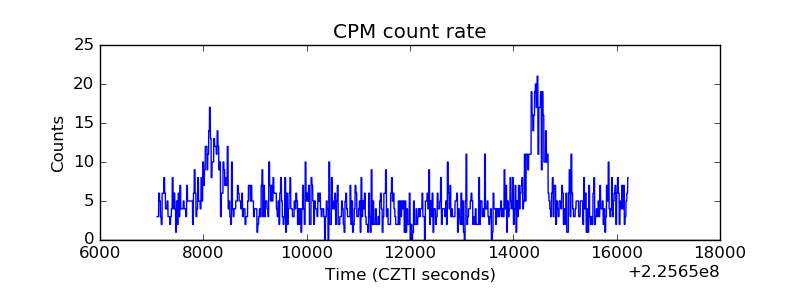 |
| CZT Counter | 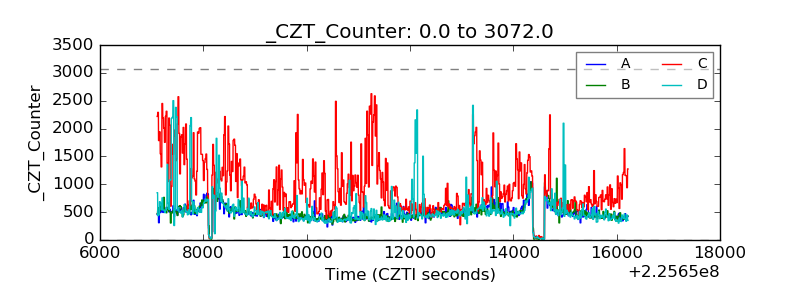 |
| +2.5 Volts monitor |  |
| +5 Volts monitor |  |
| _ROLL_ROT | 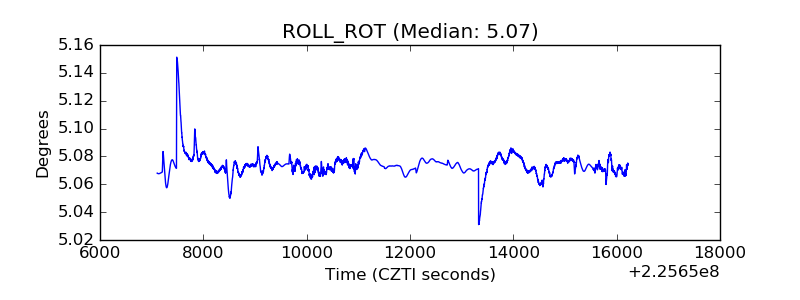 |
| _Roll_DEC | 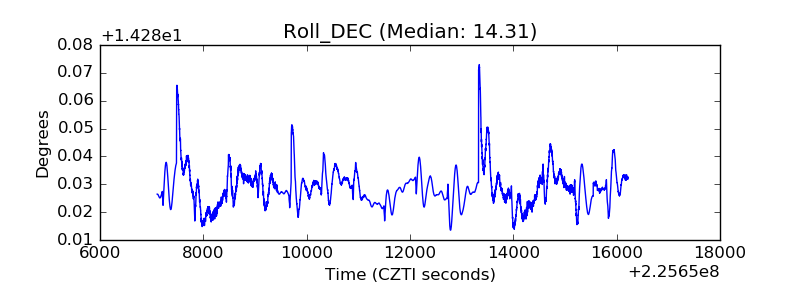 |
| _Roll_RA | 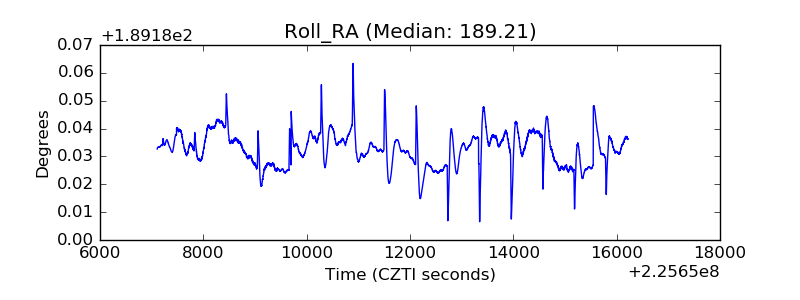 |
| Veto Counter | 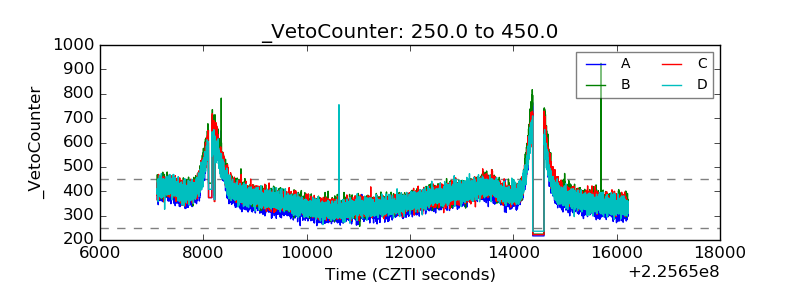 |