| Param | Original file | Final file |
|---|---|---|
| Filename | modeM0/AS1G06_016T01_9000001052_07636cztM0_level2.evt | modeM0/AS1G06_016T01_9000001052_07636cztM0_level2_quad_clean.evt |
| Size (bytes) | 1,502,389,440 | 203,080,320 |
| Size | 1.4 GB | 193.7 MB |
| Events in quadrant A | 7,764,048 | 1,257,343 |
| Events in quadrant B | 7,646,049 | 1,286,391 |
| Events in quadrant C | 20,515,625 | 1,277,313 |
| Events in quadrant D | 8,484,516 | 1,215,252 |
| Mode M0 | |||
|---|---|---|---|
| Quadrant | BADHDUFLAG | Total packets | Discarded packets |
| A | 0 | 40203 | 5921 |
| B | 0 | 39749 | 5714 |
| C | 0 | 88307 | 17107 |
| D | 0 | 43990 | 6956 |
| Mode M9 | |||
|---|---|---|---|
| Quadrant | BADHDUFLAG | Total packets | Discarded packets |
| A | 0 | 21 | 2 |
| B | 0 | 20 | 2 |
| C | 0 | 21 | 3 |
| D | 0 | 21 | 3 |
| Mode SS | |||
|---|---|---|---|
| Quadrant | BADHDUFLAG | Total packets | Discarded packets |
| A | 0 | 389 | 61 |
| B | 0 | 389 | 65 |
| C | 0 | 389 | 58 |
| D | 0 | 389 | 52 |
| Quadrant | Total seconds | Saturated seconds | Saturation percentage |
|---|---|---|---|
| A | 16431 | 65 | 0.395594% |
| B | 16451 | 94 | 0.571394% |
| C | 15250 | 4617 | 30.275410% |
| D | 16314 | 168 | 1.029790% |
Noise dominated data is calculated using 1-second bins in cleaned event files. If a bin has >2000 counts, and if more than 50% of those come from <1% of pixels, then it is considered to be noise-dominated and hence unusable.
| Quadrant | # 1 sec bins | Bins with >0 counts | Bins with >2000 counts | High rate bins dominated by noise | Noise dominated (total time) | Noise dominated (detector-on time) | Marked lightcurve |
|---|---|---|---|---|---|---|---|
| A | 21117 | 17686 | 0 | 0 | 0.00% | 0.00% |  |
| B | 21209 | 17723 | 7 | 7 | 0.03% | 0.04% | 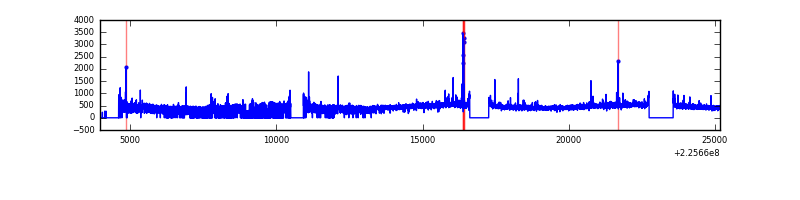 |
| C | 20822 | 16680 | 4114 | 4114 | 19.76% | 24.66% | 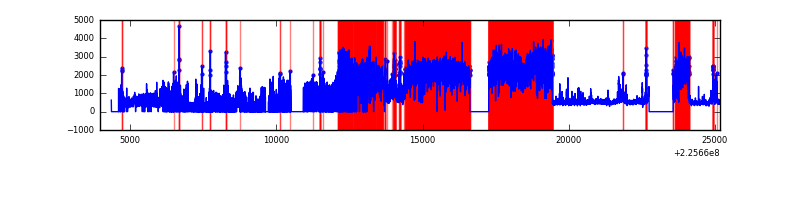 |
| D | 21077 | 17573 | 71 | 71 | 0.34% | 0.40% | 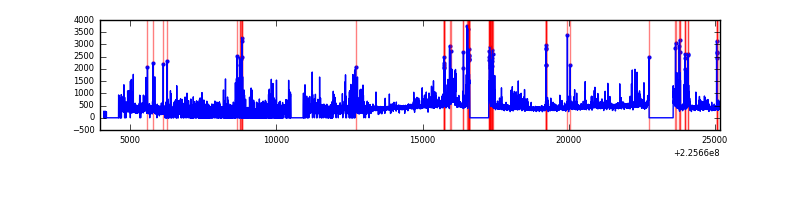 |
Top three noisy pixels from each quadrant. If the there are fewer than three noisy pixels in the level2.evt file, extra rows are filled as -1
| Pixel properties | Quadrant properties | ||||||
|---|---|---|---|---|---|---|---|
| Quadrant | DetID | PixID | Counts | Sigma | Mean | Median | Sigma |
| A | 0 | 128 | 262611 | 679.42 | 1895 | 1853 | 383.8 |
| A | 13 | 251 | 82705 | 210.66 | 1895 | 1853 | 383.8 |
| A | 4 | 2 | 66566 | 168.61 | 1895 | 1853 | 383.8 |
| B | 0 | 214 | 52174 | 136.6 | 1916 | 1869 | 368.3 |
| B | 4 | 81 | 41871 | 108.62 | 1916 | 1869 | 368.3 |
| B | 12 | 111 | 39336 | 101.74 | 1916 | 1869 | 368.3 |
| C | 9 | 68 | 14006575 | 38423.56 | 1571 | 1579 | 364.5 |
| C | 9 | 243 | 254765 | 694.63 | 1571 | 1579 | 364.5 |
| C | 4 | 254 | 75129 | 201.79 | 1571 | 1579 | 364.5 |
| D | 2 | 152 | 740427 | 1643.86 | 1829 | 1770 | 449.3 |
| D | 12 | 233 | 230034 | 508.0 | 1829 | 1770 | 449.3 |
| D | 2 | 14 | 202400 | 446.5 | 1829 | 1770 | 449.3 |
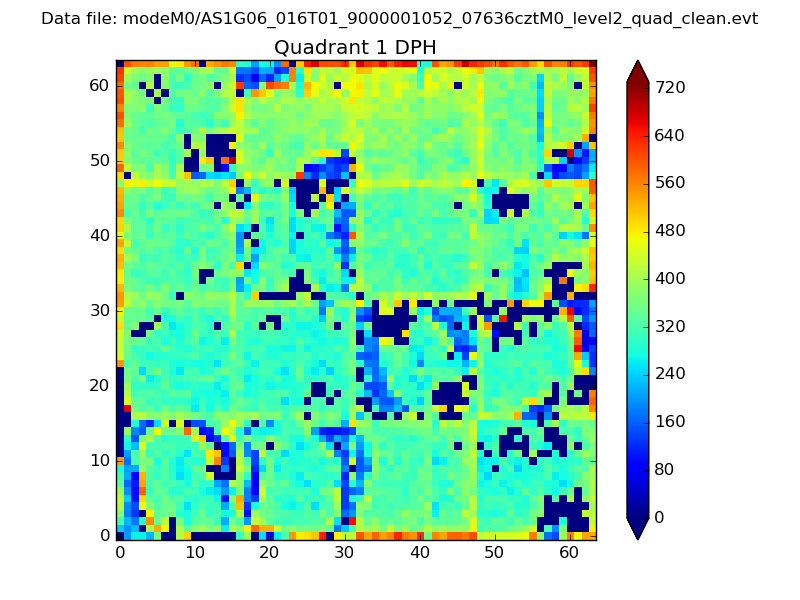
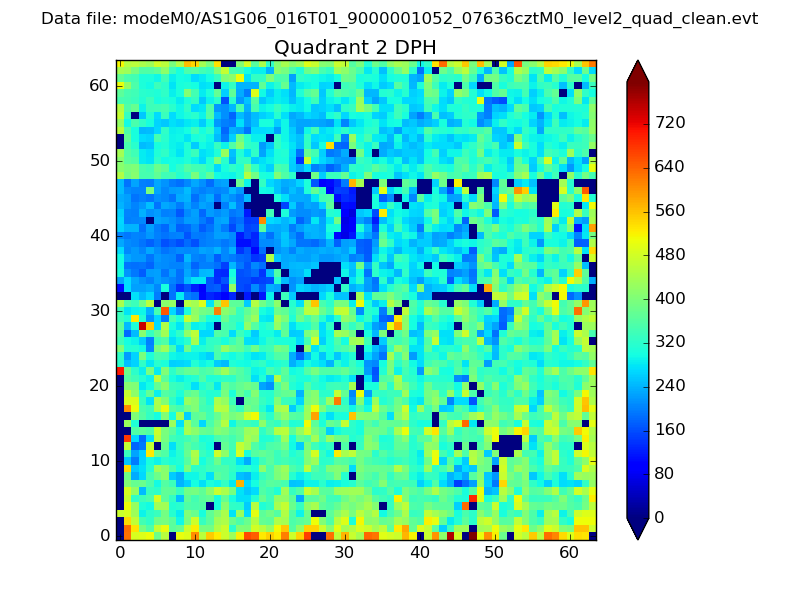
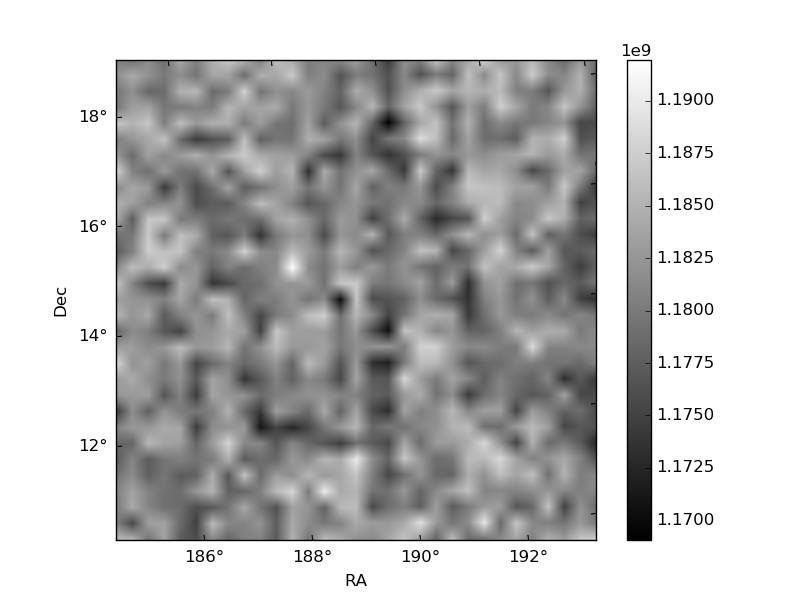
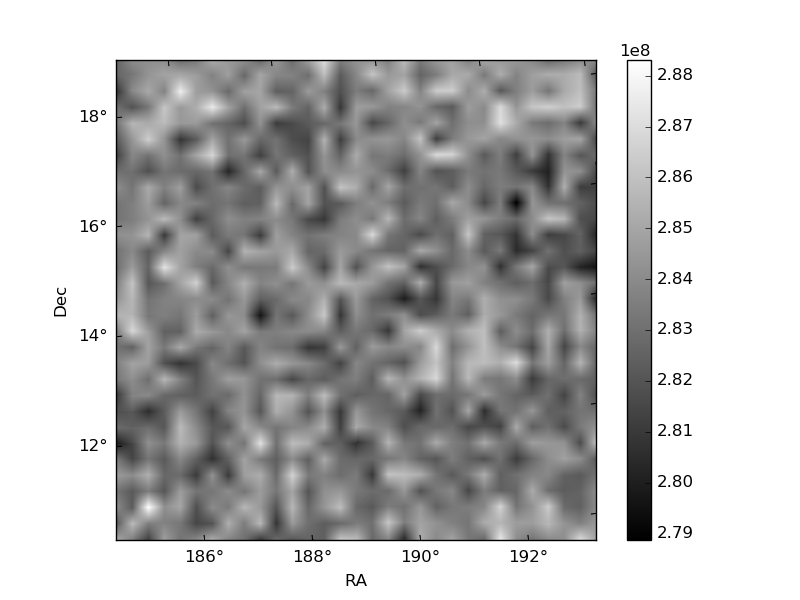
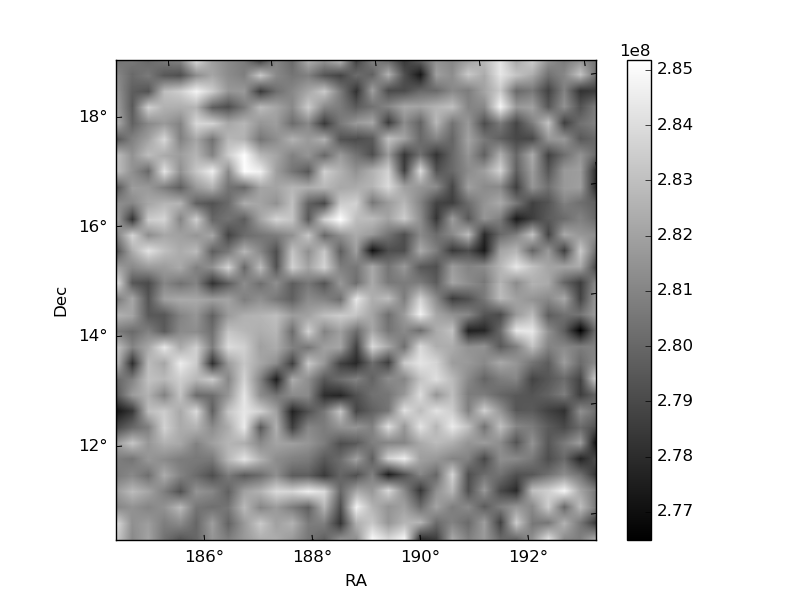
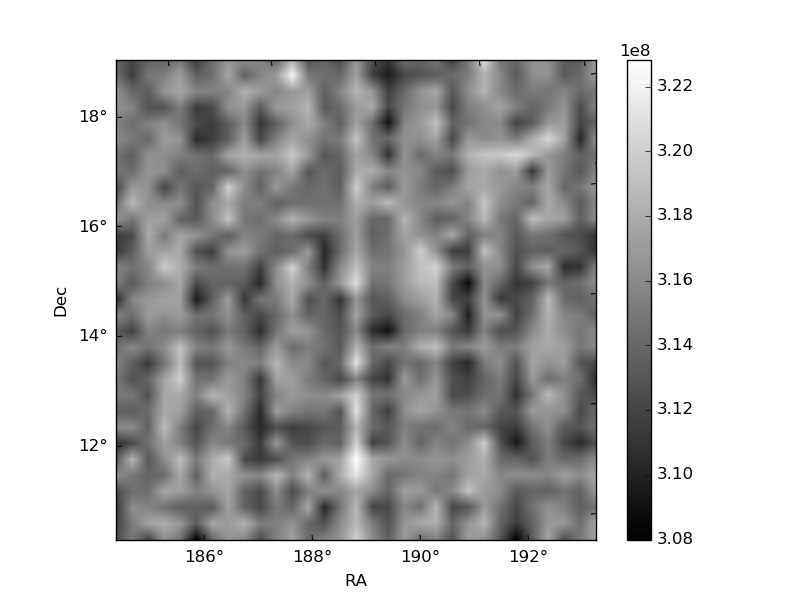
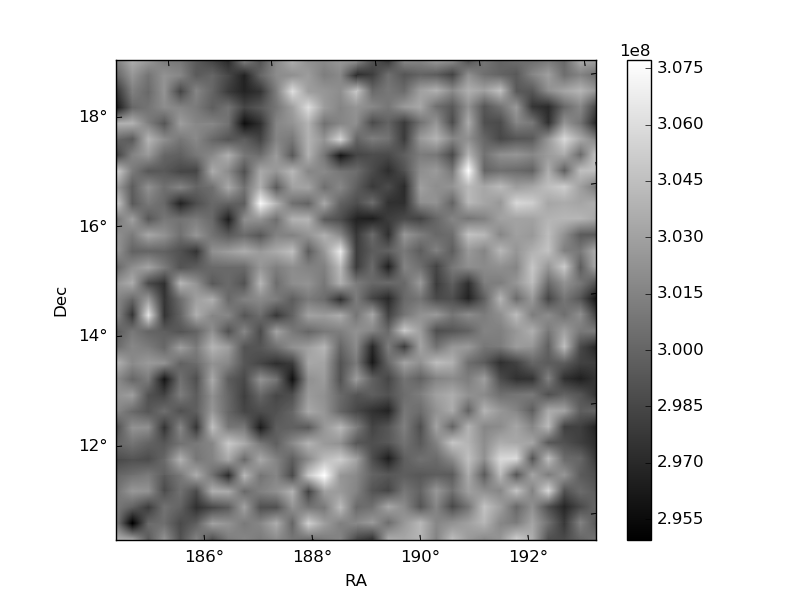
Histogram calculated using DETX and DETY for each event in the final _common_clean file
| Quadrant A | 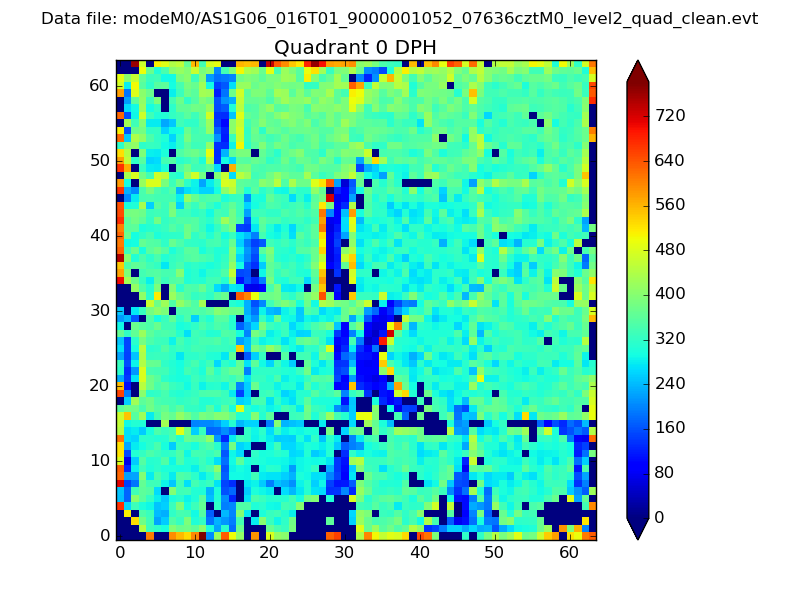 |
 |
Quadrant B |
|---|---|---|---|
| Quadrant D | 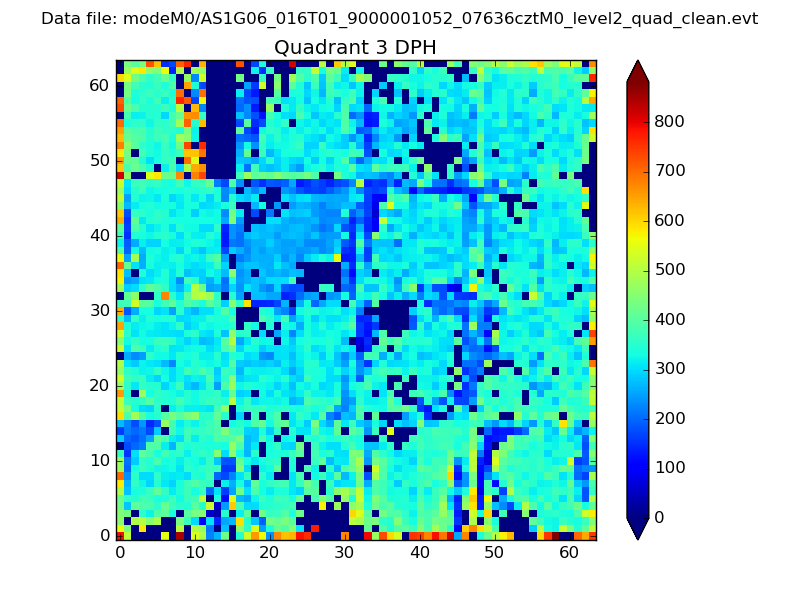 |
 |
Quadrant C |
| Plot type | Count rate plots | Images |
|---|---|---|
| Comparison with Poisson distribution Blue bars denote a histogram of data divided into 1 sec bins. Red curve is a Poisson curve with rate = median count rate of data. |
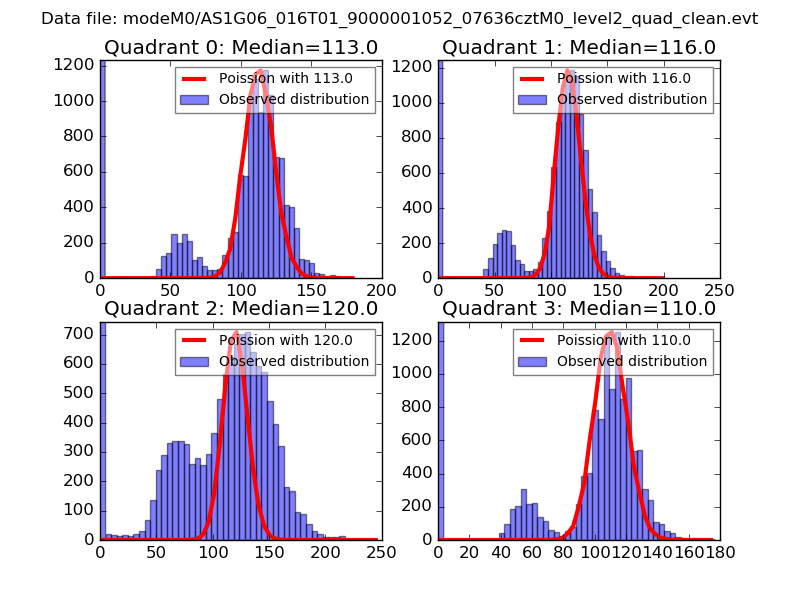 |
 |
| Quadrant-wise count rates Data is divided into 100 sec bins |
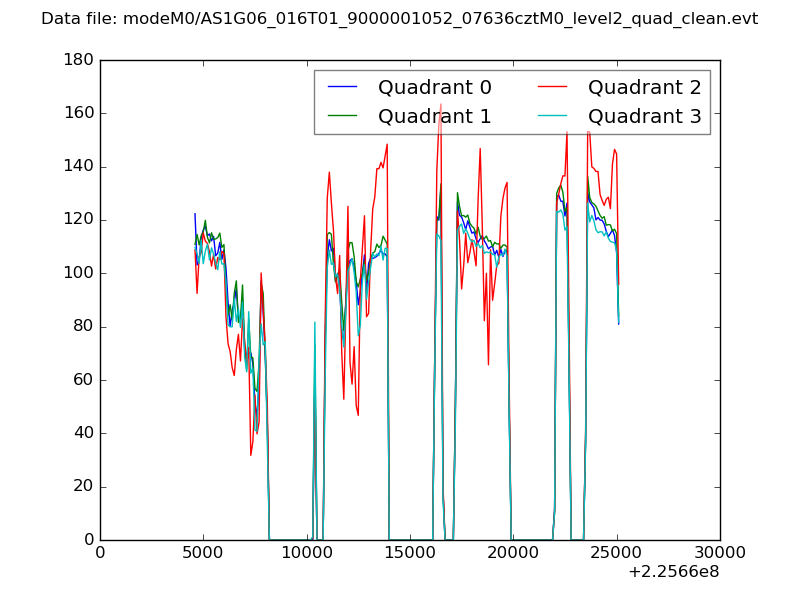 |
|
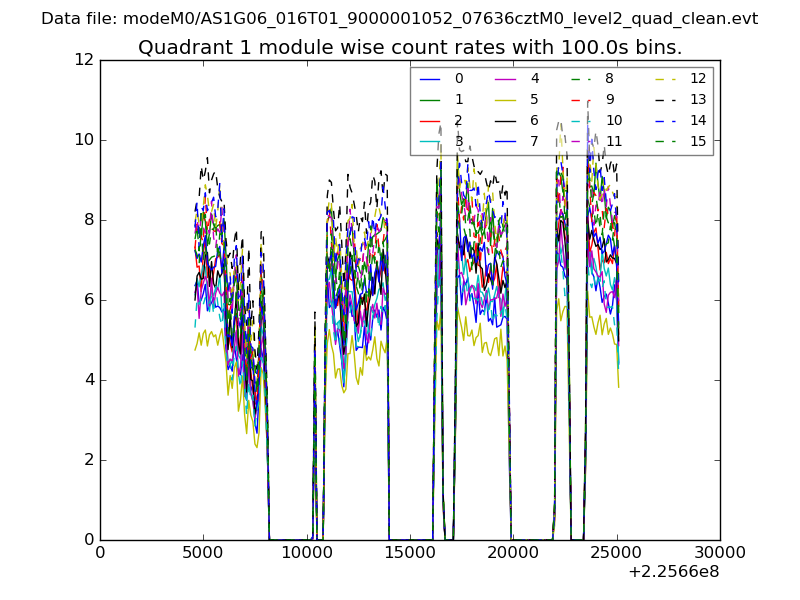
| Module-wise count rates for Quadrant A Data is divided into 100 sec bins |
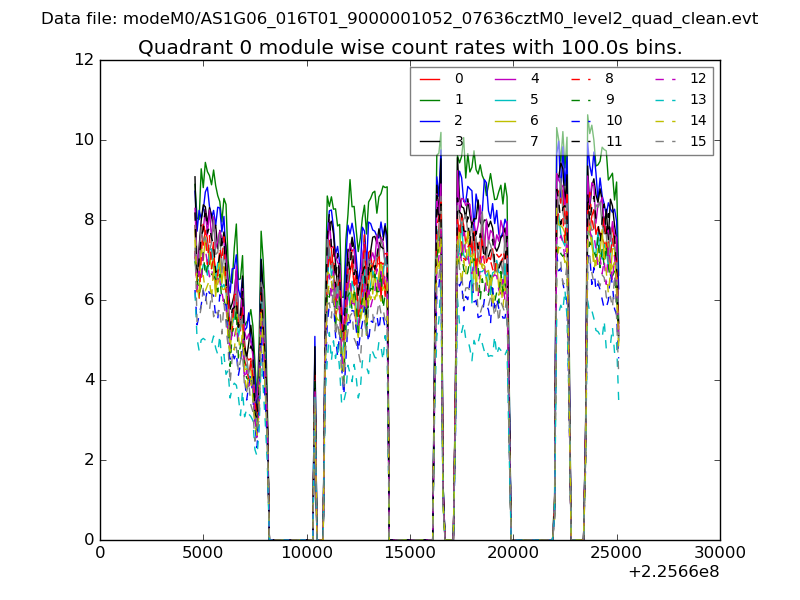 |
 |
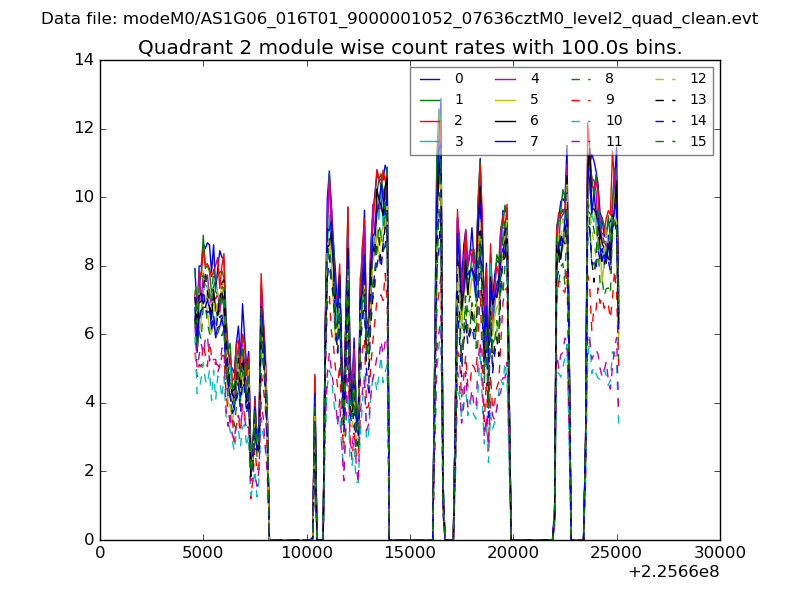
| Module-wise count rates for Quadrant B Data is divided into 100 sec bins |
 |
 |
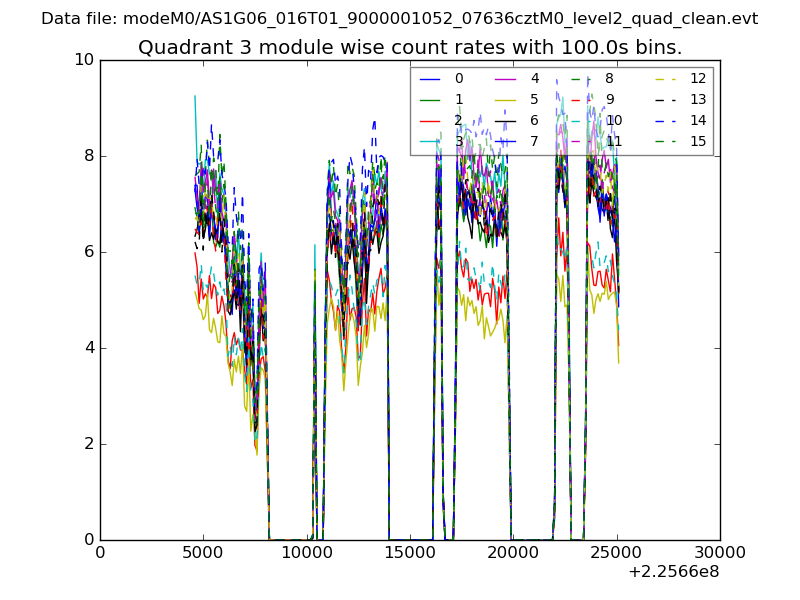
| Module-wise count rates for Quadrant C Data is divided into 100 sec bins |
 |
 |
| Module-wise count rates for Quadrant D Data is divided into 100 sec bins |
 |
 |
| Parameter | Plot |
|---|---|
| CZT HV Monitor | 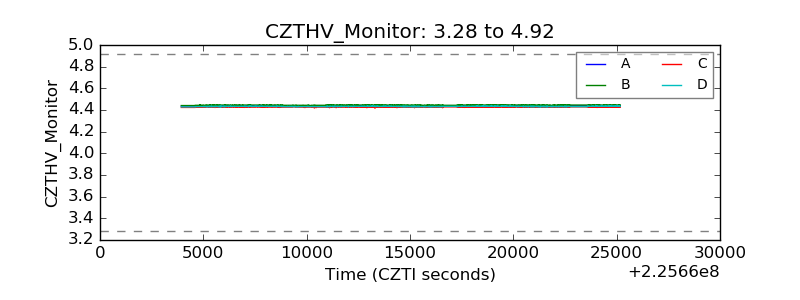 |
| D_VDD | 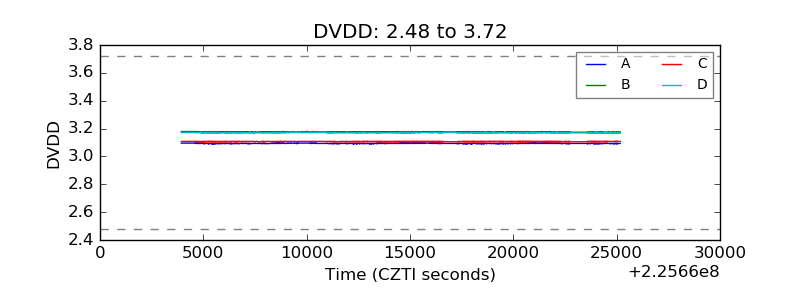 |
| Temperature 1 | 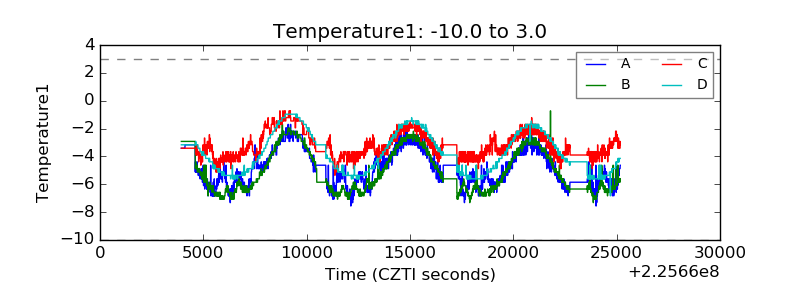 |
| Veto HV Monitor | 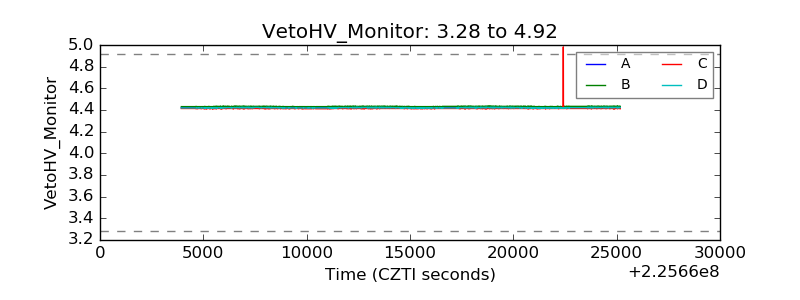 |
| Veto LLD | 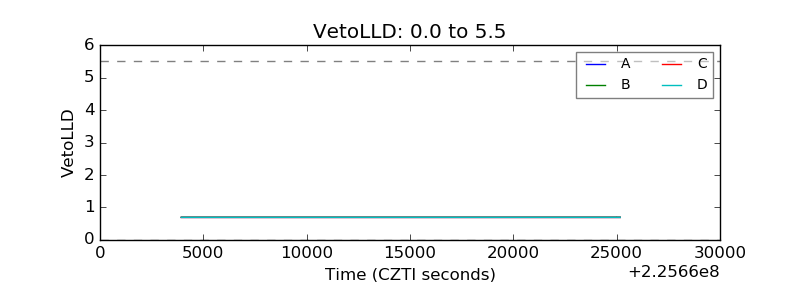 |
| Alpha Counter | 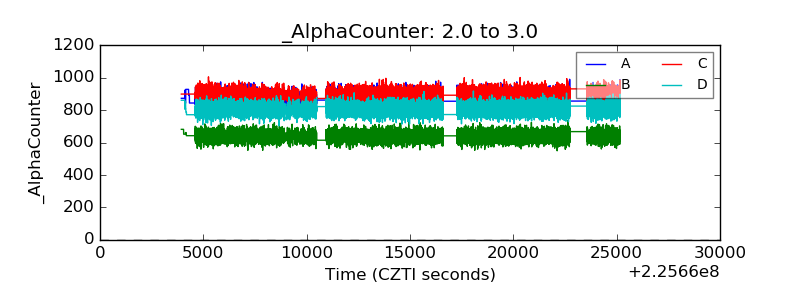 |
| _CPM_Rate | 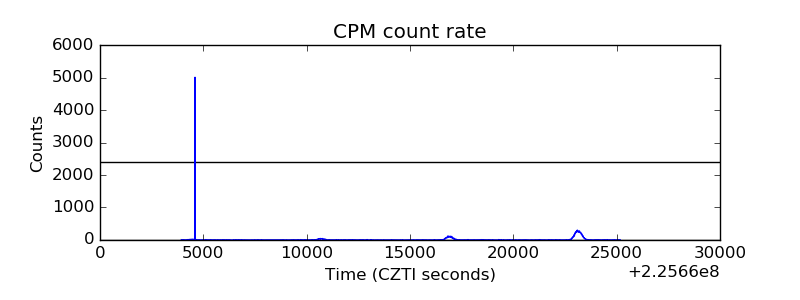 |
| CZT Counter | 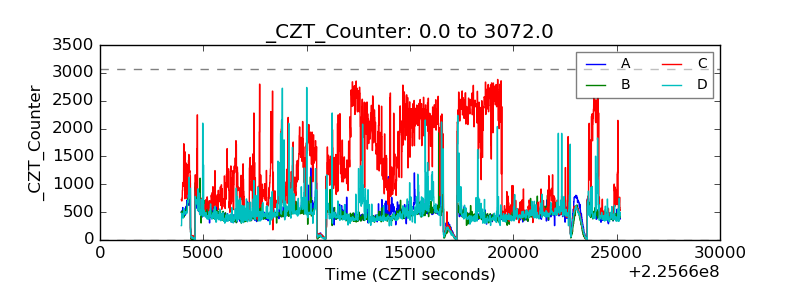 |
| +2.5 Volts monitor | 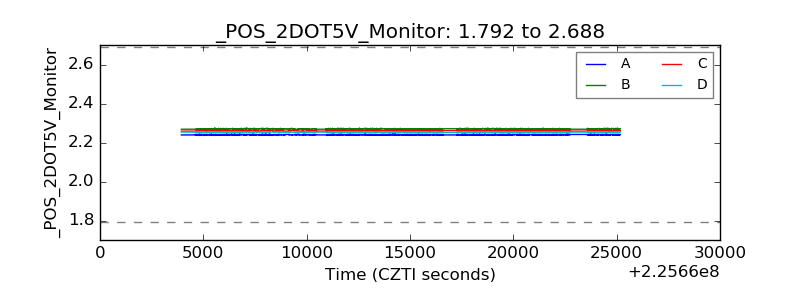 |
| +5 Volts monitor |  |
| _ROLL_ROT | 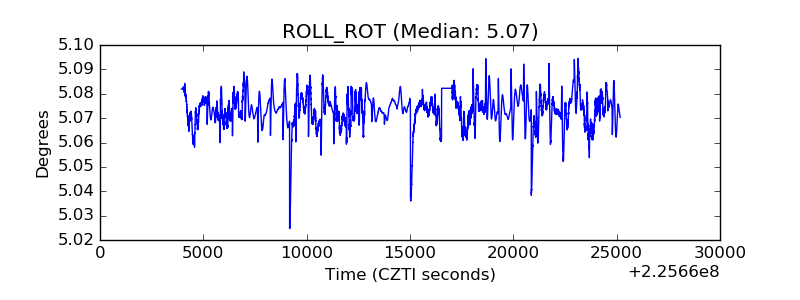 |
| _Roll_DEC | 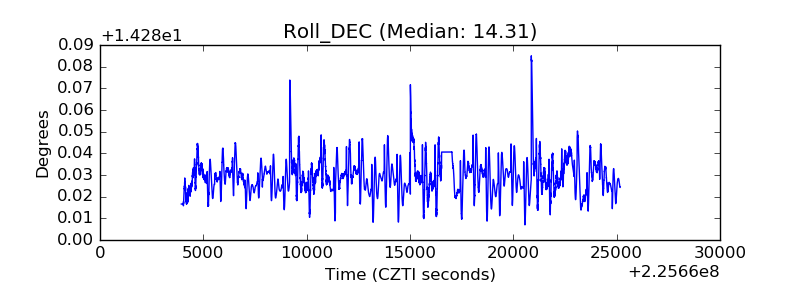 |
| _Roll_RA | 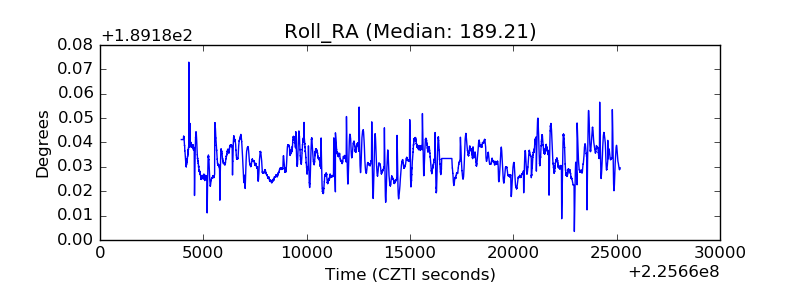 |
| Veto Counter | 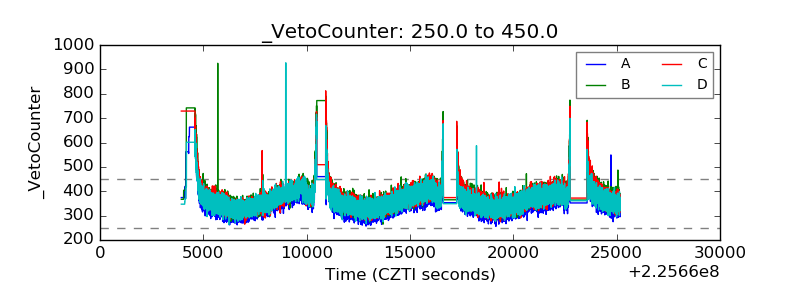 |