| Param | Original file | Final file |
|---|---|---|
| Filename | modeM0/AS1G06_016T01_9000001052_07639cztM0_level2.evt | modeM0/AS1G06_016T01_9000001052_07639cztM0_level2_quad_clean.evt |
| Size (bytes) | 642,438,720 | 86,662,080 |
| Size | 612.7 MB | 82.6 MB |
| Events in quadrant A | 3,986,888 | 549,268 |
| Events in quadrant B | 3,294,114 | 559,158 |
| Events in quadrant C | 8,038,980 | 505,557 |
| Events in quadrant D | 3,671,350 | 531,092 |
| Mode M0 | |||
|---|---|---|---|
| Quadrant | BADHDUFLAG | Total packets | Discarded packets |
| A | 0 | 16258 | 3 |
| B | 0 | 14115 | 2 |
| C | 0 | 28757 | 2 |
| D | 0 | 15400 | 2 |
| Mode M9 | |||
|---|---|---|---|
| Quadrant | BADHDUFLAG | Total packets | Discarded packets |
| A | 0 | 17 | 0 |
| B | 0 | 17 | 0 |
| C | 0 | 17 | 0 |
| D | 0 | 18 | 0 |
| Mode SS | |||
|---|---|---|---|
| Quadrant | BADHDUFLAG | Total packets | Discarded packets |
| A | 0 | 140 | 0 |
| B | 0 | 140 | 0 |
| C | 0 | 140 | 0 |
| D | 0 | 140 | 0 |
| Quadrant | Total seconds | Saturated seconds | Saturation percentage |
|---|---|---|---|
| A | 6872 | 243 | 3.536088% |
| B | 6872 | 61 | 0.887660% |
| C | 6872 | 830 | 12.077998% |
| D | 6872 | 123 | 1.789872% |
Noise dominated data is calculated using 1-second bins in cleaned event files. If a bin has >2000 counts, and if more than 50% of those come from <1% of pixels, then it is considered to be noise-dominated and hence unusable.
| Quadrant | # 1 sec bins | Bins with >0 counts | Bins with >2000 counts | High rate bins dominated by noise | Noise dominated (total time) | Noise dominated (detector-on time) | Marked lightcurve |
|---|---|---|---|---|---|---|---|
| A | 7982 | 6873 | 142 | 142 | 1.78% | 2.07% |  |
| B | 7982 | 6873 | 2 | 2 | 0.03% | 0.03% | 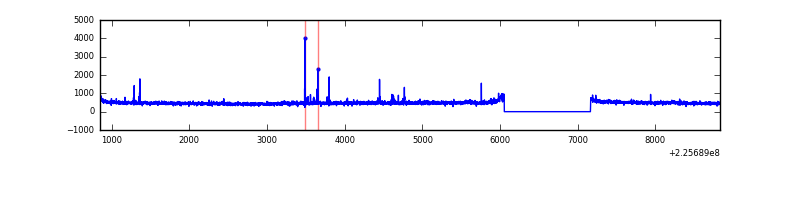 |
| C | 7982 | 6873 | 783 | 783 | 9.81% | 11.39% | 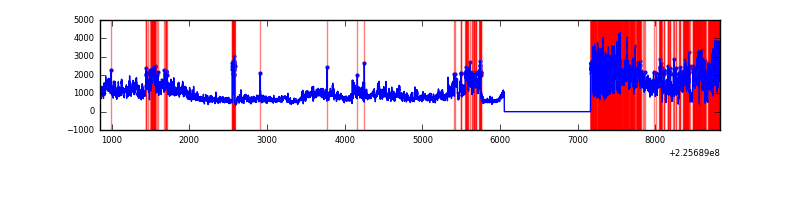 |
| D | 7982 | 6872 | 56 | 56 | 0.70% | 0.81% | 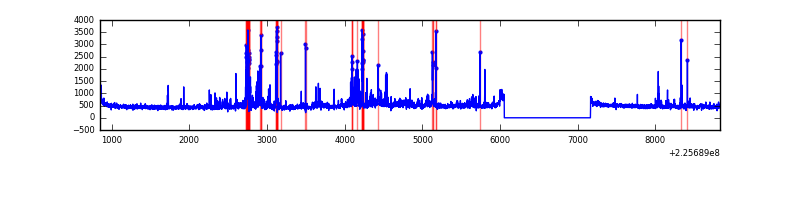 |
Top three noisy pixels from each quadrant. If the there are fewer than three noisy pixels in the level2.evt file, extra rows are filled as -1
| Pixel properties | Quadrant properties | ||||||
|---|---|---|---|---|---|---|---|
| Quadrant | DetID | PixID | Counts | Sigma | Mean | Median | Sigma |
| A | 0 | 128 | 795033 | 4736.89 | 826 | 807 | 167.7 |
| A | 0 | 226 | 7877 | 42.16 | 826 | 807 | 167.7 |
| A | 12 | 194 | 7442 | 39.57 | 826 | 807 | 167.7 |
| B | 4 | 81 | 25573 | 156.68 | 831 | 811 | 158.0 |
| B | 0 | 219 | 17579 | 106.1 | 831 | 811 | 158.0 |
| B | 12 | 111 | 17112 | 103.14 | 831 | 811 | 158.0 |
| C | 9 | 68 | 5034792 | 28363.9 | 769 | 773 | 177.5 |
| C | 13 | 61 | 5646 | 27.46 | 769 | 773 | 177.5 |
| C | 1 | 16 | 3109 | 13.16 | 769 | 773 | 177.5 |
| D | 2 | 152 | 229793 | 1159.83 | 804 | 776 | 197.5 |
| D | 14 | 34 | 190725 | 961.97 | 804 | 776 | 197.5 |
| D | 2 | 14 | 71154 | 356.42 | 804 | 776 | 197.5 |
Histogram calculated using DETX and DETY for each event in the final _common_clean file
| Quadrant A |  |
 |
Quadrant B |
|---|---|---|---|
| Quadrant D | 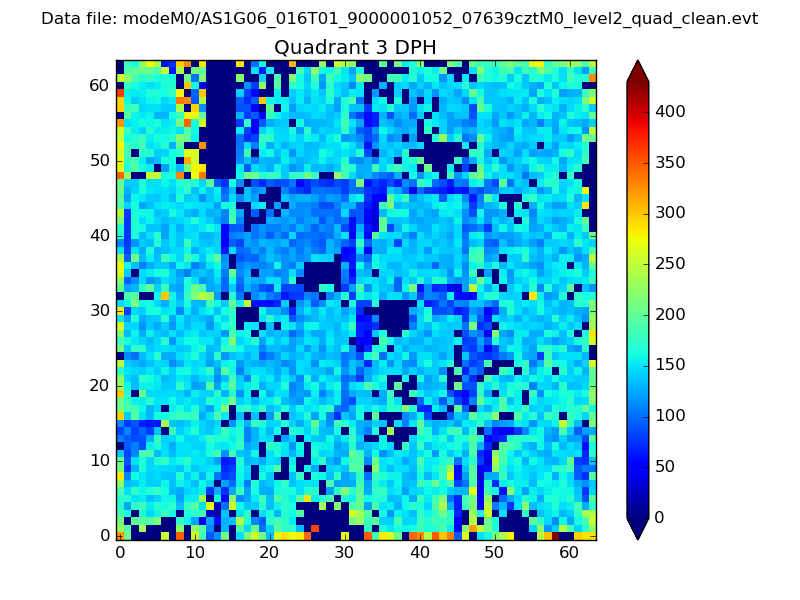 |
 |
Quadrant C |
| Plot type | Count rate plots | Images |
|---|---|---|
| Comparison with Poisson distribution Blue bars denote a histogram of data divided into 1 sec bins. Red curve is a Poisson curve with rate = median count rate of data. |
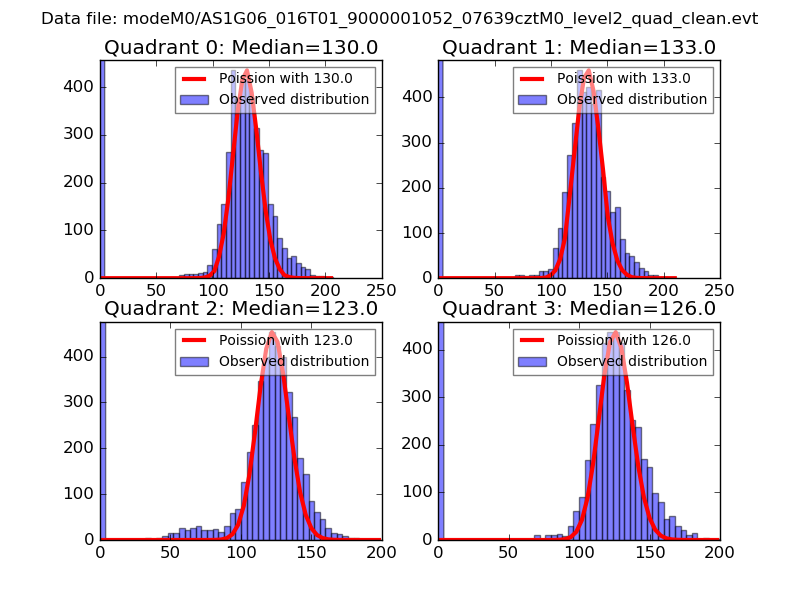 |
 |
| Quadrant-wise count rates Data is divided into 100 sec bins |
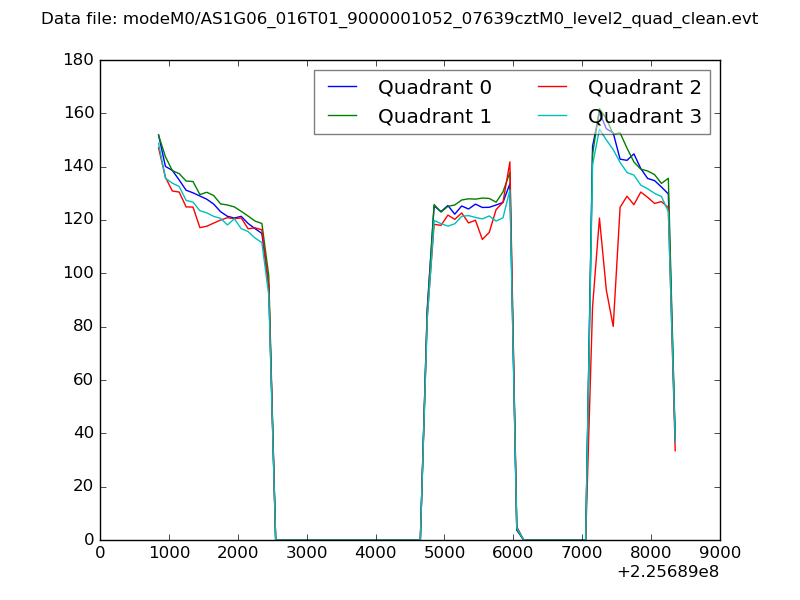 |
|
| Module-wise count rates for Quadrant A Data is divided into 100 sec bins |
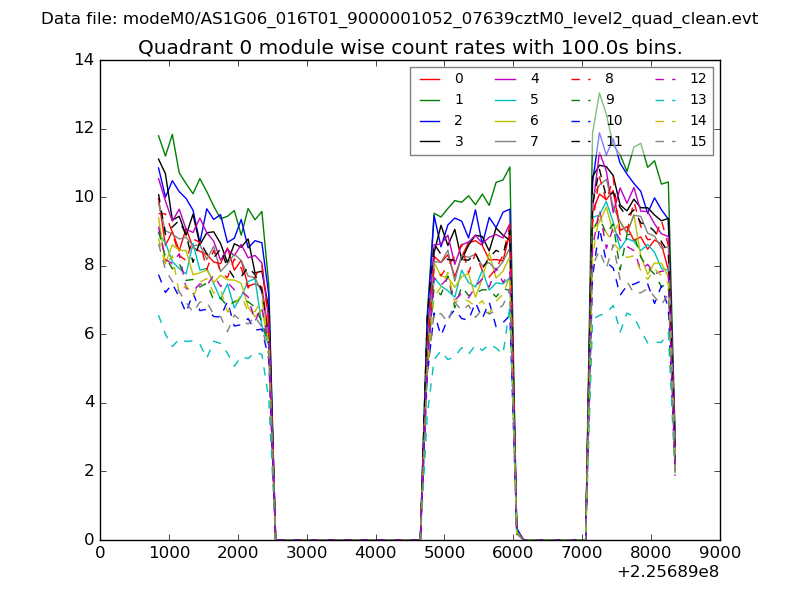 |
 |
| Module-wise count rates for Quadrant B Data is divided into 100 sec bins |
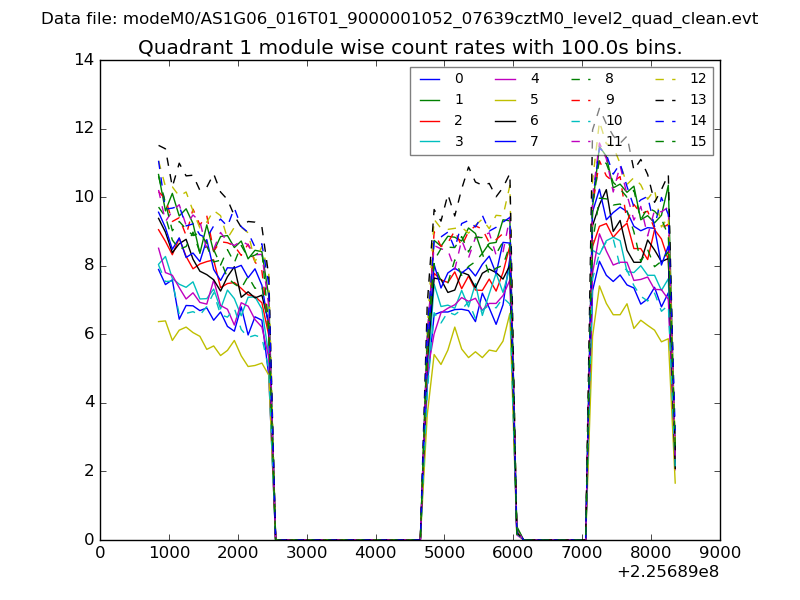 |
 |
| Module-wise count rates for Quadrant C Data is divided into 100 sec bins |
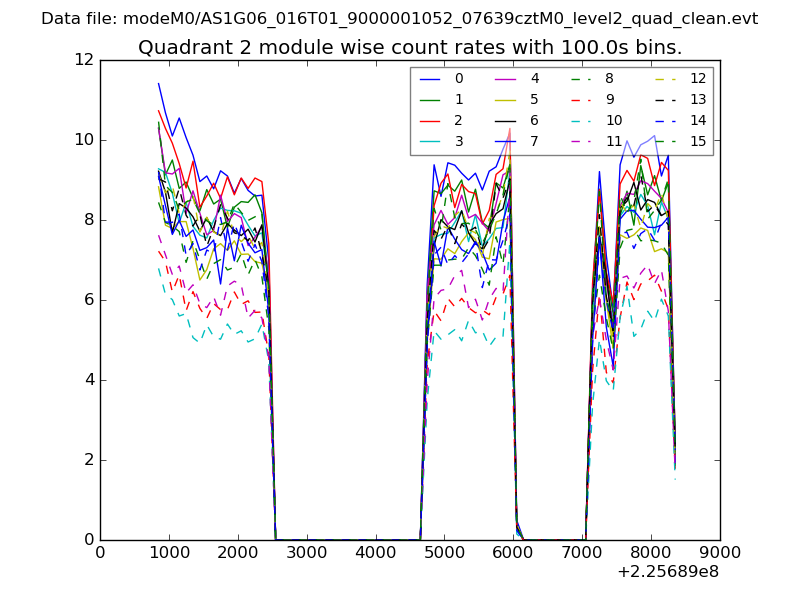 |
 |
| Module-wise count rates for Quadrant D Data is divided into 100 sec bins |
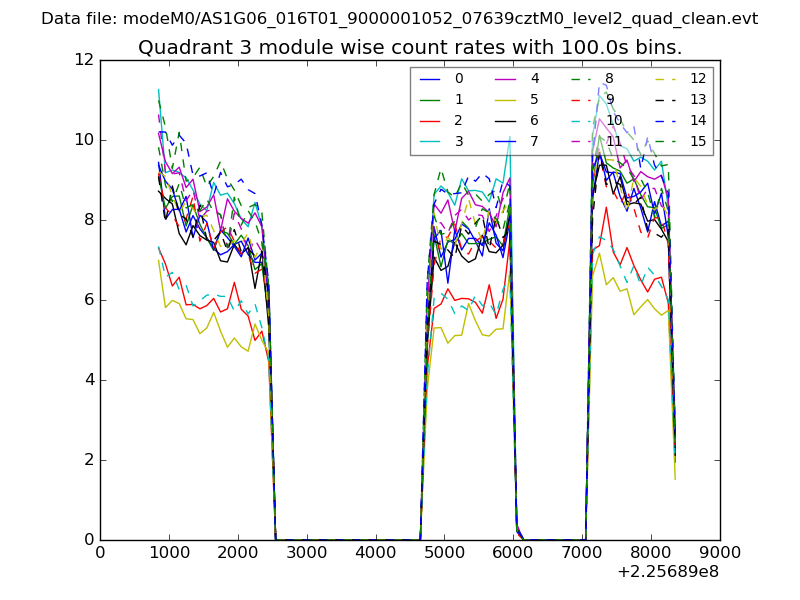 |
 |
| Parameter | Plot |
|---|---|
| CZT HV Monitor | 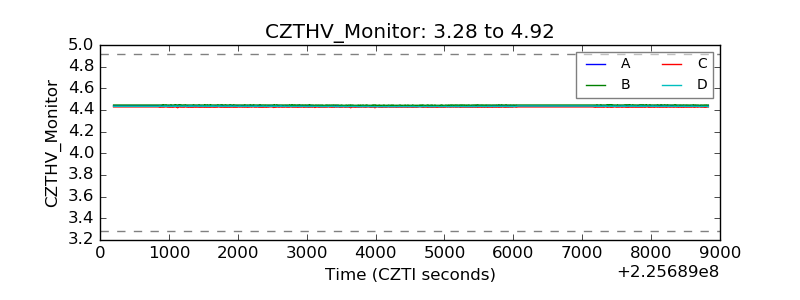 |
| D_VDD | 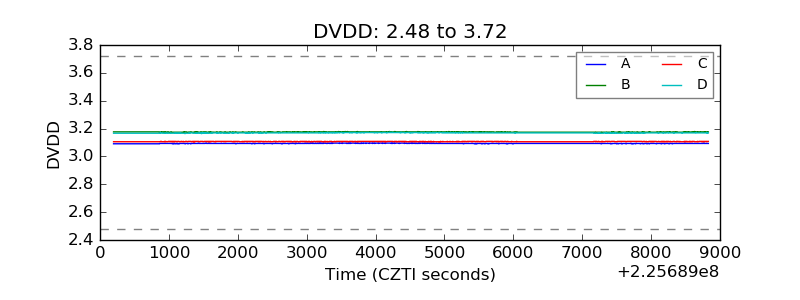 |
| Temperature 1 | 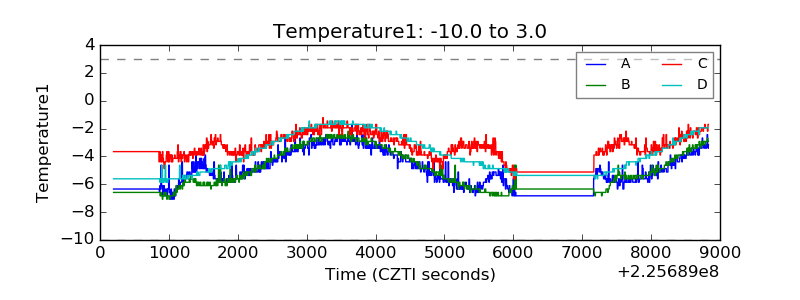 |
| Veto HV Monitor | 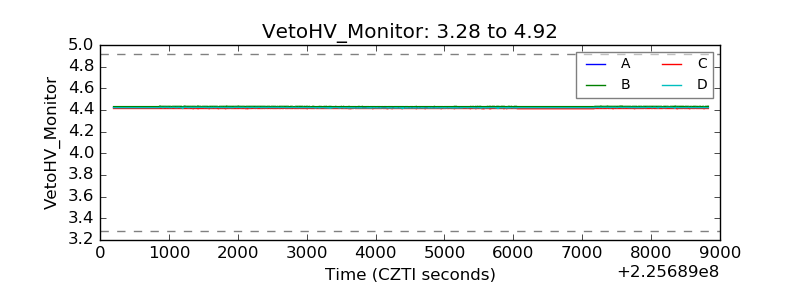 |
| Veto LLD | 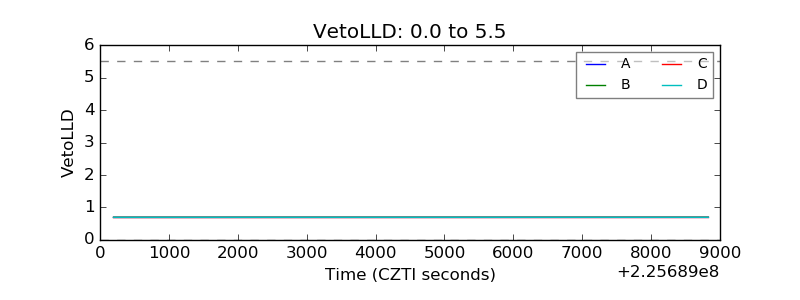 |
| Alpha Counter | 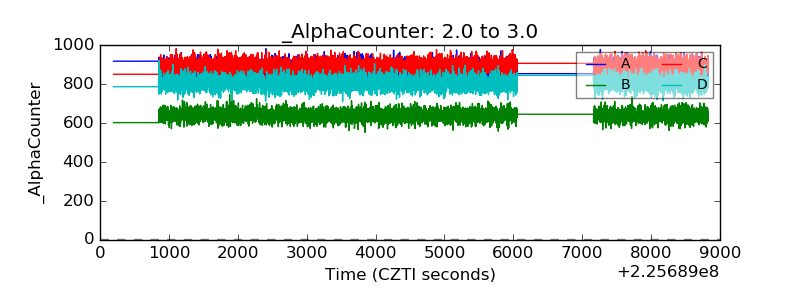 |
| _CPM_Rate | 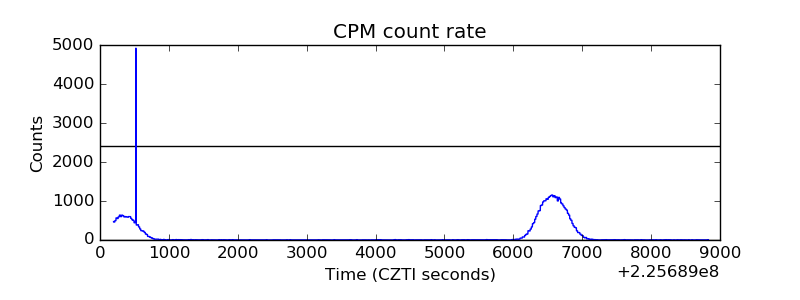 |
| CZT Counter |  |
| +2.5 Volts monitor |  |
| +5 Volts monitor | 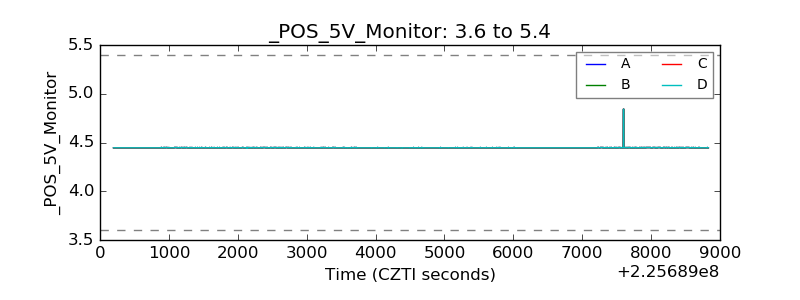 |
| _ROLL_ROT | 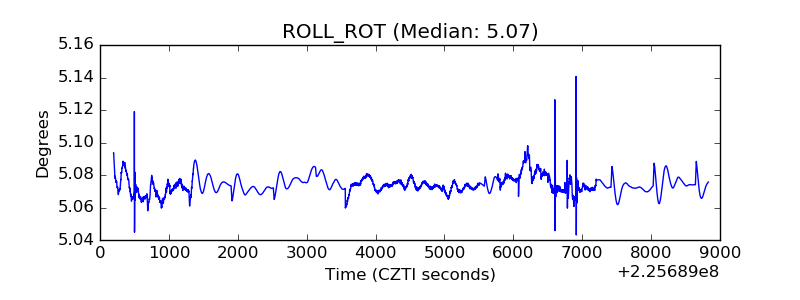 |
| _Roll_DEC | 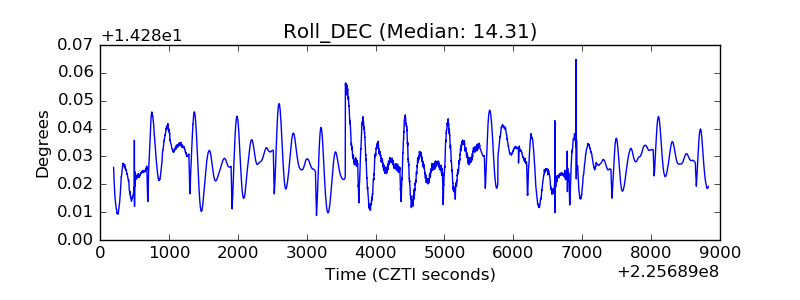 |
| _Roll_RA | 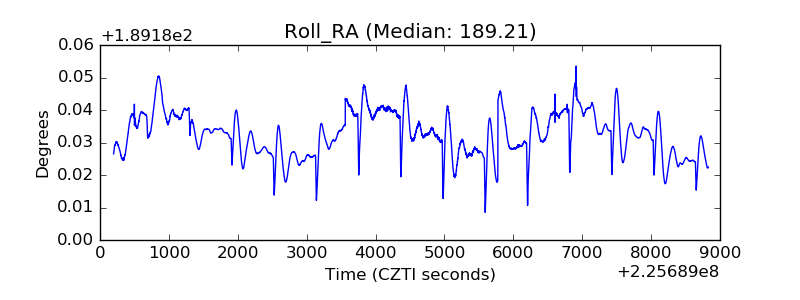 |
| Veto Counter | 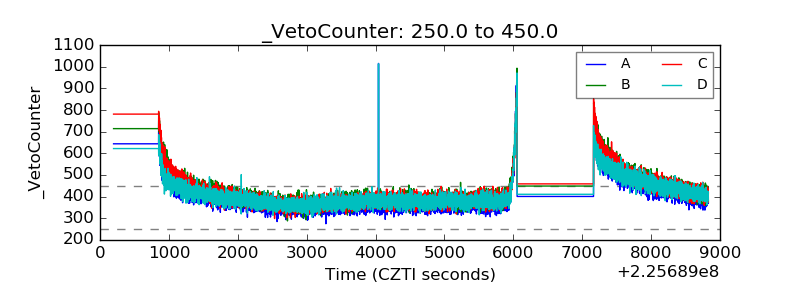 |