| Param | Original file | Final file |
|---|---|---|
| Filename | modeM0/AS1G06_016T01_9000001052_07641cztM0_level2.evt | modeM0/AS1G06_016T01_9000001052_07641cztM0_level2_quad_clean.evt |
| Size (bytes) | 665,251,200 | 65,090,880 |
| Size | 634.4 MB | 62.1 MB |
| Events in quadrant A | 3,258,972 | 419,110 |
| Events in quadrant B | 3,324,784 | 420,541 |
| Events in quadrant C | 9,415,939 | 284,031 |
| Events in quadrant D | 3,715,645 | 400,957 |
| Mode M0 | |||
|---|---|---|---|
| Quadrant | BADHDUFLAG | Total packets | Discarded packets |
| A | 0 | 13422 | 2 |
| B | 0 | 13592 | 1 |
| C | 0 | 32446 | 1 |
| D | 0 | 14859 | 1 |
| Mode M9 | |||
|---|---|---|---|
| Quadrant | BADHDUFLAG | Total packets | Discarded packets |
| A | 0 | 13 | 0 |
| B | 0 | 13 | 0 |
| C | 0 | 13 | 0 |
| D | 0 | 13 | 0 |
| Mode SS | |||
|---|---|---|---|
| Quadrant | BADHDUFLAG | Total packets | Discarded packets |
| A | 0 | 130 | 0 |
| B | 0 | 130 | 0 |
| C | 0 | 130 | 0 |
| D | 0 | 130 | 0 |
| Quadrant | Total seconds | Saturated seconds | Saturation percentage |
|---|---|---|---|
| A | 6379 | 46 | 0.721116% |
| B | 6379 | 47 | 0.736793% |
| C | 6379 | 2329 | 36.510425% |
| D | 6379 | 105 | 1.646026% |
Noise dominated data is calculated using 1-second bins in cleaned event files. If a bin has >2000 counts, and if more than 50% of those come from <1% of pixels, then it is considered to be noise-dominated and hence unusable.
| Quadrant | # 1 sec bins | Bins with >0 counts | Bins with >2000 counts | High rate bins dominated by noise | Noise dominated (total time) | Noise dominated (detector-on time) | Marked lightcurve |
|---|---|---|---|---|---|---|---|
| A | 7684 | 6380 | 0 | 0 | 0.00% | 0.00% | 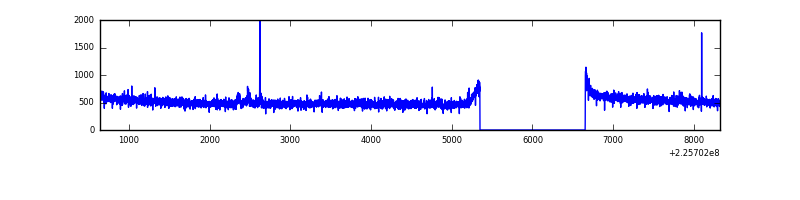 |
| B | 7684 | 6380 | 2 | 2 | 0.03% | 0.03% | 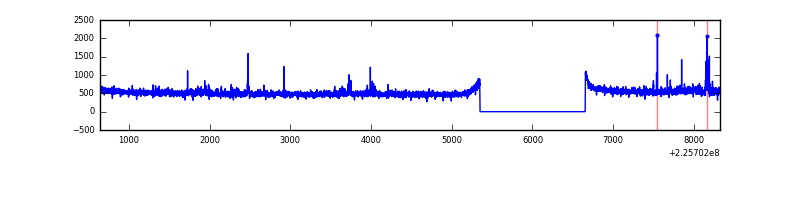 |
| C | 7684 | 6379 | 2130 | 2130 | 27.72% | 33.39% | 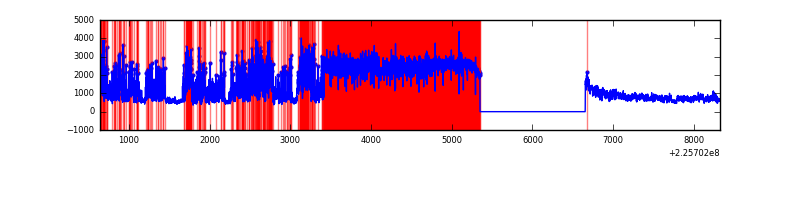 |
| D | 7684 | 6380 | 61 | 61 | 0.79% | 0.96% | 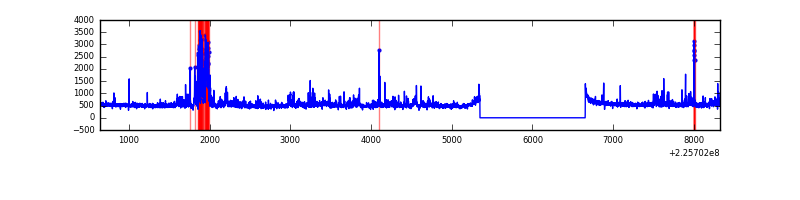 |
Top three noisy pixels from each quadrant. If the there are fewer than three noisy pixels in the level2.evt file, extra rows are filled as -1
| Pixel properties | Quadrant properties | ||||||
|---|---|---|---|---|---|---|---|
| Quadrant | DetID | PixID | Counts | Sigma | Mean | Median | Sigma |
| A | 0 | 128 | 15936 | 90.46 | 839 | 823 | 167.1 |
| A | 0 | 226 | 8132 | 43.75 | 839 | 823 | 167.1 |
| A | 12 | 194 | 7334 | 38.97 | 839 | 823 | 167.1 |
| B | 0 | 214 | 35475 | 222.25 | 830 | 812 | 156.0 |
| B | 0 | 219 | 29395 | 183.26 | 830 | 812 | 156.0 |
| B | 0 | 213 | 20210 | 124.37 | 830 | 812 | 156.0 |
| C | 9 | 68 | 6209053 | 39504.36 | 691 | 695 | 157.2 |
| C | 1 | 16 | 512674 | 3257.77 | 691 | 695 | 157.2 |
| C | 13 | 61 | 5161 | 28.42 | 691 | 695 | 157.2 |
| D | 2 | 152 | 499768 | 2514.34 | 811 | 787 | 198.5 |
| D | 14 | 34 | 61229 | 304.56 | 811 | 787 | 198.5 |
| D | 5 | 233 | 46033 | 227.99 | 811 | 787 | 198.5 |
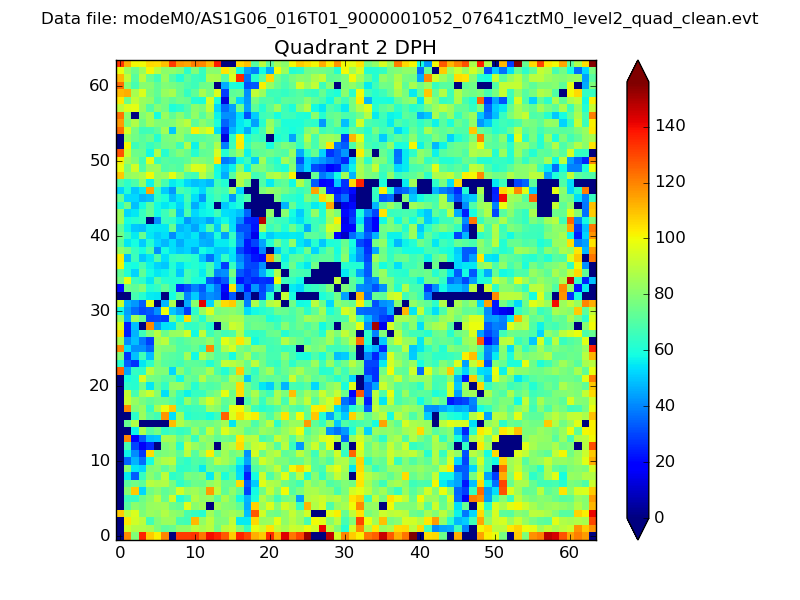
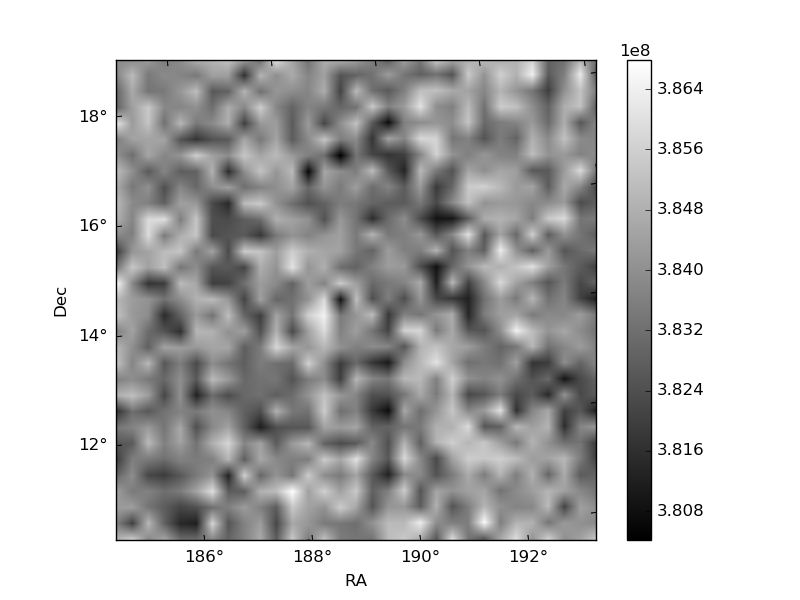
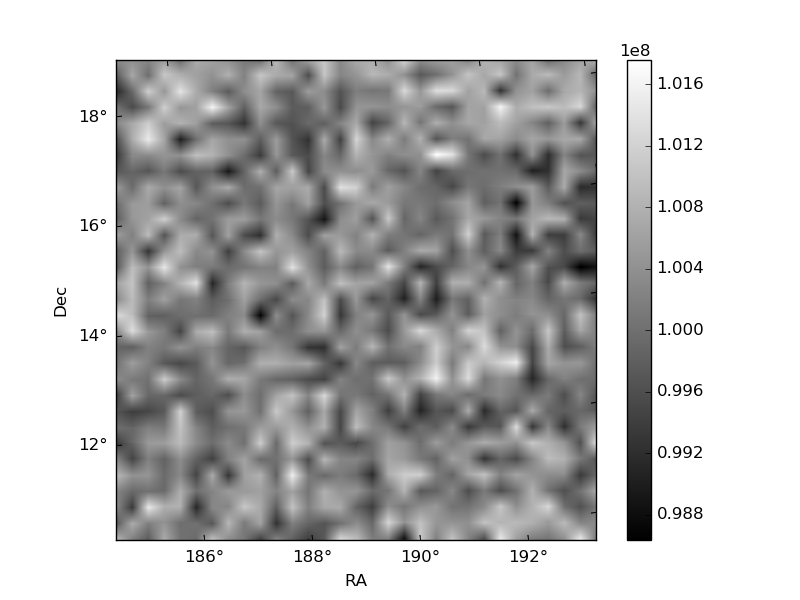
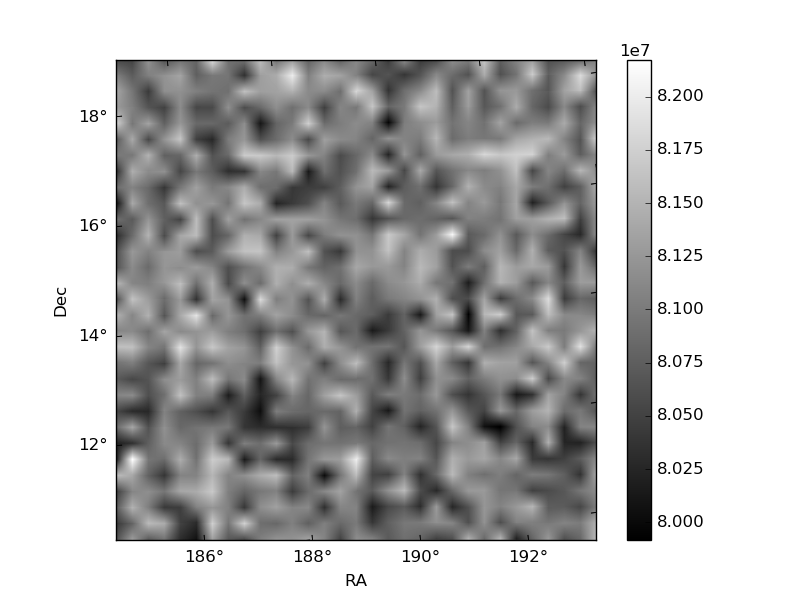
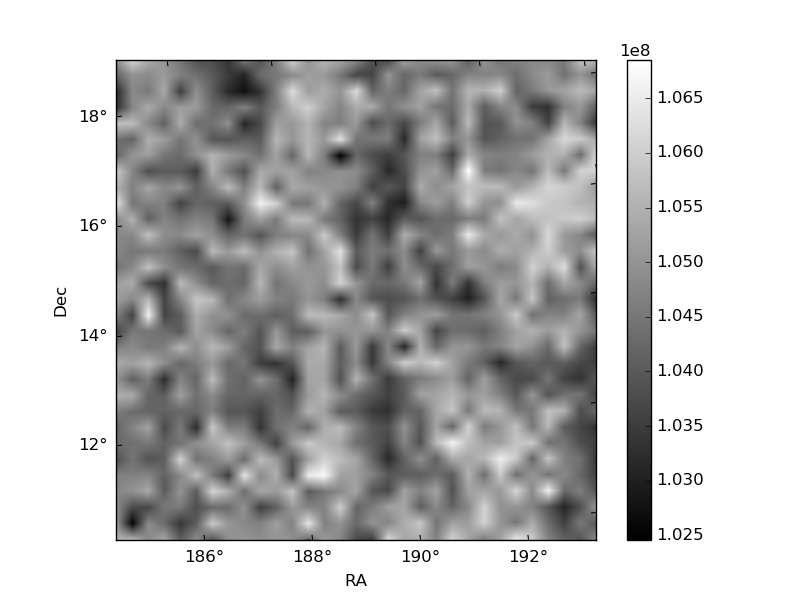
Histogram calculated using DETX and DETY for each event in the final _common_clean file
| Quadrant A | 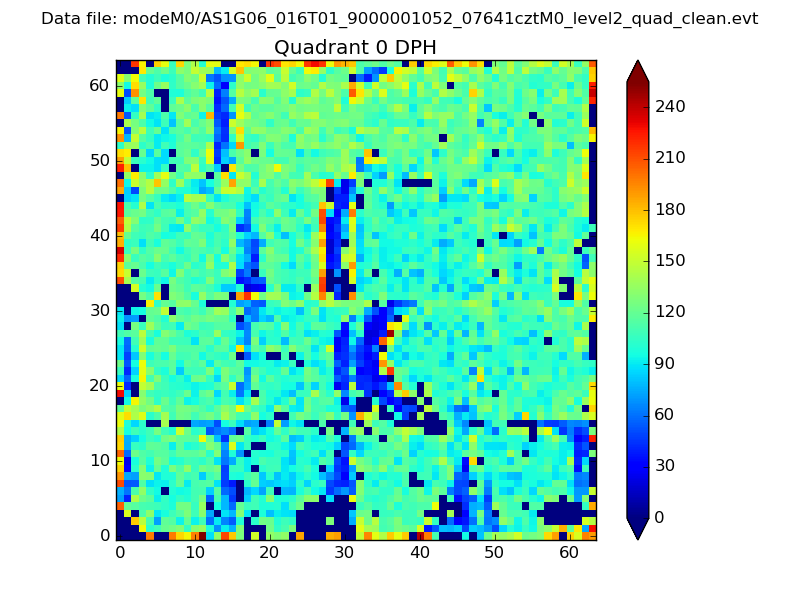 |
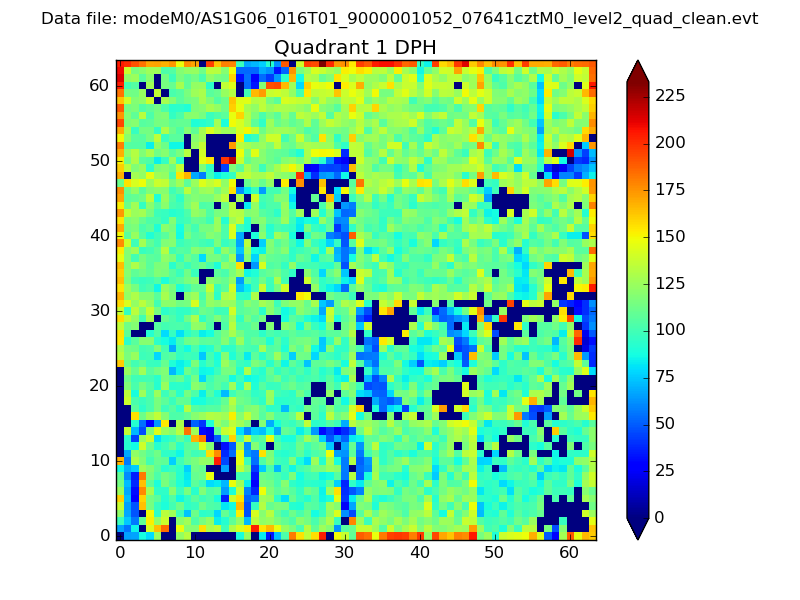 |
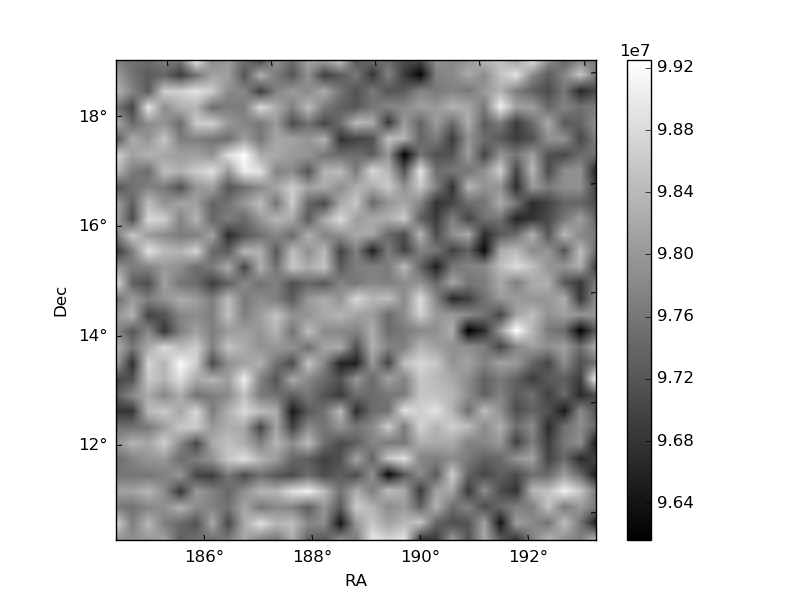
Quadrant B |
|---|---|---|---|
| Quadrant D | 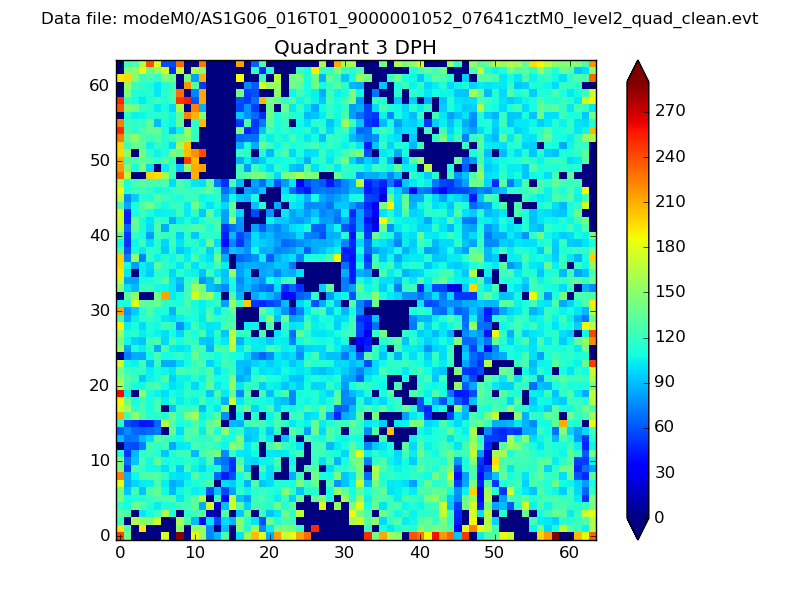 |
 |
Quadrant C |
| Plot type | Count rate plots | Images |
|---|---|---|
| Comparison with Poisson distribution Blue bars denote a histogram of data divided into 1 sec bins. Red curve is a Poisson curve with rate = median count rate of data. |
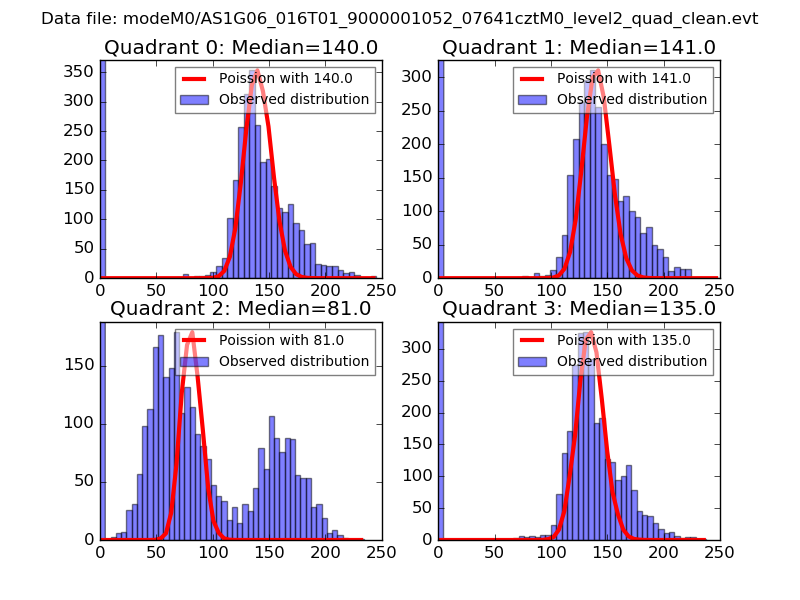 |
 |
| Quadrant-wise count rates Data is divided into 100 sec bins |
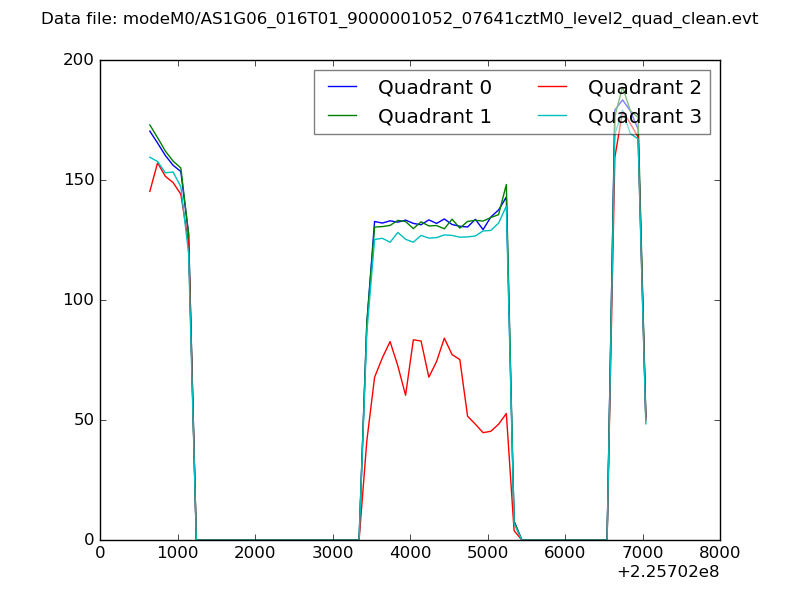 |
|
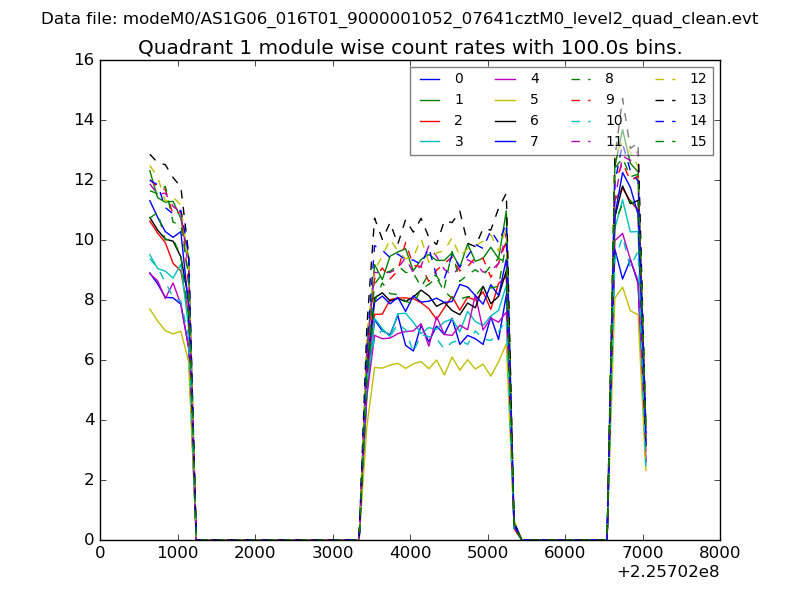
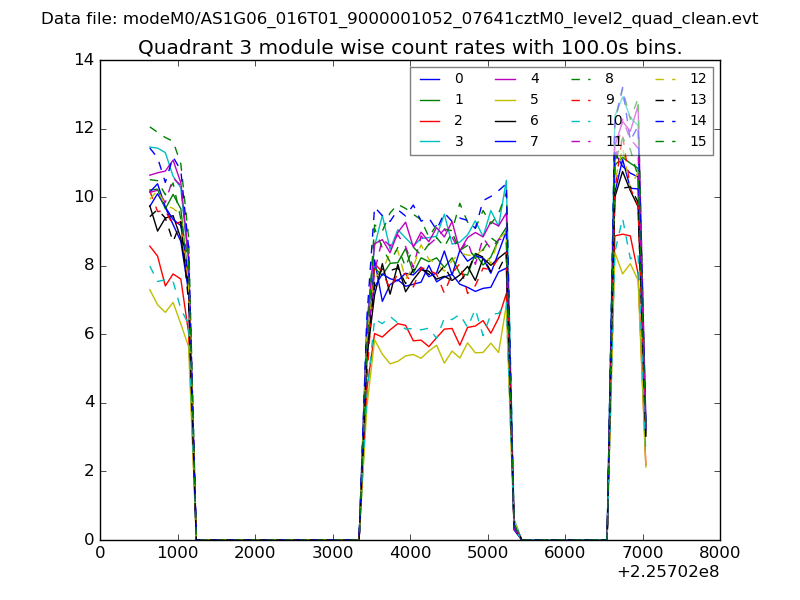
| Module-wise count rates for Quadrant A Data is divided into 100 sec bins |
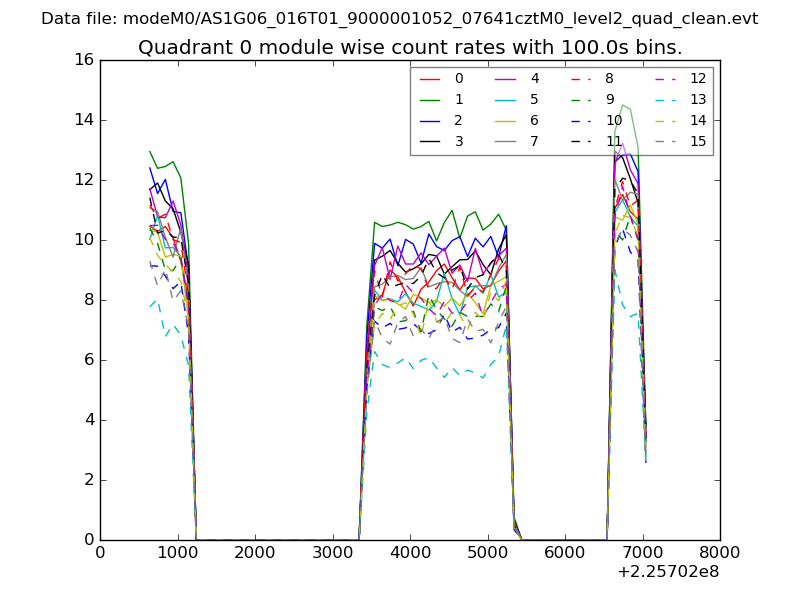 |
 |
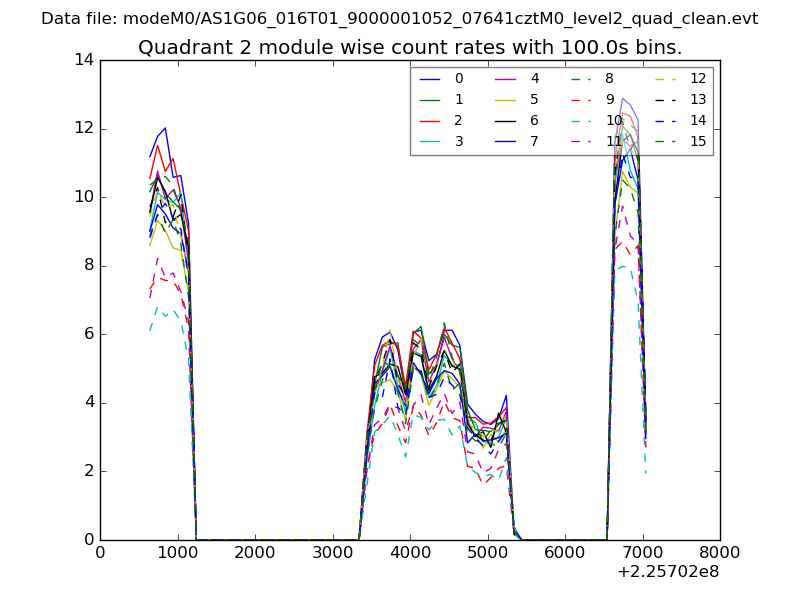
| Module-wise count rates for Quadrant B Data is divided into 100 sec bins |
 |
 |
| Module-wise count rates for Quadrant C Data is divided into 100 sec bins |
 |
 |
| Module-wise count rates for Quadrant D Data is divided into 100 sec bins |
 |
 |
| Parameter | Plot |
|---|---|
| CZT HV Monitor | 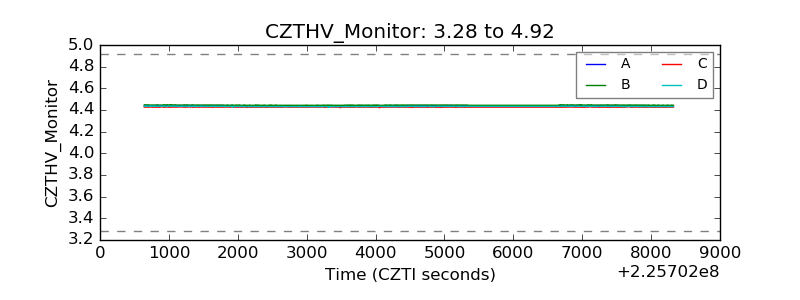 |
| D_VDD | 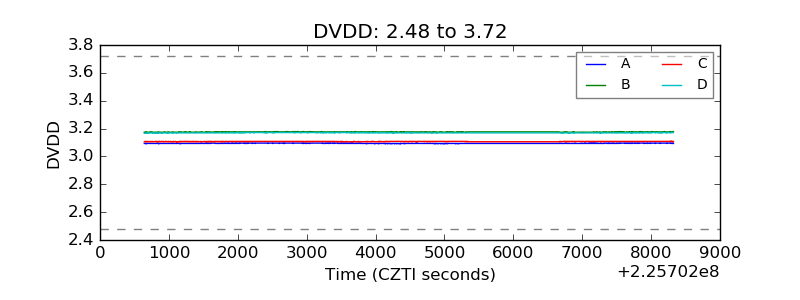 |
| Temperature 1 | 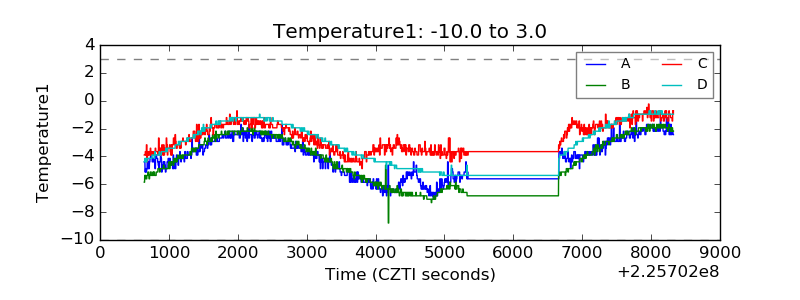 |
| Veto HV Monitor |  |
| Veto LLD | 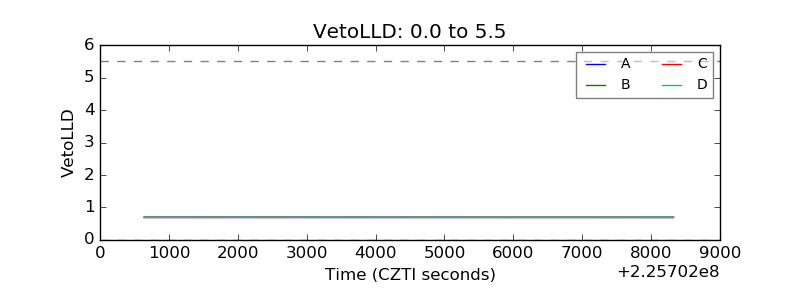 |
| Alpha Counter | 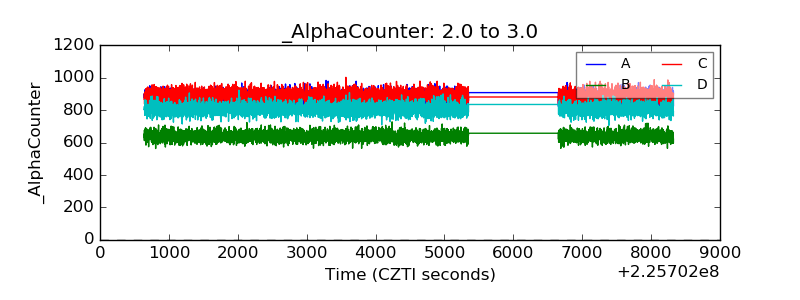 |
| _CPM_Rate | 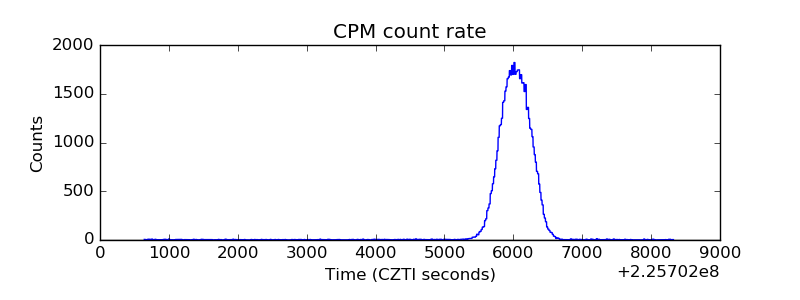 |
| CZT Counter | 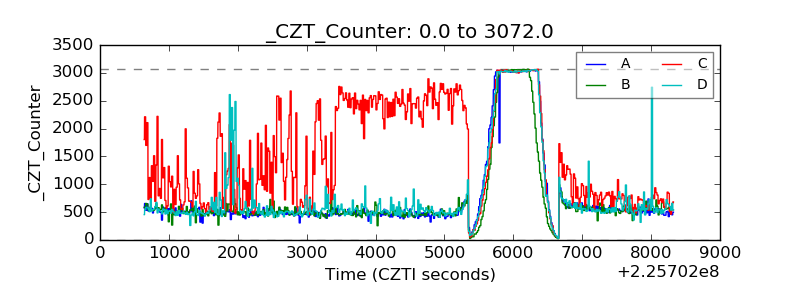 |
| +2.5 Volts monitor |  |
| +5 Volts monitor |  |
| _ROLL_ROT | 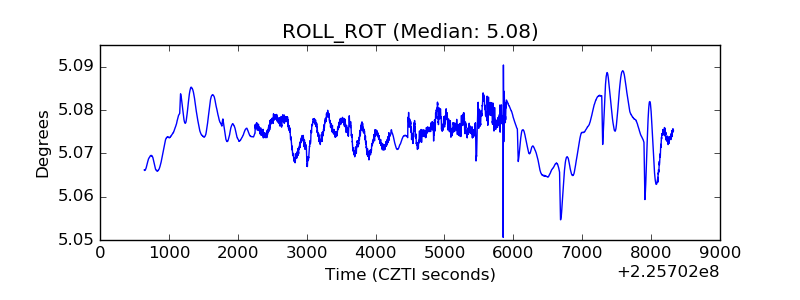 |
| _Roll_DEC | 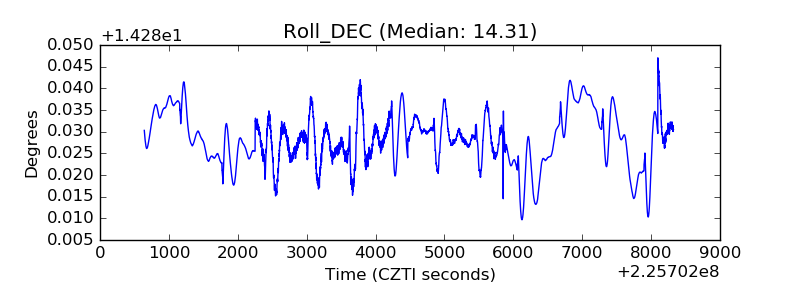 |
| _Roll_RA | 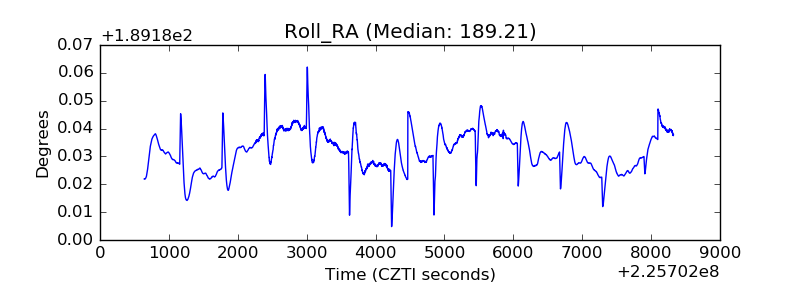 |
| Veto Counter | 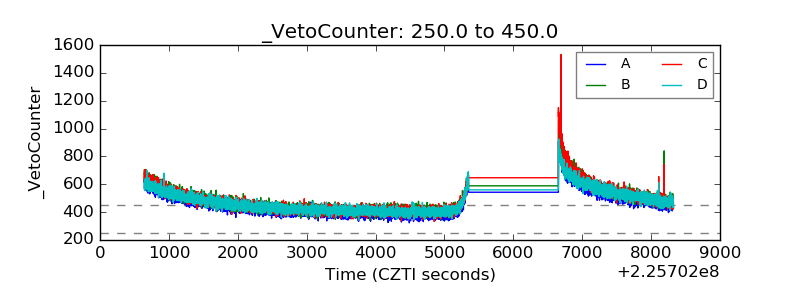 |