| Param | Original file | Final file |
|---|---|---|
| Filename | modeM0/AS1G06_016T01_9000001052_07642cztM0_level2.evt | modeM0/AS1G06_016T01_9000001052_07642cztM0_level2_quad_clean.evt |
| Size (bytes) | 381,237,120 | 61,836,480 |
| Size | 363.6 MB | 59.0 MB |
| Events in quadrant A | 2,548,289 | 384,534 |
| Events in quadrant B | 2,646,825 | 387,715 |
| Events in quadrant C | 3,131,254 | 381,187 |
| Events in quadrant D | 2,880,763 | 369,805 |
| Mode M0 | |||
|---|---|---|---|
| Quadrant | BADHDUFLAG | Total packets | Discarded packets |
| A | 0 | 10592 | 1 |
| B | 0 | 10810 | 1 |
| C | 0 | 12414 | 1 |
| D | 0 | 11687 | 1 |
| Mode M9 | |||
|---|---|---|---|
| Quadrant | BADHDUFLAG | Total packets | Discarded packets |
| A | 0 | 1 | 0 |
| B | 0 | 1 | 0 |
| C | 0 | 1 | 0 |
| D | 0 | 1 | 0 |
| Mode SS | |||
|---|---|---|---|
| Quadrant | BADHDUFLAG | Total packets | Discarded packets |
| A | 0 | 102 | 0 |
| B | 0 | 102 | 0 |
| C | 0 | 102 | 0 |
| D | 0 | 102 | 0 |
| Quadrant | Total seconds | Saturated seconds | Saturation percentage |
|---|---|---|---|
| A | 4974 | 131 | 2.633695% |
| B | 4974 | 137 | 2.754322% |
| C | 4974 | 136 | 2.734218% |
| D | 4975 | 144 | 2.894472% |
Noise dominated data is calculated using 1-second bins in cleaned event files. If a bin has >2000 counts, and if more than 50% of those come from <1% of pixels, then it is considered to be noise-dominated and hence unusable.
| Quadrant | # 1 sec bins | Bins with >0 counts | Bins with >2000 counts | High rate bins dominated by noise | Noise dominated (total time) | Noise dominated (detector-on time) | Marked lightcurve |
|---|---|---|---|---|---|---|---|
| A | 4973 | 4973 | 0 | 0 | 0.00% | 0.00% | 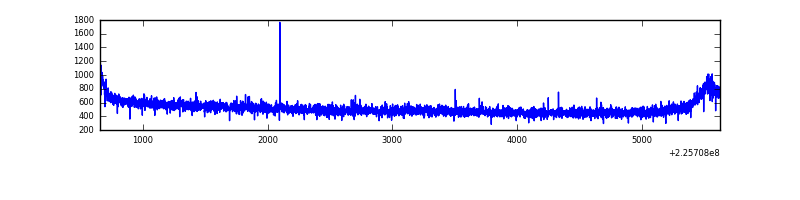 |
| B | 4973 | 4973 | 2 | 2 | 0.04% | 0.04% | 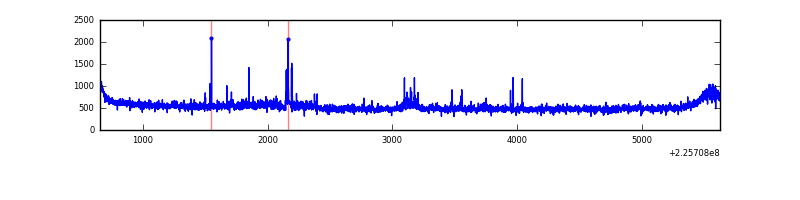 |
| C | 4973 | 4973 | 1 | 1 | 0.02% | 0.02% | 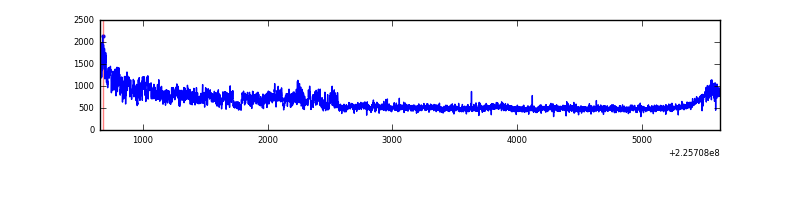 |
| D | 4974 | 4974 | 21 | 21 | 0.42% | 0.42% | 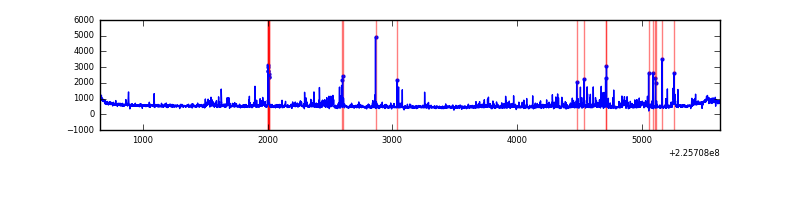 |
Top three noisy pixels from each quadrant. If the there are fewer than three noisy pixels in the level2.evt file, extra rows are filled as -1
| Pixel properties | Quadrant properties | ||||||
|---|---|---|---|---|---|---|---|
| Quadrant | DetID | PixID | Counts | Sigma | Mean | Median | Sigma |
| A | 15 | 63 | 7043 | 48.28 | 658 | 645 | 132.5 |
| A | 0 | 226 | 6368 | 43.18 | 658 | 645 | 132.5 |
| A | 12 | 194 | 5699 | 38.14 | 658 | 645 | 132.5 |
| B | 0 | 219 | 41656 | 329.59 | 654 | 641 | 124.4 |
| B | 0 | 214 | 21085 | 164.29 | 654 | 641 | 124.4 |
| B | 12 | 111 | 12520 | 95.46 | 654 | 641 | 124.4 |
| C | 1 | 16 | 572307 | 3902.22 | 636 | 641 | 146.5 |
| C | 9 | 68 | 74623 | 505.0 | 636 | 641 | 146.5 |
| C | 13 | 61 | 4956 | 29.45 | 636 | 641 | 146.5 |
| D | 2 | 152 | 230518 | 1459.97 | 641 | 619 | 157.5 |
| D | 14 | 34 | 87858 | 554.01 | 641 | 619 | 157.5 |
| D | 2 | 14 | 64544 | 405.95 | 641 | 619 | 157.5 |
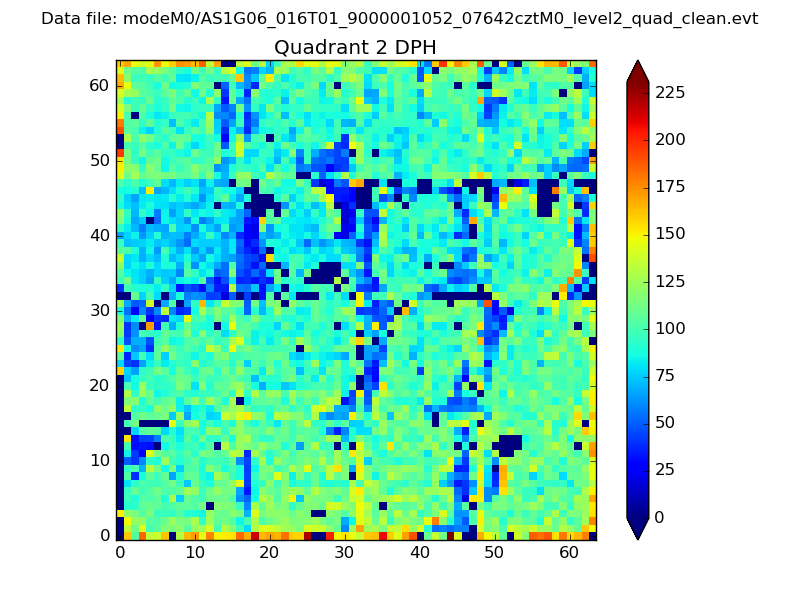
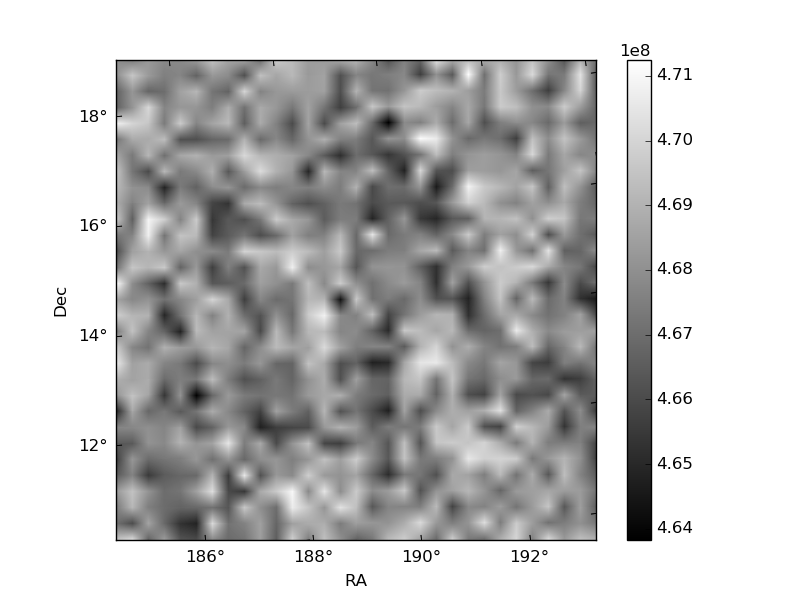
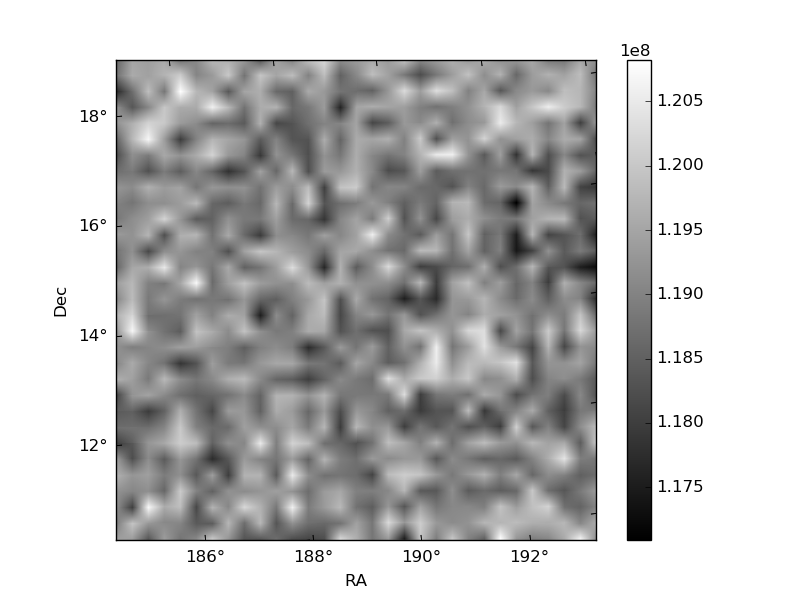
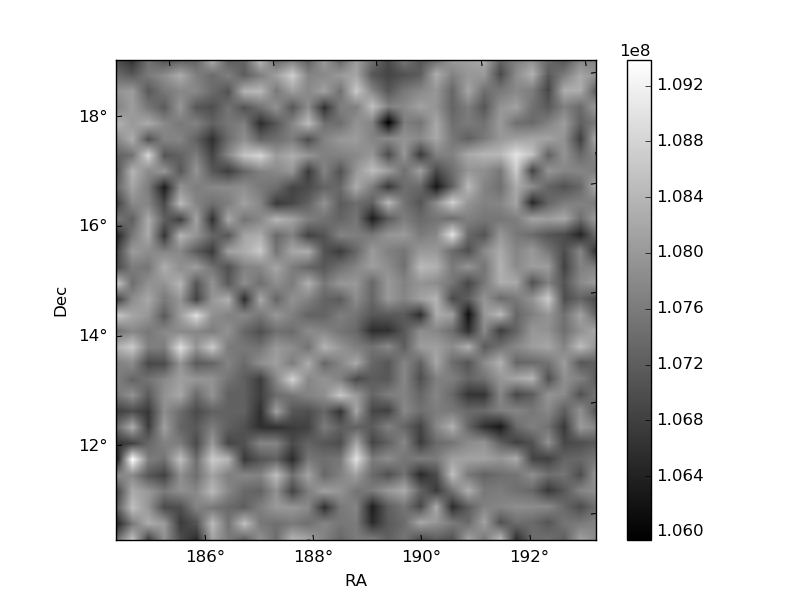
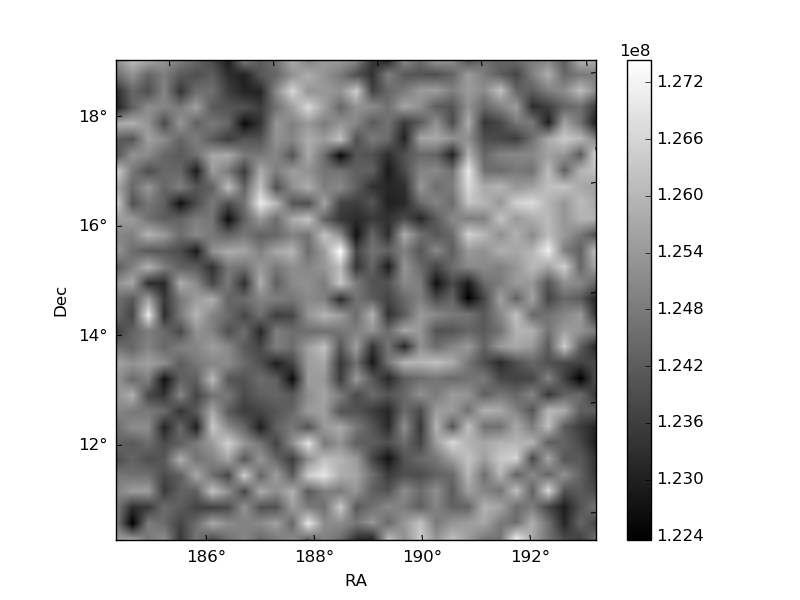
Histogram calculated using DETX and DETY for each event in the final _common_clean file
| Quadrant A | 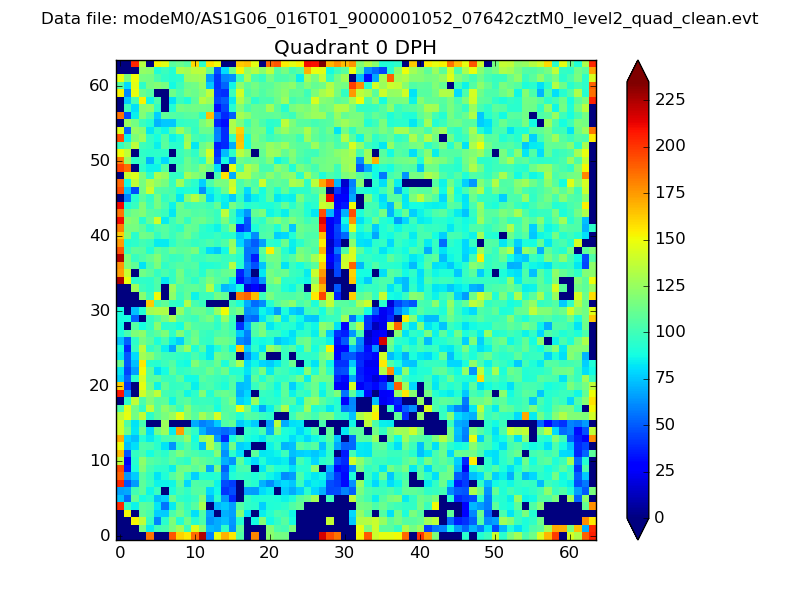 |
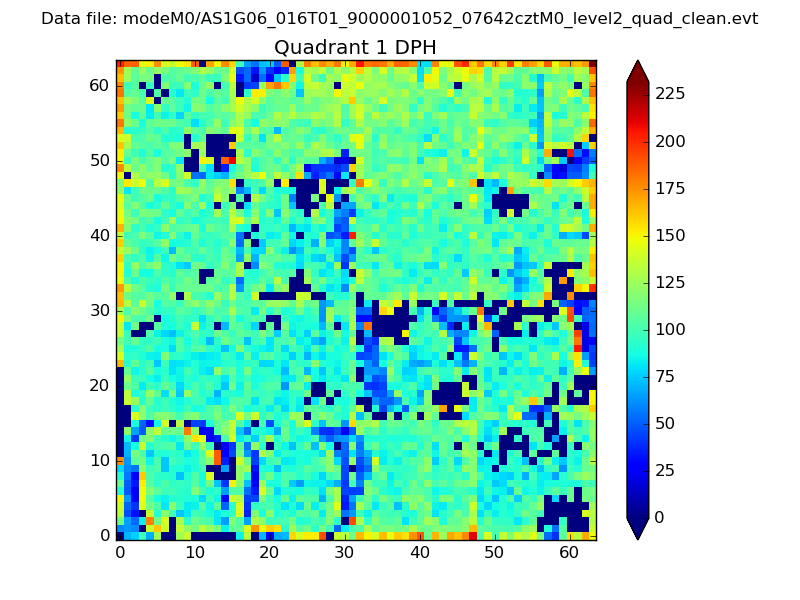 |
Quadrant B |
|---|---|---|---|
| Quadrant D | 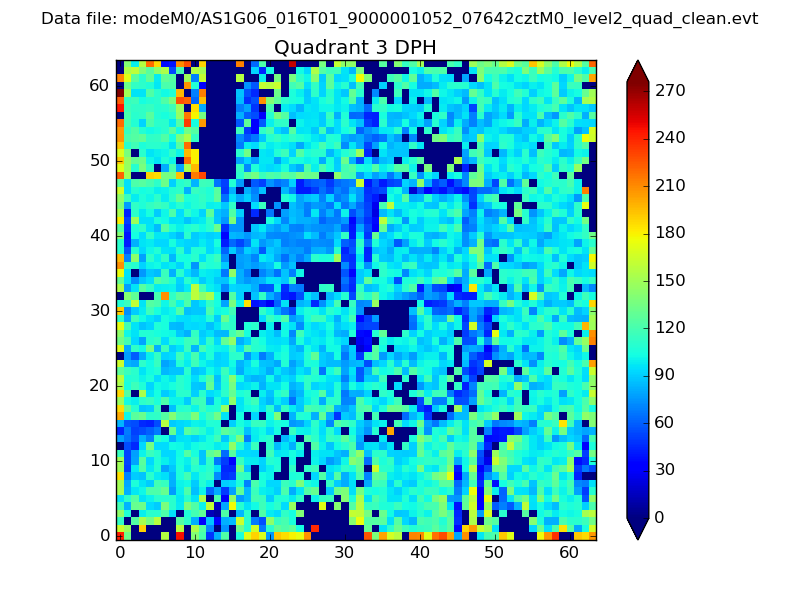 |
 |
Quadrant C |
| Plot type | Count rate plots | Images |
|---|---|---|
| Comparison with Poisson distribution Blue bars denote a histogram of data divided into 1 sec bins. Red curve is a Poisson curve with rate = median count rate of data. |
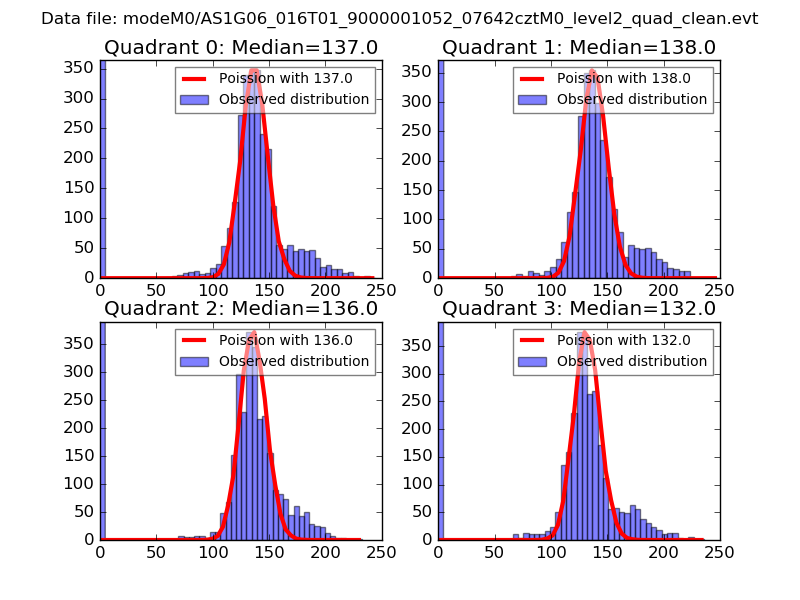 |
 |
| Quadrant-wise count rates Data is divided into 100 sec bins |
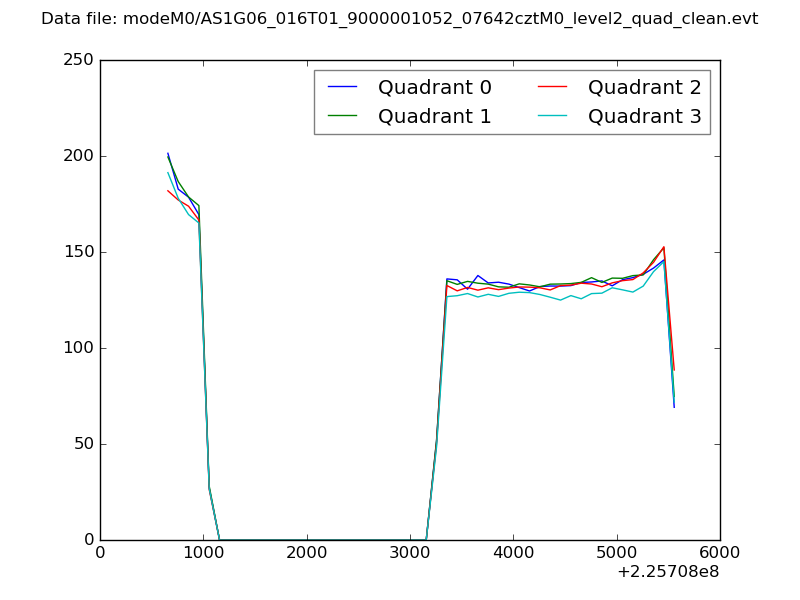 |
|
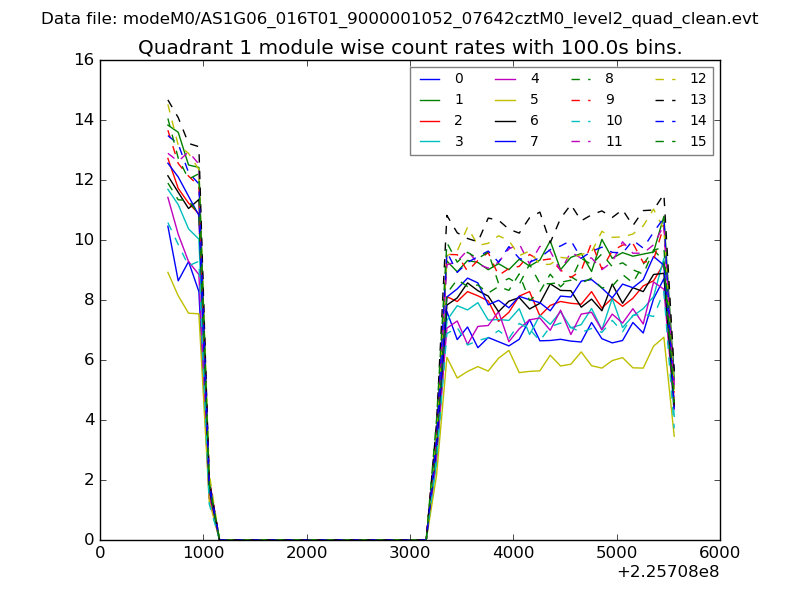
| Module-wise count rates for Quadrant A Data is divided into 100 sec bins |
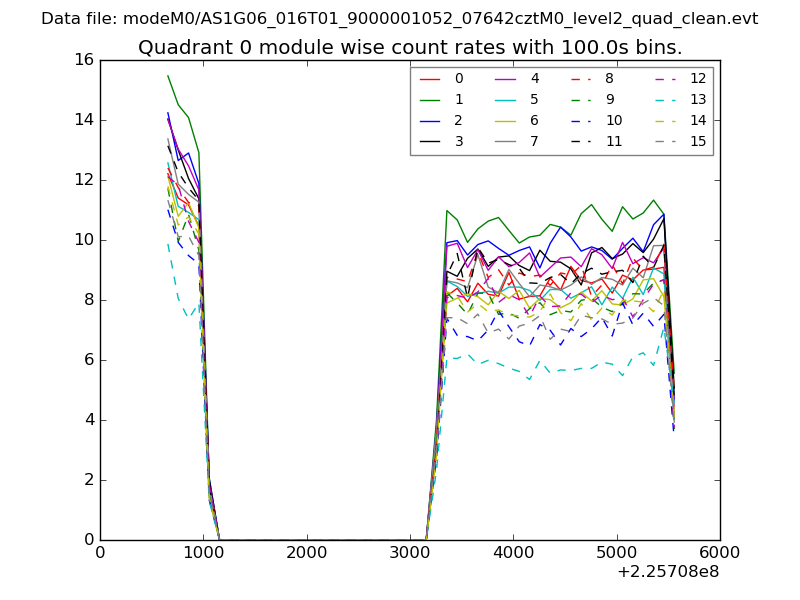 |
 |
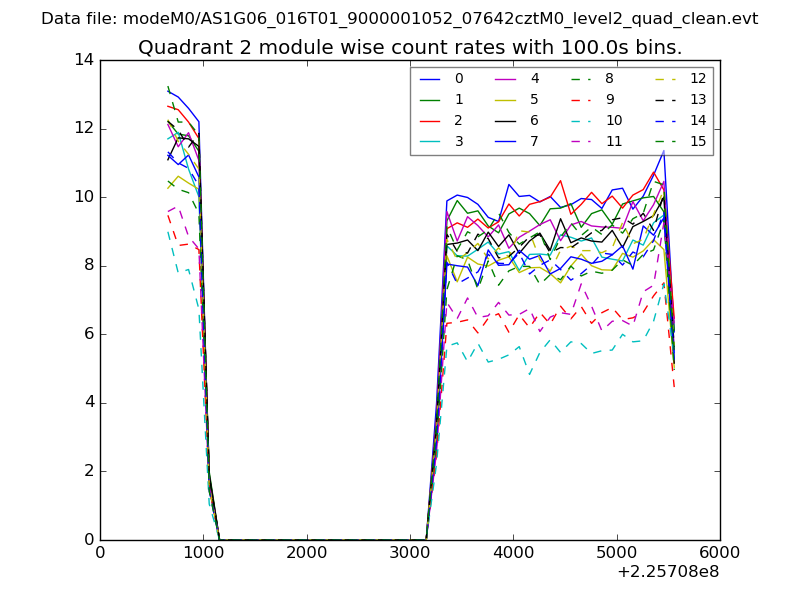
| Module-wise count rates for Quadrant B Data is divided into 100 sec bins |
 |
 |
| Module-wise count rates for Quadrant C Data is divided into 100 sec bins |
 |
 |
| Module-wise count rates for Quadrant D Data is divided into 100 sec bins |
 |
 |
| Parameter | Plot |
|---|---|
| CZT HV Monitor | 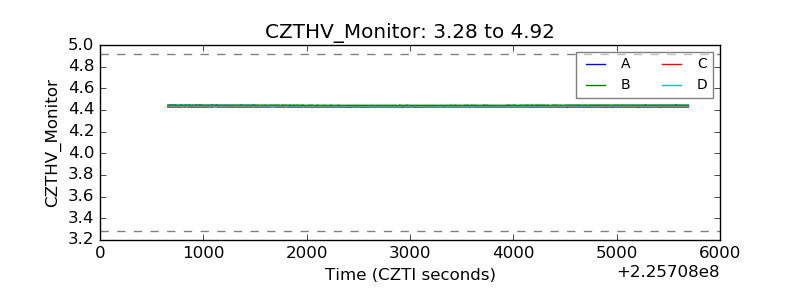 |
| D_VDD |  |
| Temperature 1 |  |
| Veto HV Monitor | 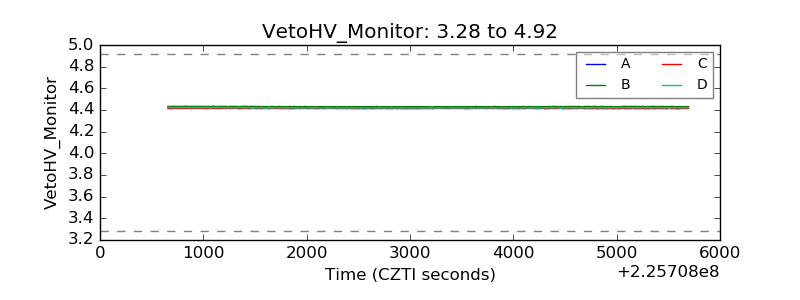 |
| Veto LLD | 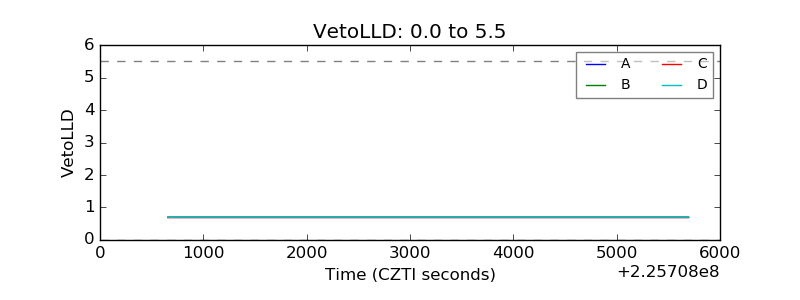 |
| Alpha Counter | 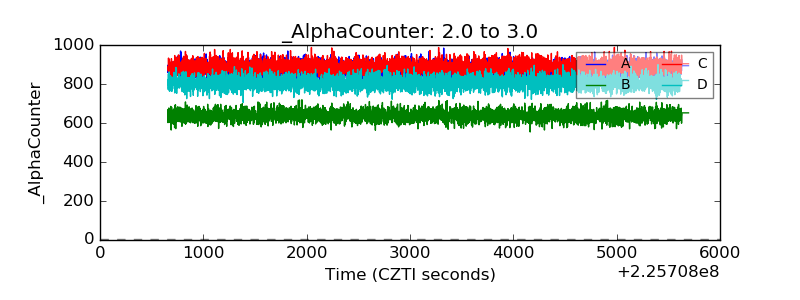 |
| _CPM_Rate | 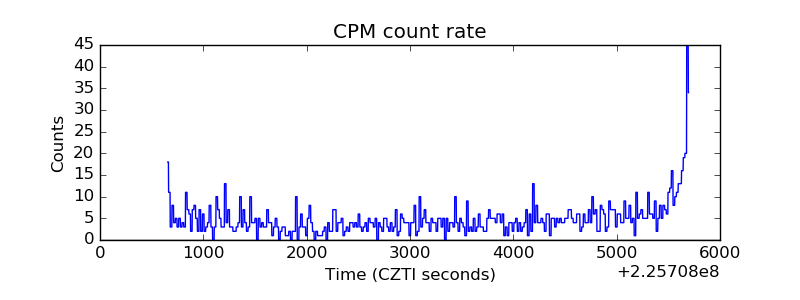 |
| CZT Counter | 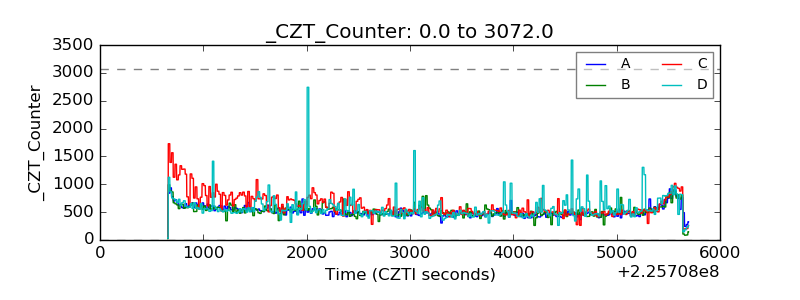 |
| +2.5 Volts monitor |  |
| +5 Volts monitor |  |
| _ROLL_ROT |  |
| _Roll_DEC |  |
| _Roll_RA | 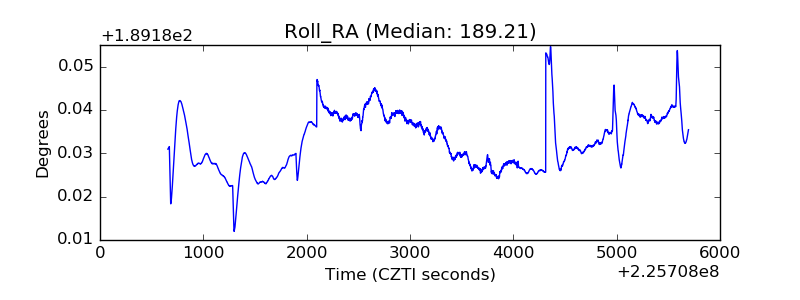 |
| Veto Counter |  |