| Param | Original file | Final file |
|---|---|---|
| Filename | modeM0/AS1T01_157T01_9000001050cztM0_level2.fits | modeM0/AS1T01_157T01_9000001050cztM0_level2_quad_clean.evt |
| Size (bytes) | 128,983,680 | 121,818,240 |
| Size | 123.0 MB | 116.2 MB |
| Events in quadrant A | 804,034 | 755,577 |
| Events in quadrant B | 772,936 | 753,913 |
| Events in quadrant C | 666,206 | 548,625 |
| Events in quadrant D | 680,290 | 649,793 |
| Mode SS | |||
|---|---|---|---|
| Quadrant | BADHDUFLAG | Total packets | Discarded packets |
| A | 0 | 288 | 0 |
| B | 0 | 288 | 0 |
| C | 0 | 288 | 0 |
| D | 0 | 288 | 0 |
| Mode M0 | |||
|---|---|---|---|
| Quadrant | BADHDUFLAG | Total packets | Discarded packets |
| A | 0 | 32477 | 0 |
| B | 0 | 30067 | 0 |
| C | 0 | 80886 | 0 |
| D | 0 | 34240 | 0 |
| Mode M9 | |||
|---|---|---|---|
| Quadrant | BADHDUFLAG | Total packets | Discarded packets |
| A | 0 | 23 | 0 |
| B | 0 | 23 | 0 |
| C | 0 | 23 | 0 |
| D | 0 | 23 | 0 |
| Quadrant | Total seconds | Saturated seconds | Saturation percentage |
|---|---|---|---|
| A | 14198 | 347 | 2.444006% |
| B | 14198 | 287 | 2.021411% |
| C | 14198 | 5277 | 37.167207% |
| D | 14198 | 512 | 3.606142% |
Noise dominated data is calculated using 1-second bins in cleaned event files. If a bin has >2000 counts, and if more than 50% of those come from <1% of pixels, then it is considered to be noise-dominated and hence unusable.
| Quadrant | # 1 sec bins | Bins with >0 counts | Bins with >2000 counts | High rate bins dominated by noise | Noise dominated (total time) | Noise dominated (detector-on time) | Marked lightcurve |
|---|---|---|---|---|---|---|---|
| A | 15417 | 14197 | 0 | 0 | 0.00% | 0.00% |  |
| B | 15417 | 14196 | 0 | 0 | 0.00% | 0.00% |  |
| C | 15417 | 14193 | 0 | 0 | 0.00% | 0.00% |  |
| D | 15417 | 14192 | 0 | 0 | 0.00% | 0.00% | 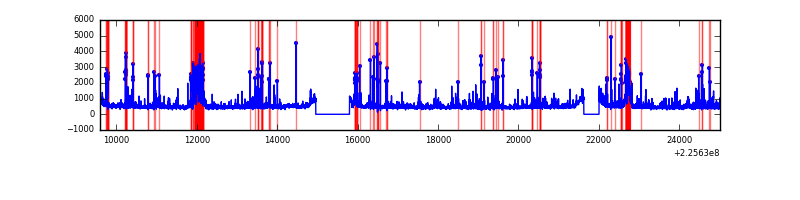 |
Top three noisy pixels from each quadrant. If the there are fewer than three noisy pixels in the level2.evt file, extra rows are filled as -1
| Pixel properties | Quadrant properties | ||||||
|---|---|---|---|---|---|---|---|
| Quadrant | DetID | PixID | Counts | Sigma | Mean | Median | Sigma |
| A | 0 | 29 | 813 | 11.32 | 208 | 195 | 54.6 |
| A | 14 | 188 | 808 | 11.23 | 208 | 195 | 54.6 |
| A | 7 | 110 | 721 | 9.63 | 208 | 195 | 54.6 |
| B | 2 | 9 | 673 | 10.98 | 203 | 193 | 43.7 |
| B | 3 | 17 | 588 | 9.04 | 203 | 193 | 43.7 |
| B | 12 | 226 | 588 | 9.04 | 203 | 193 | 43.7 |
| C | 1 | 80 | 499 | 7.02 | 176 | 163 | 47.8 |
| C | 1 | 81 | 475 | 6.52 | 176 | 163 | 47.8 |
| C | 1 | 65 | 453 | 6.06 | 176 | 163 | 47.8 |
| D | 6 | 67 | 496 | 5.98 | 194 | 176 | 53.5 |
| D | 3 | 14 | 495 | 5.96 | 194 | 176 | 53.5 |
| D | 1 | 31 | 484 | 5.76 | 194 | 176 | 53.5 |
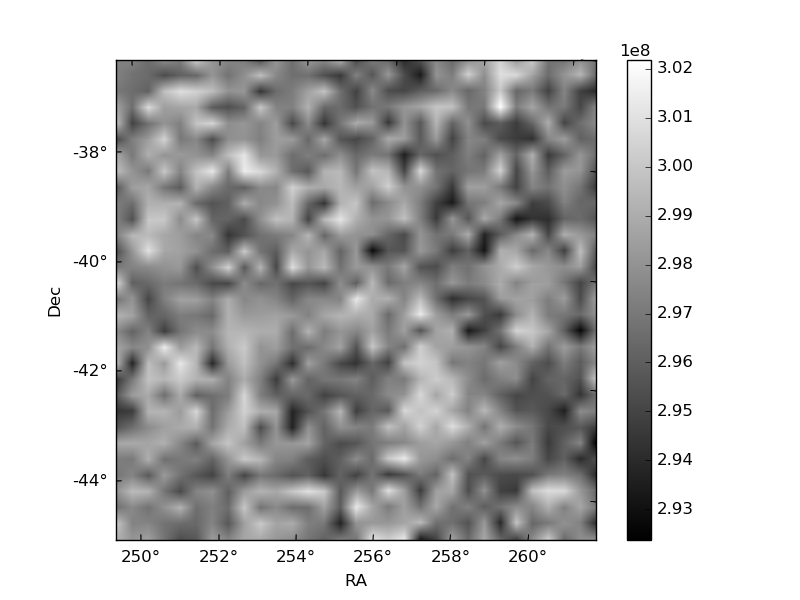
Histogram calculated using DETX and DETY for each event in the final _common_clean file
| Quadrant A | 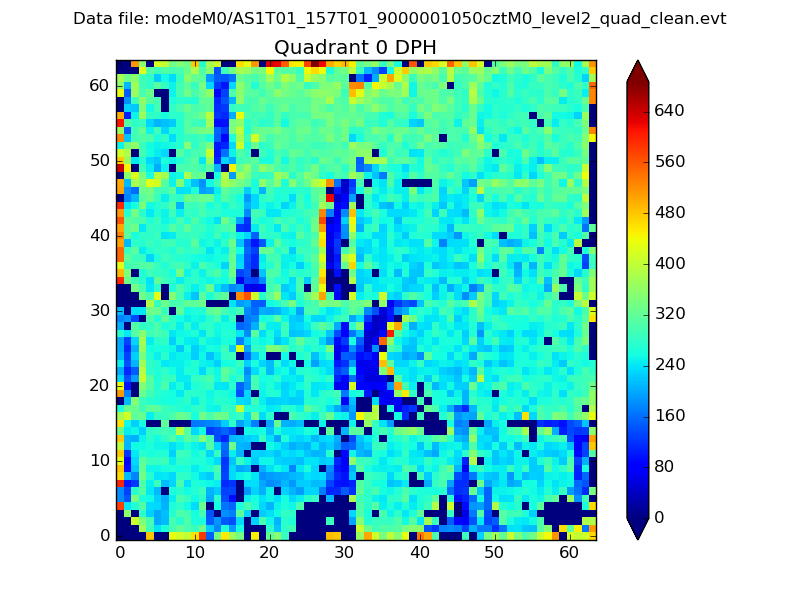 |
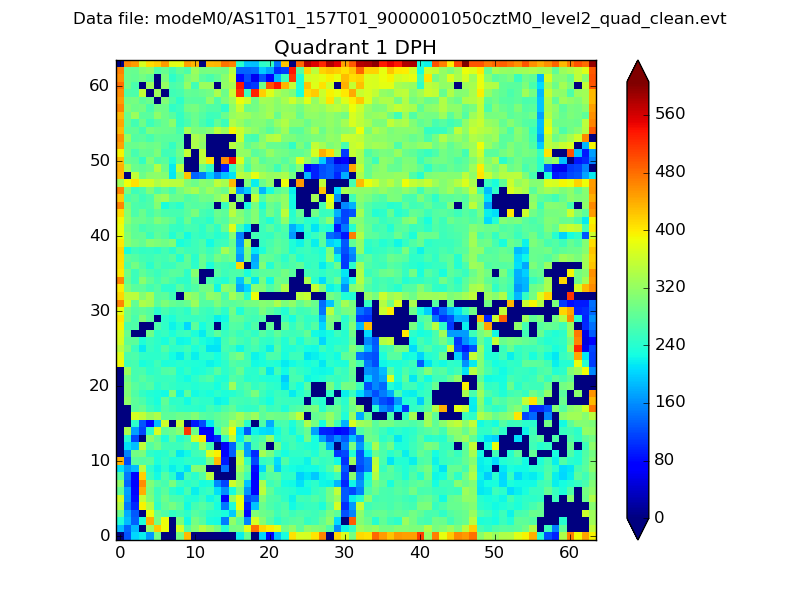 |
Quadrant B |
|---|---|---|---|
| Quadrant D | 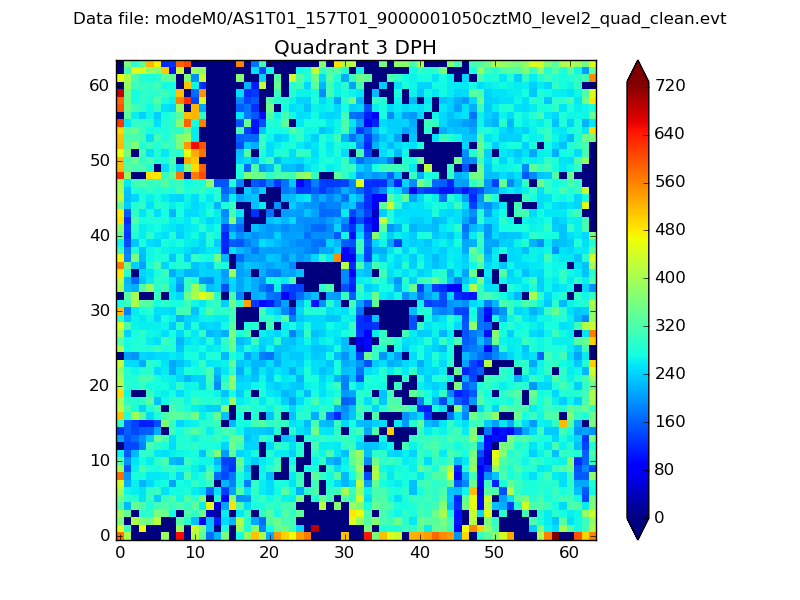 |
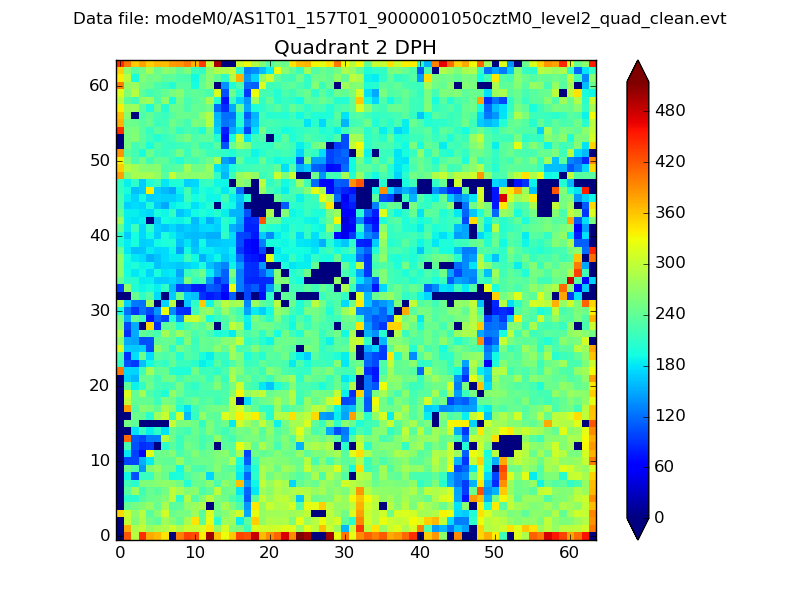 |
Quadrant C |
| Plot type | Count rate plots | Images |
|---|---|---|
| Comparison with Poisson distribution Blue bars denote a histogram of data divided into 1 sec bins. Red curve is a Poisson curve with rate = median count rate of data. |
 |
 |
| Quadrant-wise count rates Data is divided into 100 sec bins |
 |
|
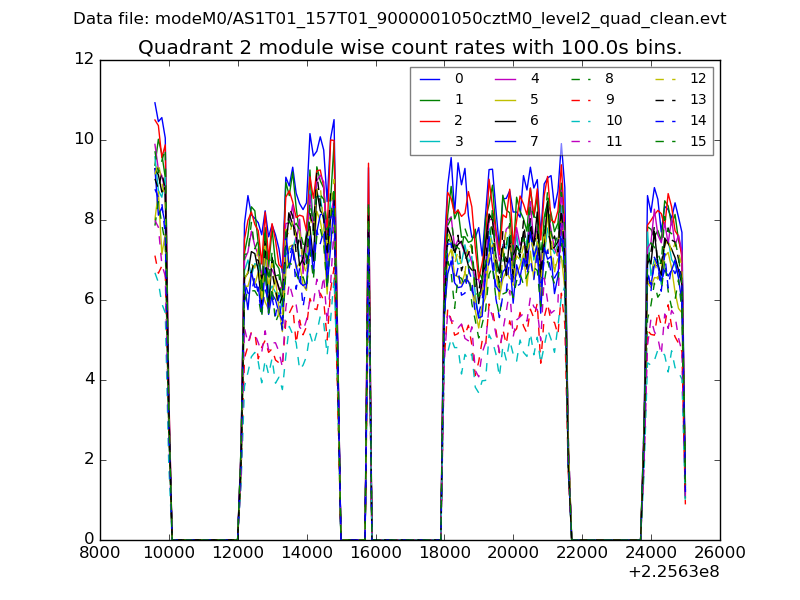
| Module-wise count rates for Quadrant A Data is divided into 100 sec bins |
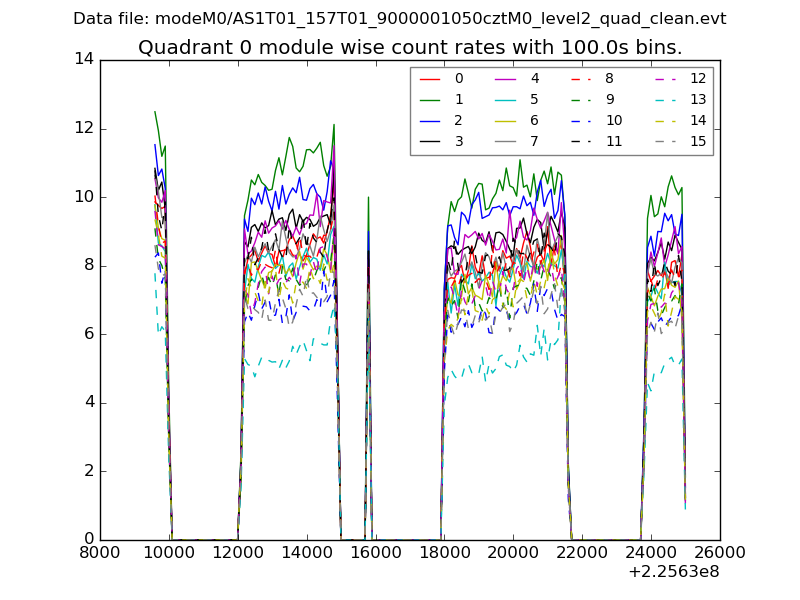 |
 |
| Module-wise count rates for Quadrant B Data is divided into 100 sec bins |
 |
 |
| Module-wise count rates for Quadrant C Data is divided into 100 sec bins |
 |
 |
| Module-wise count rates for Quadrant D Data is divided into 100 sec bins |
 |
 |
| Parameter | Plot |
|---|---|
| CZT HV Monitor |  |
| D_VDD | 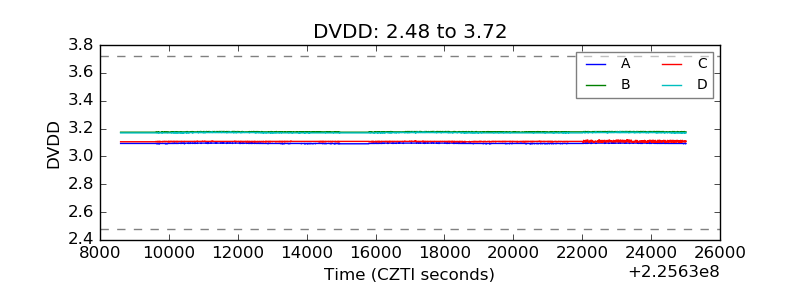 |
| Temperature 1 | 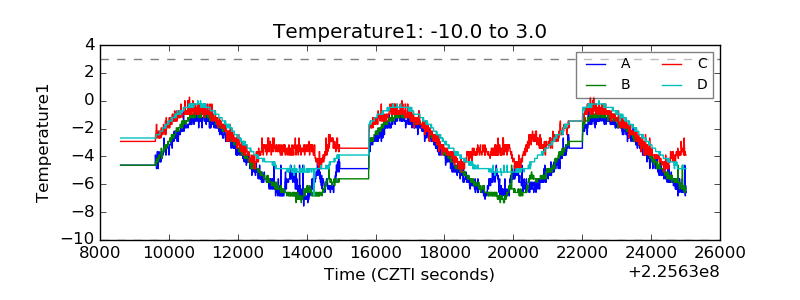 |
| Veto HV Monitor |  |
| Veto LLD | 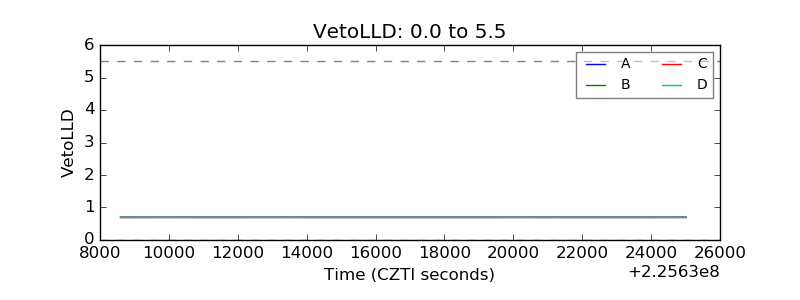 |
| Alpha Counter |  |
| _CPM_Rate | 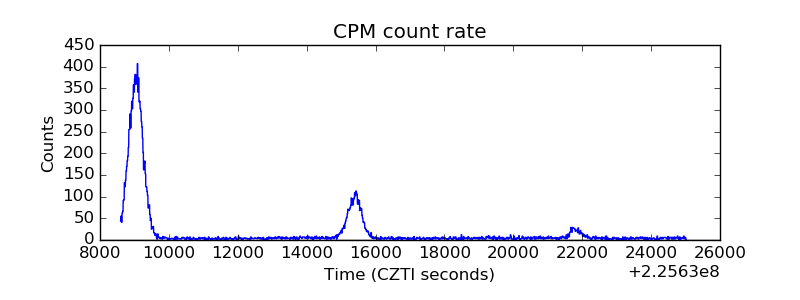 |
| CZT Counter | 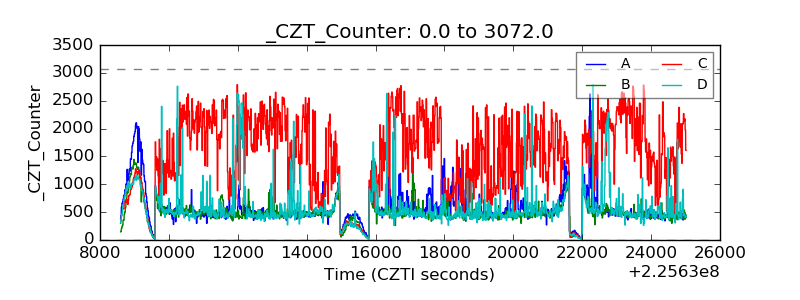 |
| +2.5 Volts monitor |  |
| +5 Volts monitor |  |
| _ROLL_ROT | 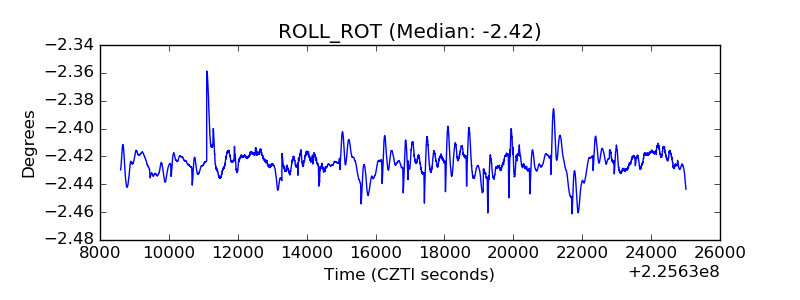 |
| _Roll_DEC | 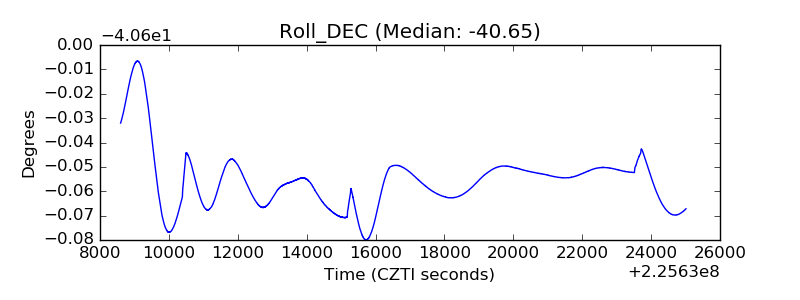 |
| _Roll_RA |  |
| Veto Counter |  |