| Param | Original file | Final file |
|---|---|---|
| Filename | modeM0/AS1T01_157T01_9000001050_07629cztM0_level2.evt | modeM0/AS1T01_157T01_9000001050_07629cztM0_level2_quad_clean.evt |
| Size (bytes) | 195,661,440 | 12,481,920 |
| Size | 186.6 MB | 11.9 MB |
| Events in quadrant A | 885,697 | 64,692 |
| Events in quadrant B | 878,659 | 67,319 |
| Events in quadrant C | 3,060,081 | 60,301 |
| Events in quadrant D | 984,048 | 60,512 |
| Mode SS | |||
|---|---|---|---|
| Quadrant | BADHDUFLAG | Total packets | Discarded packets |
| A | 0 | 34 | 0 |
| B | 0 | 34 | 0 |
| C | 0 | 34 | 0 |
| D | 0 | 34 | 0 |
| Mode M0 | |||
|---|---|---|---|
| Quadrant | BADHDUFLAG | Total packets | Discarded packets |
| A | 0 | 3599 | 2 |
| B | 0 | 3608 | 1 |
| C | 0 | 10259 | 1 |
| D | 0 | 3982 | 1 |
| Mode M9 | |||
|---|---|---|---|
| Quadrant | BADHDUFLAG | Total packets | Discarded packets |
| A | 0 | 10 | 0 |
| B | 0 | 10 | 0 |
| C | 0 | 10 | 0 |
| D | 0 | 10 | 0 |
| Quadrant | Total seconds | Saturated seconds | Saturation percentage |
|---|---|---|---|
| A | 1693 | 15 | 0.886001% |
| B | 1693 | 11 | 0.649734% |
| C | 1693 | 755 | 44.595393% |
| D | 1693 | 40 | 2.362670% |
Noise dominated data is calculated using 1-second bins in cleaned event files. If a bin has >2000 counts, and if more than 50% of those come from <1% of pixels, then it is considered to be noise-dominated and hence unusable.
| Quadrant | # 1 sec bins | Bins with >0 counts | Bins with >2000 counts | High rate bins dominated by noise | Noise dominated (total time) | Noise dominated (detector-on time) | Marked lightcurve |
|---|---|---|---|---|---|---|---|
| A | 1693 | 1693 | 0 | 0 | 0.00% | 0.00% | 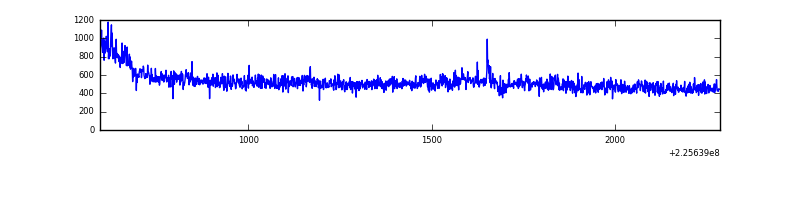 |
| B | 1693 | 1693 | 0 | 0 | 0.00% | 0.00% | 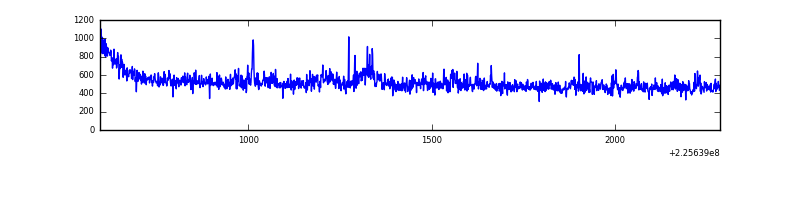 |
| C | 1693 | 1693 | 695 | 695 | 41.05% | 41.05% | 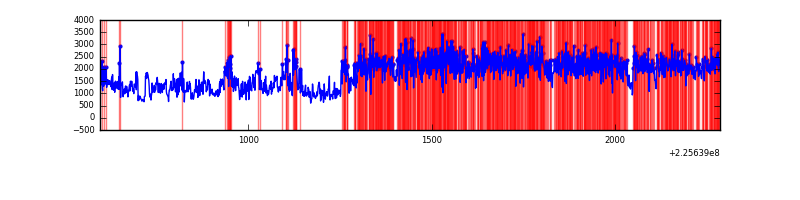 |
| D | 1693 | 1693 | 28 | 28 | 1.65% | 1.65% | 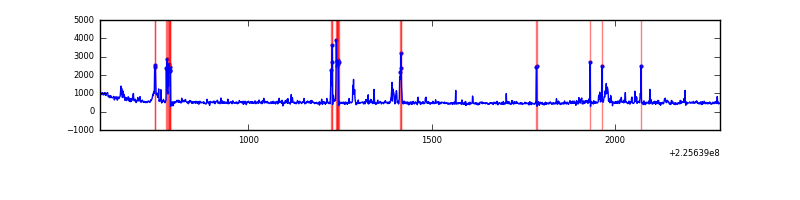 |
Top three noisy pixels from each quadrant. If the there are fewer than three noisy pixels in the level2.evt file, extra rows are filled as -1
| Pixel properties | Quadrant properties | ||||||
|---|---|---|---|---|---|---|---|
| Quadrant | DetID | PixID | Counts | Sigma | Mean | Median | Sigma |
| A | 13 | 251 | 30824 | 666.26 | 218 | 213 | 45.9 |
| A | 0 | 128 | 12511 | 267.67 | 218 | 213 | 45.9 |
| A | 13 | 14 | 2709 | 54.33 | 218 | 213 | 45.9 |
| B | 5 | 255 | 11411 | 262.2 | 216 | 212 | 42.7 |
| B | 0 | 214 | 7411 | 168.55 | 216 | 212 | 42.7 |
| B | 15 | 204 | 5312 | 119.41 | 216 | 212 | 42.7 |
| C | 9 | 68 | 2260926 | 49772.86 | 191 | 191 | 45.4 |
| C | 4 | 254 | 38703 | 847.89 | 191 | 191 | 45.4 |
| C | 1 | 16 | 10361 | 223.91 | 191 | 191 | 45.4 |
| D | 2 | 152 | 52706 | 990.18 | 210 | 204 | 53.0 |
| D | 1 | 52 | 43833 | 822.83 | 210 | 204 | 53.0 |
| D | 2 | 14 | 43603 | 818.5 | 210 | 204 | 53.0 |
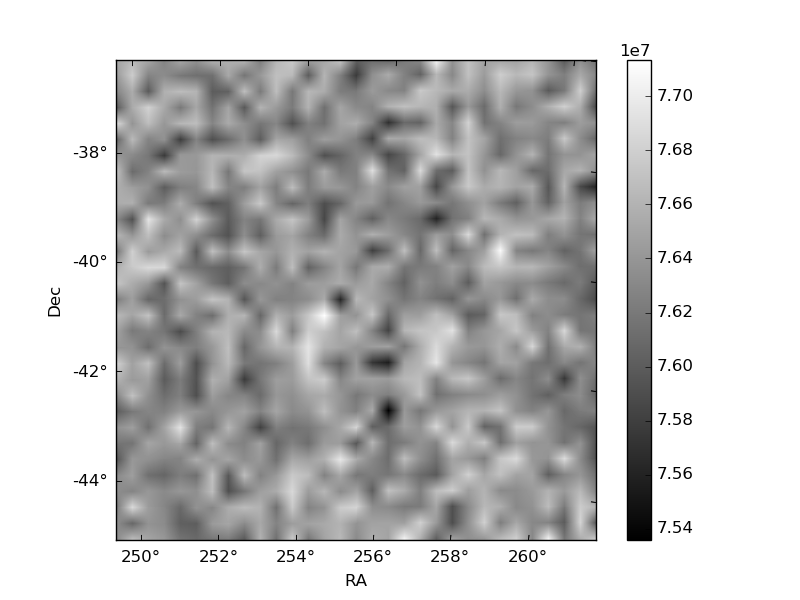
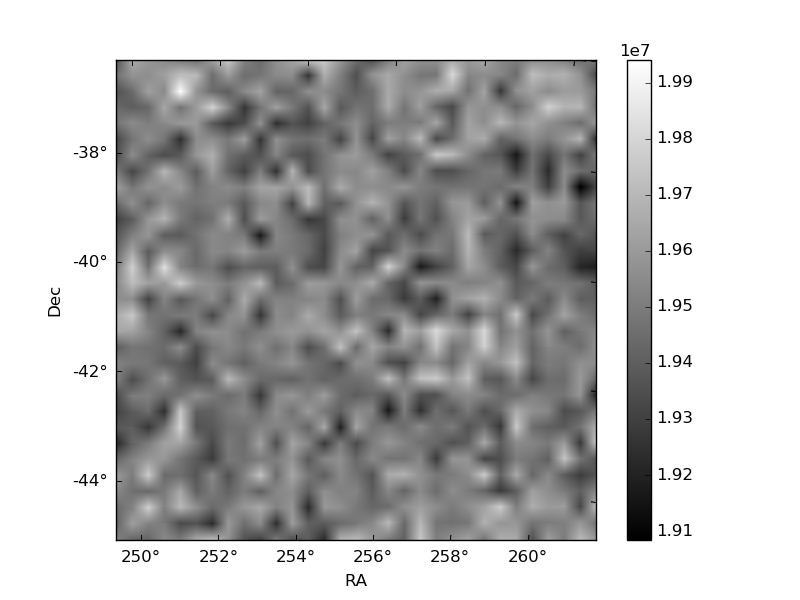
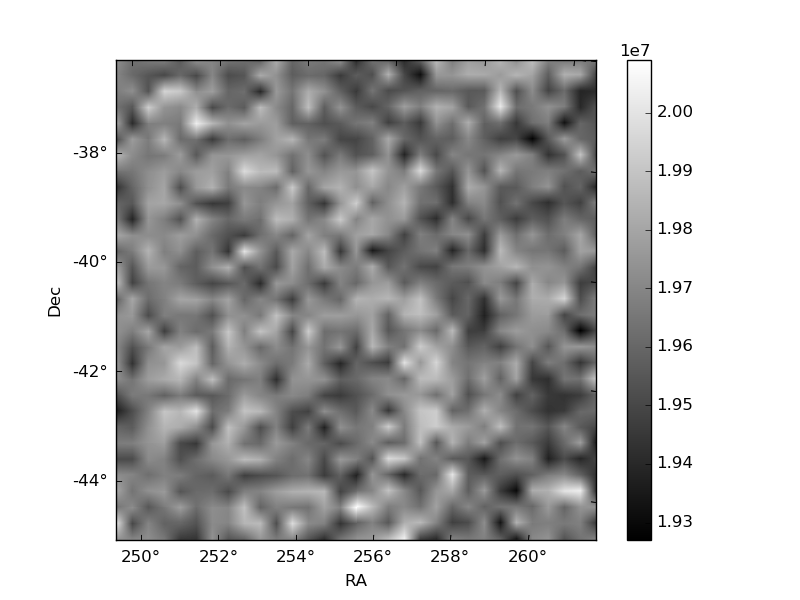
Histogram calculated using DETX and DETY for each event in the final _common_clean file
| Quadrant A | 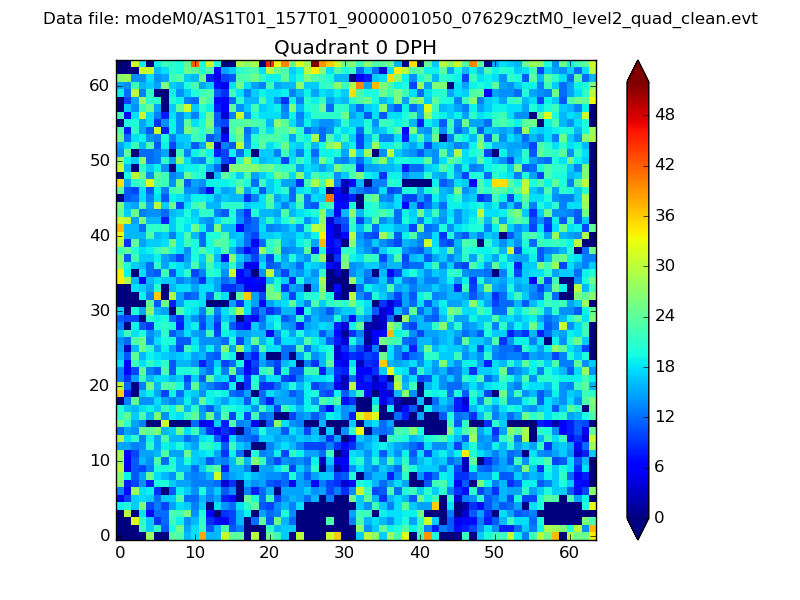 |
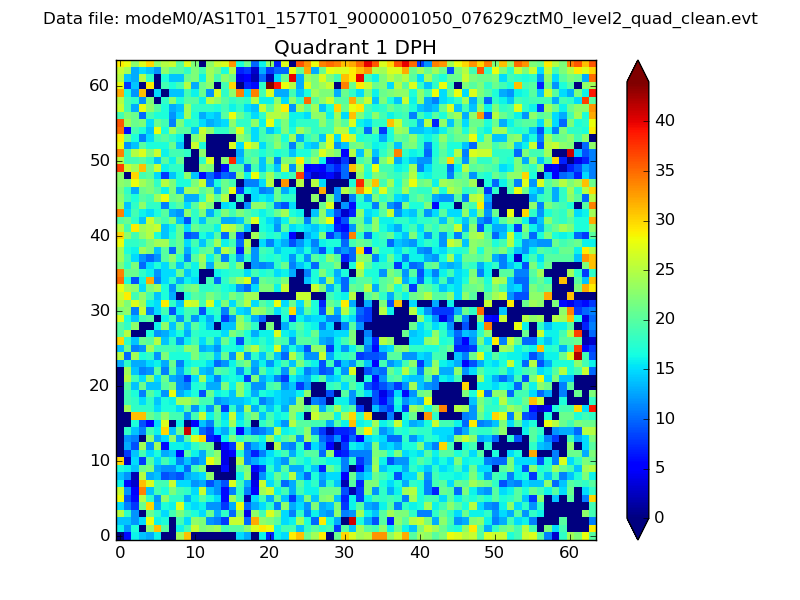 |
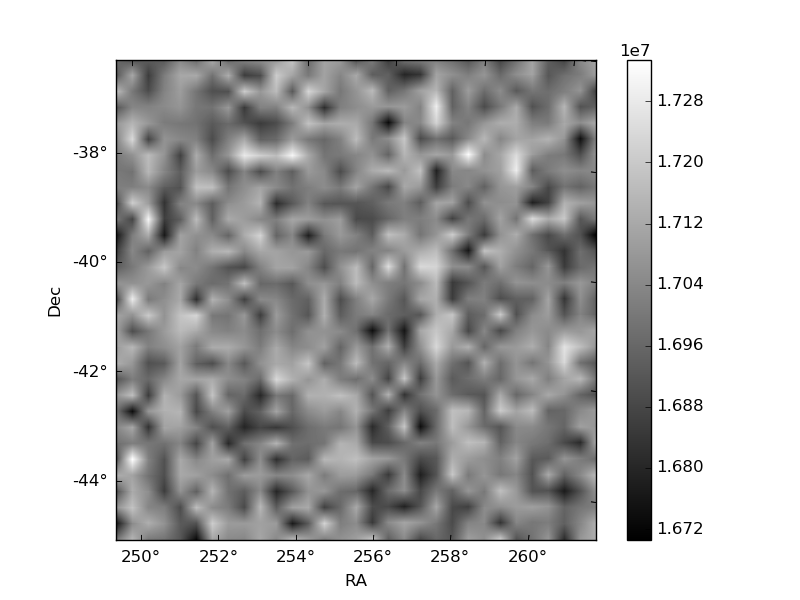
Quadrant B |
|---|---|---|---|
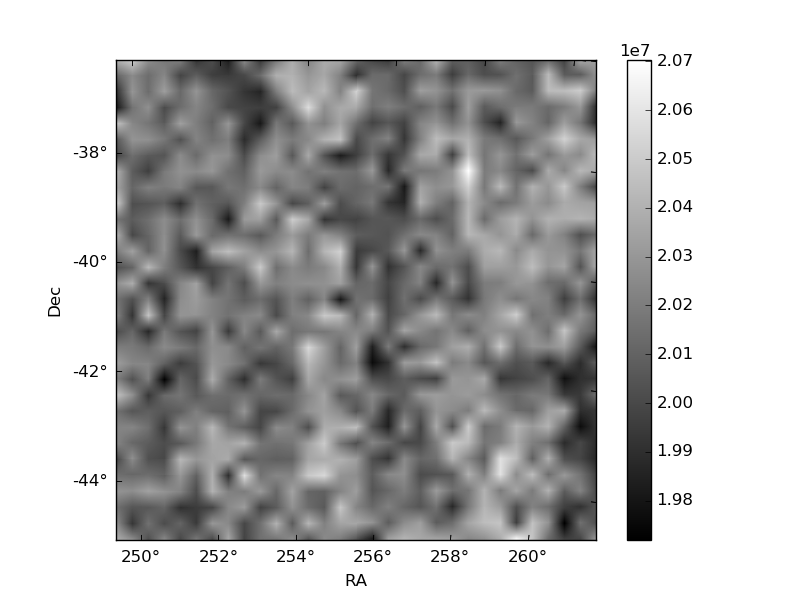
| Quadrant D |  |
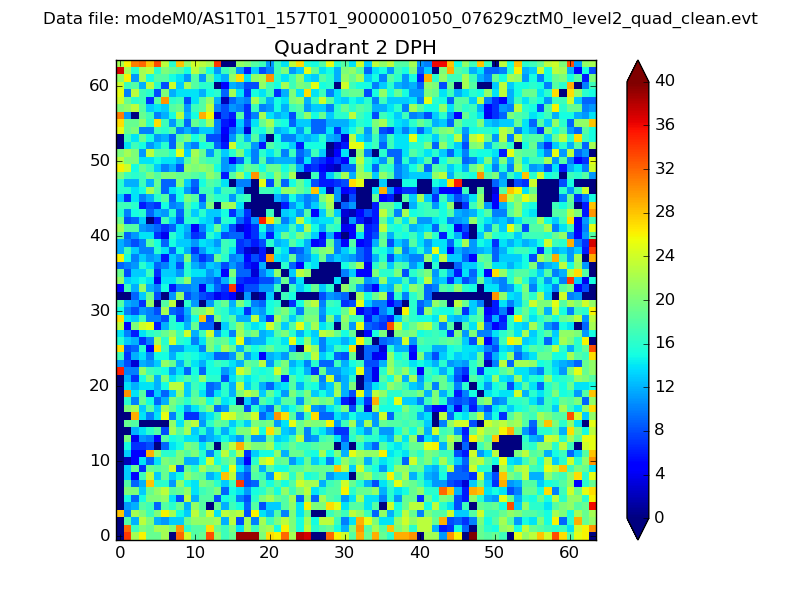 |
Quadrant C |
| Plot type | Count rate plots | Images |
|---|---|---|
| Comparison with Poisson distribution Blue bars denote a histogram of data divided into 1 sec bins. Red curve is a Poisson curve with rate = median count rate of data. |
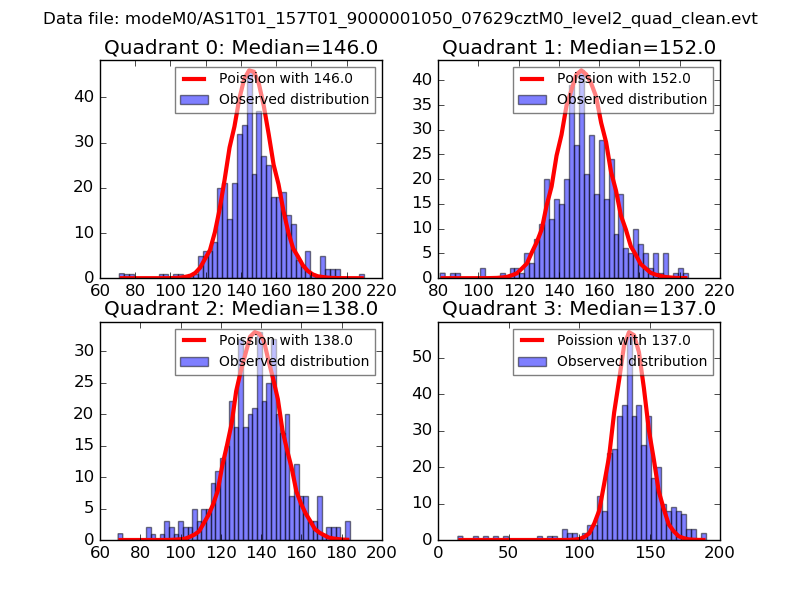 |
 |
| Quadrant-wise count rates Data is divided into 100 sec bins |
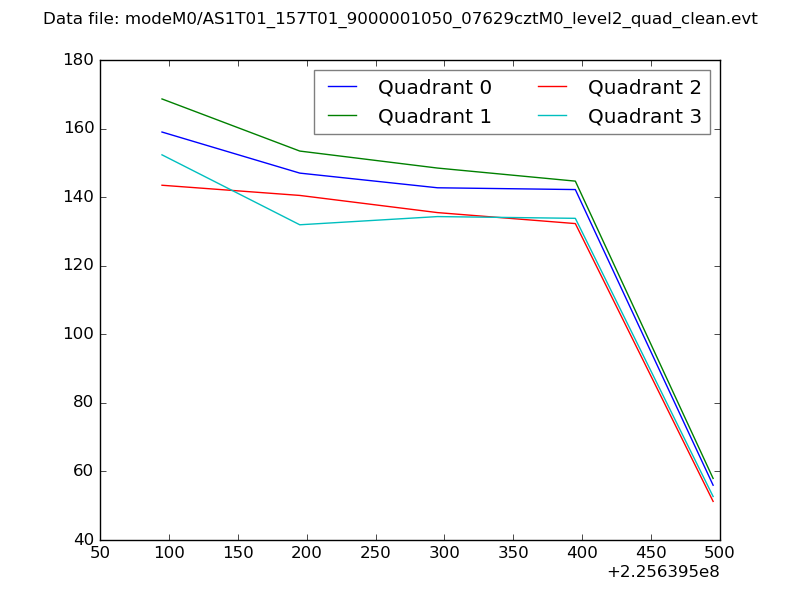 |
|
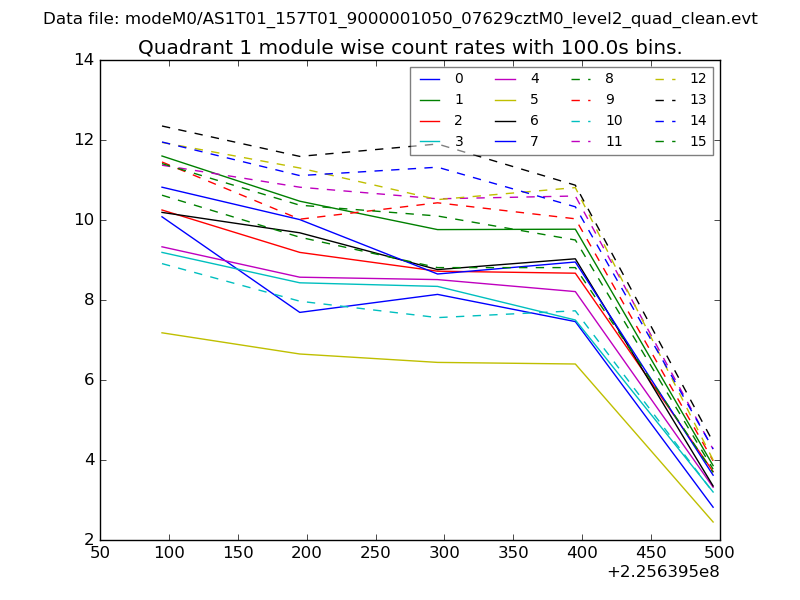
| Module-wise count rates for Quadrant A Data is divided into 100 sec bins |
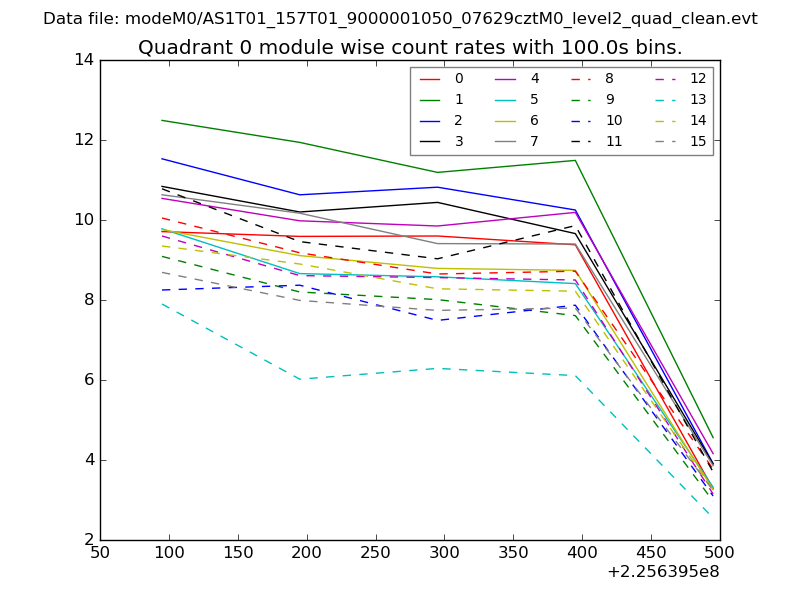 |
 |
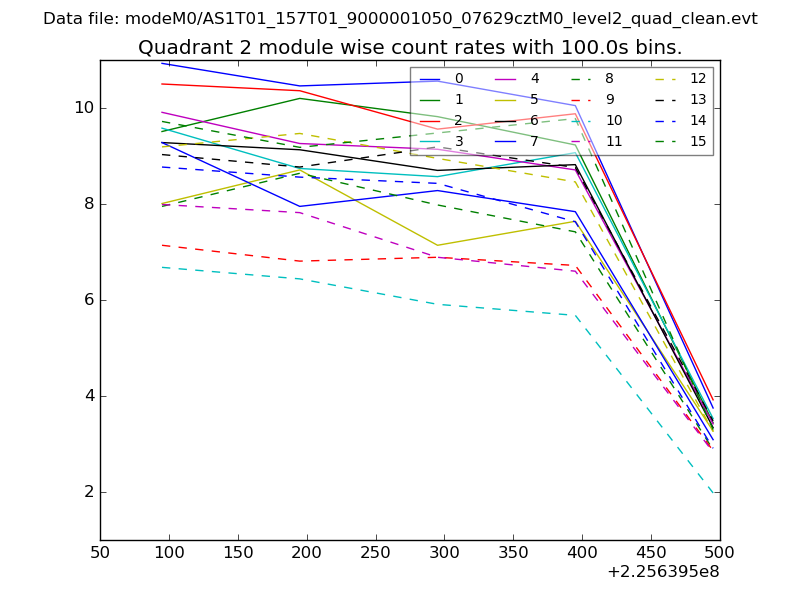
| Module-wise count rates for Quadrant B Data is divided into 100 sec bins |
 |
 |
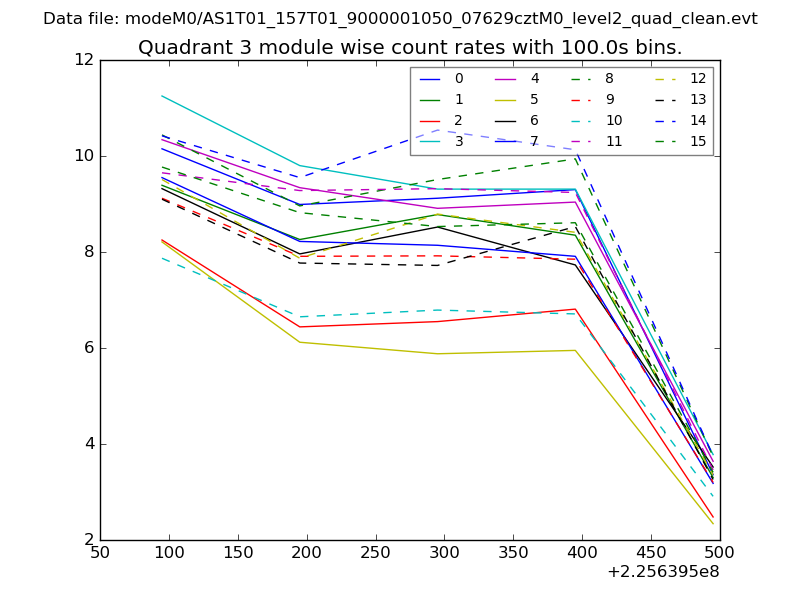
| Module-wise count rates for Quadrant C Data is divided into 100 sec bins |
 |
 |
| Module-wise count rates for Quadrant D Data is divided into 100 sec bins |
 |
 |
| Parameter | Plot |
|---|---|
| CZT HV Monitor | 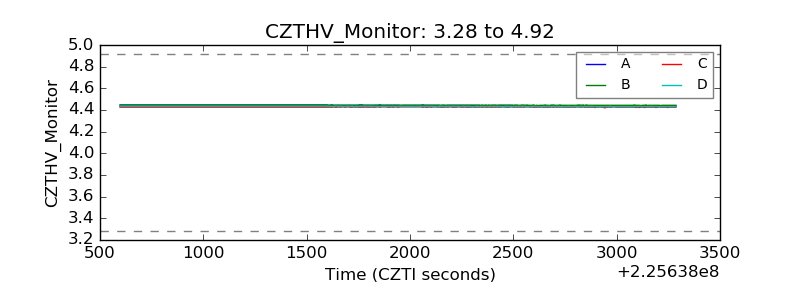 |
| D_VDD | 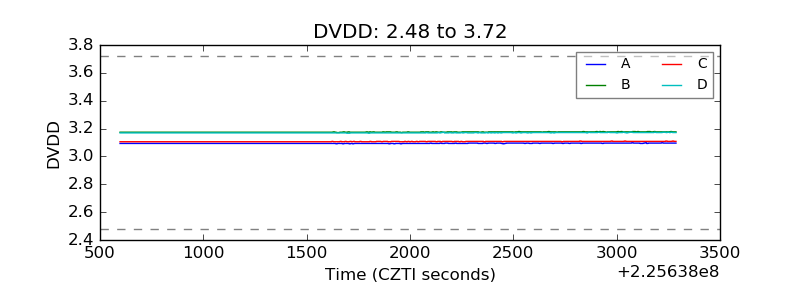 |
| Temperature 1 | 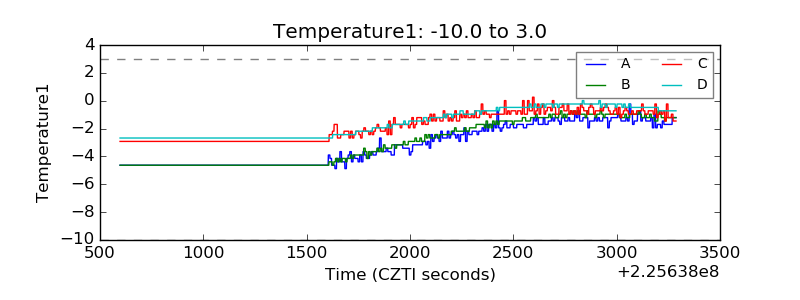 |
| Veto HV Monitor | 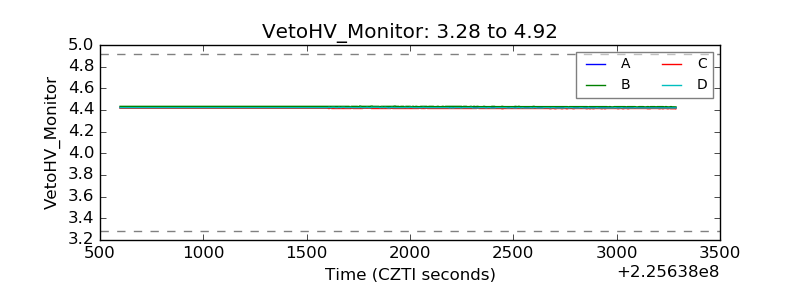 |
| Veto LLD | 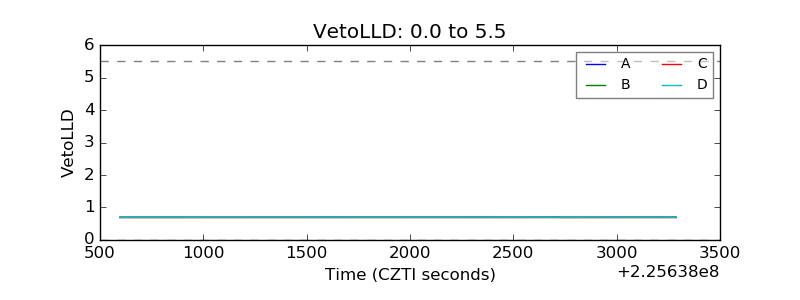 |
| Alpha Counter | 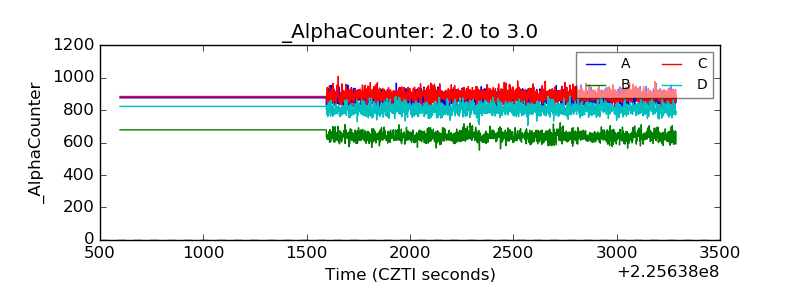 |
| _CPM_Rate | 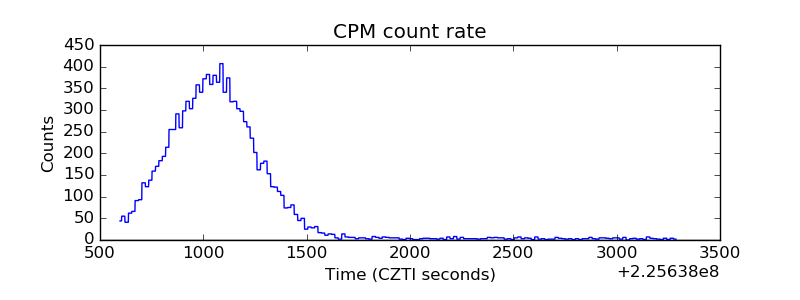 |
| CZT Counter |  |
| +2.5 Volts monitor | 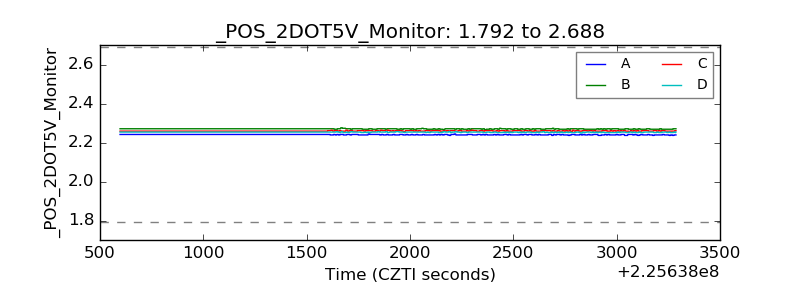 |
| +5 Volts monitor |  |
| _ROLL_ROT | 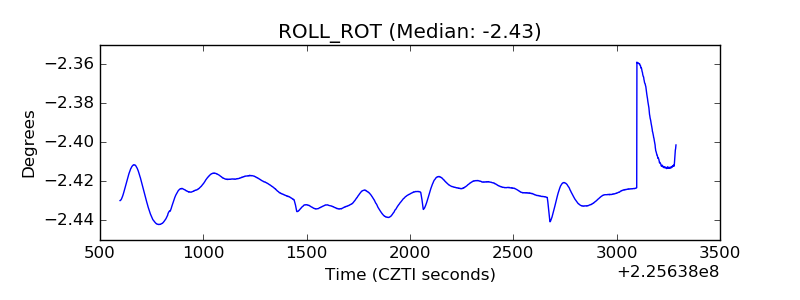 |
| _Roll_DEC | 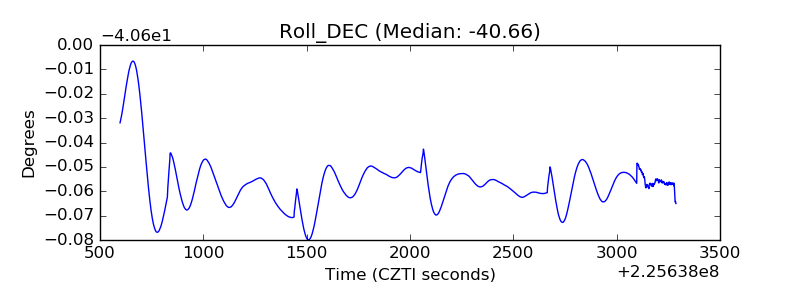 |
| _Roll_RA | 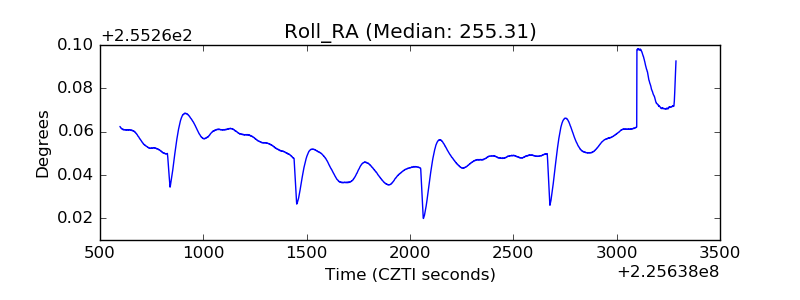 |
| Veto Counter | 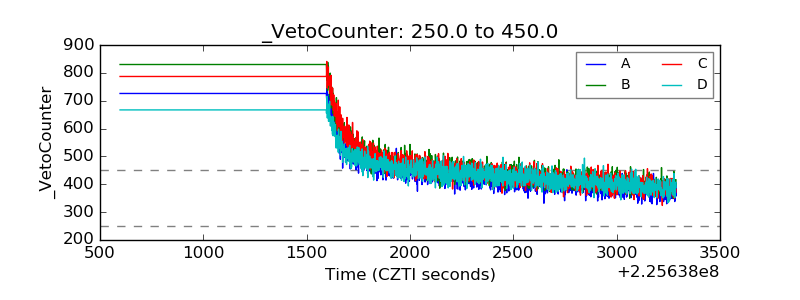 |