| Param | Original file | Final file |
|---|---|---|
| Filename | modeM0/AS1T01_157T01_9000001050_07630cztM0_level2.evt | modeM0/AS1T01_157T01_9000001050_07630cztM0_level2_quad_clean.evt |
| Size (bytes) | 808,928,640 | 54,627,840 |
| Size | 771.5 MB | 52.1 MB |
| Events in quadrant A | 3,707,263 | 324,871 |
| Events in quadrant B | 3,614,573 | 328,149 |
| Events in quadrant C | 12,412,383 | 226,731 |
| Events in quadrant D | 4,289,516 | 284,195 |
| Mode SS | |||
|---|---|---|---|
| Quadrant | BADHDUFLAG | Total packets | Discarded packets |
| A | 0 | 140 | 0 |
| B | 0 | 140 | 0 |
| C | 0 | 140 | 0 |
| D | 0 | 140 | 0 |
| Mode M0 | |||
|---|---|---|---|
| Quadrant | BADHDUFLAG | Total packets | Discarded packets |
| A | 0 | 15406 | 0 |
| B | 0 | 15105 | 0 |
| C | 0 | 41739 | 0 |
| D | 0 | 17362 | 0 |
| Mode M9 | |||
|---|---|---|---|
| Quadrant | BADHDUFLAG | Total packets | Discarded packets |
| A | 0 | 9 | 0 |
| B | 0 | 9 | 0 |
| C | 0 | 9 | 0 |
| D | 0 | 9 | 0 |
| Quadrant | Total seconds | Saturated seconds | Saturation percentage |
|---|---|---|---|
| A | 7043 | 121 | 1.718018% |
| B | 7043 | 130 | 1.845804% |
| C | 7043 | 2821 | 40.053954% |
| D | 7043 | 288 | 4.089167% |
Noise dominated data is calculated using 1-second bins in cleaned event files. If a bin has >2000 counts, and if more than 50% of those come from <1% of pixels, then it is considered to be noise-dominated and hence unusable.
| Quadrant | # 1 sec bins | Bins with >0 counts | Bins with >2000 counts | High rate bins dominated by noise | Noise dominated (total time) | Noise dominated (detector-on time) | Marked lightcurve |
|---|---|---|---|---|---|---|---|
| A | 7883 | 7044 | 0 | 0 | 0.00% | 0.00% | 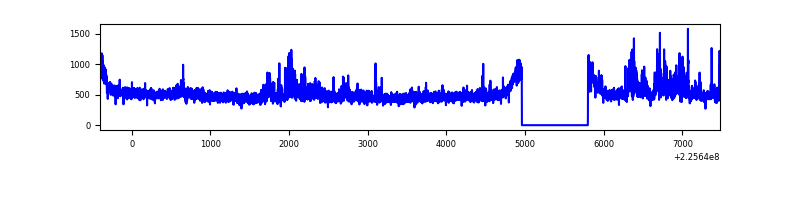 |
| B | 7883 | 7044 | 3 | 3 | 0.04% | 0.04% | 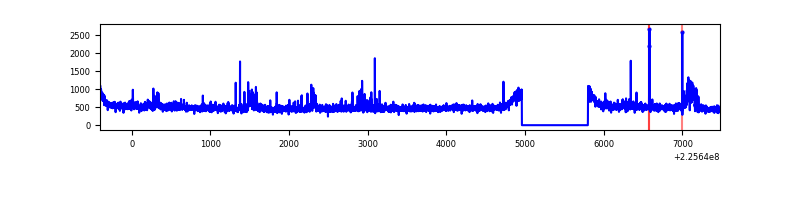 |
| C | 7883 | 7044 | 2667 | 2667 | 33.83% | 37.86% | 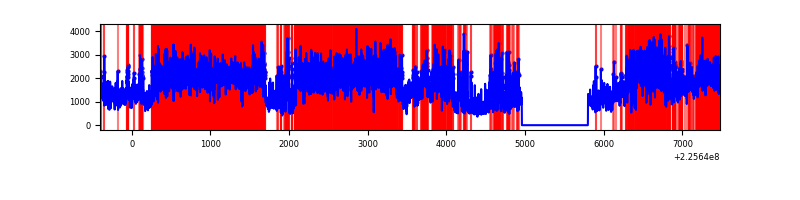 |
| D | 7883 | 7044 | 198 | 198 | 2.51% | 2.81% | 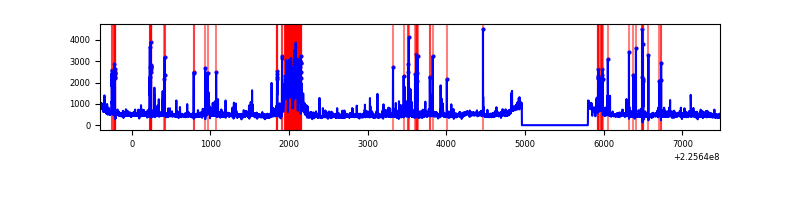 |
Top three noisy pixels from each quadrant. If the there are fewer than three noisy pixels in the level2.evt file, extra rows are filled as -1
| Pixel properties | Quadrant properties | ||||||
|---|---|---|---|---|---|---|---|
| Quadrant | DetID | PixID | Counts | Sigma | Mean | Median | Sigma |
| A | 13 | 251 | 345110 | 1969.02 | 866 | 846 | 174.8 |
| A | 3 | 1 | 13761 | 73.87 | 866 | 846 | 174.8 |
| A | 0 | 128 | 13548 | 72.65 | 866 | 846 | 174.8 |
| B | 0 | 229 | 91200 | 545.81 | 867 | 846 | 165.5 |
| B | 0 | 219 | 53769 | 319.7 | 867 | 846 | 165.5 |
| B | 0 | 214 | 29933 | 175.71 | 867 | 846 | 165.5 |
| C | 9 | 68 | 7620128 | 43557.93 | 758 | 762 | 174.9 |
| C | 9 | 243 | 817637 | 4669.86 | 758 | 762 | 174.9 |
| C | 4 | 254 | 789914 | 4511.38 | 758 | 762 | 174.9 |
| D | 12 | 233 | 497690 | 2430.3 | 834 | 809 | 204.5 |
| D | 13 | 104 | 153248 | 745.6 | 834 | 809 | 204.5 |
| D | 2 | 14 | 129506 | 629.47 | 834 | 809 | 204.5 |
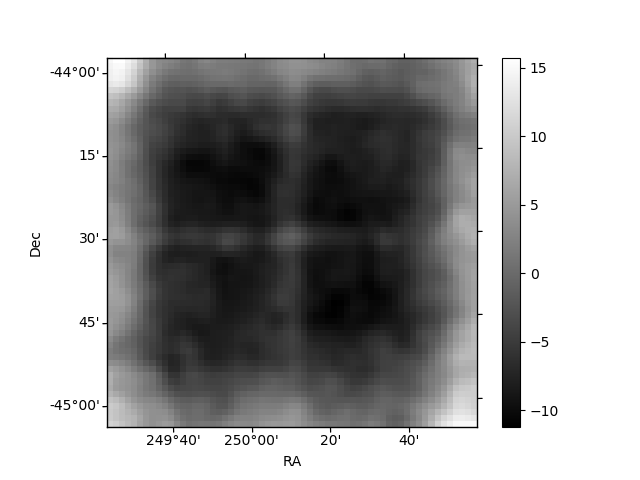
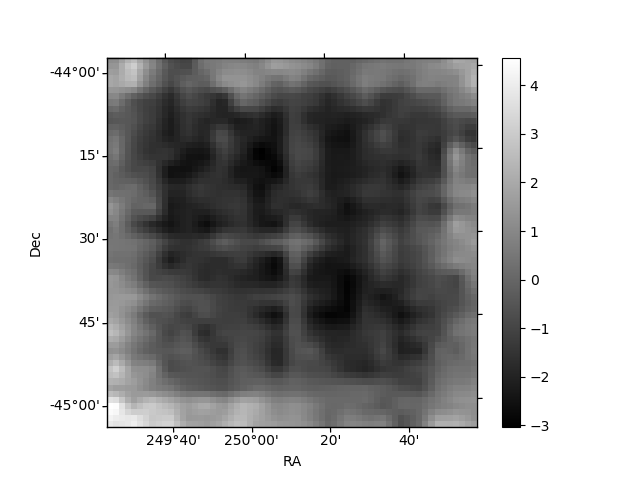
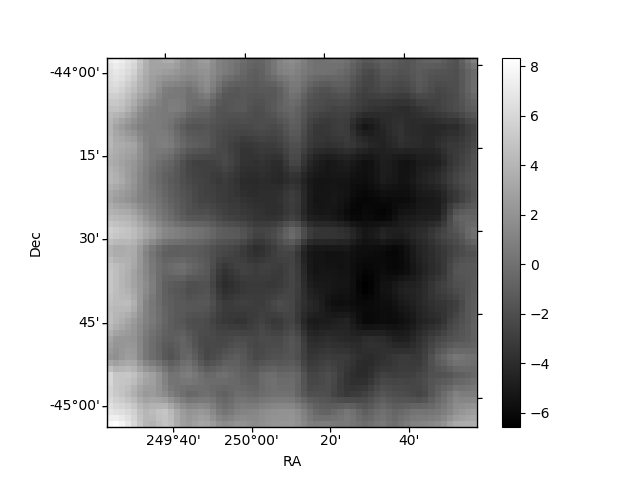
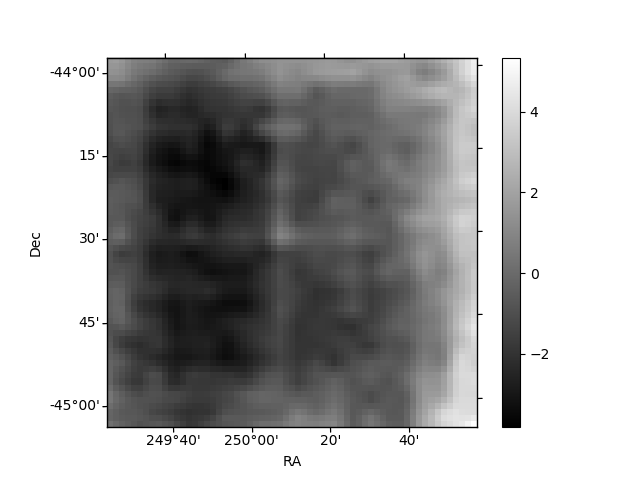
Histogram calculated using DETX and DETY for each event in the final _common_clean file
| Quadrant A | 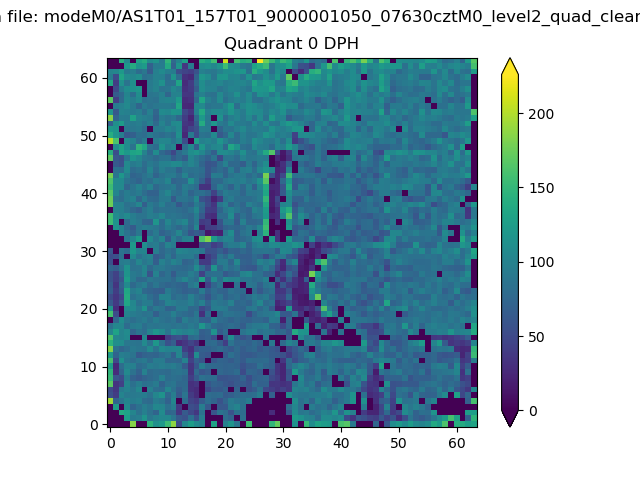 |
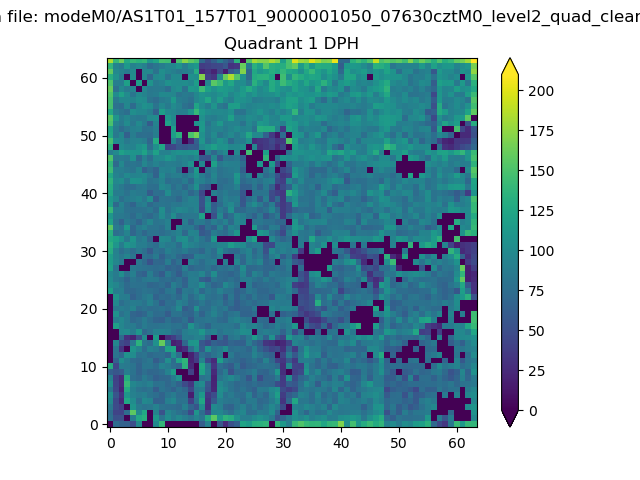 |
Quadrant B |
|---|---|---|---|
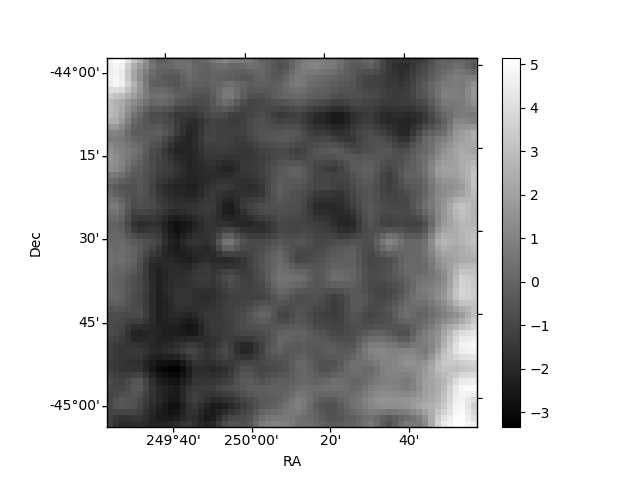
| Quadrant D | 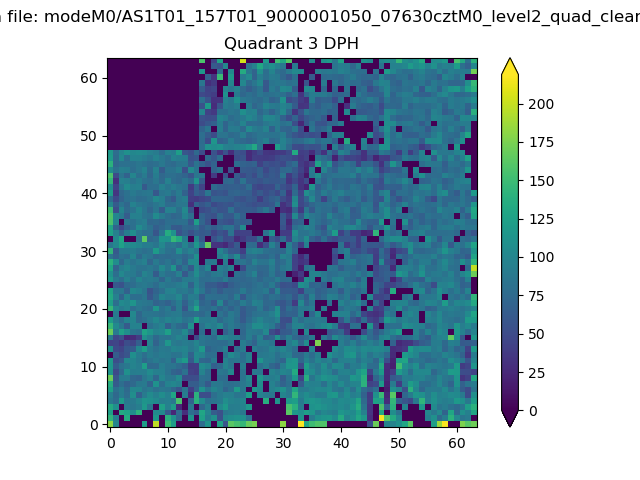 |
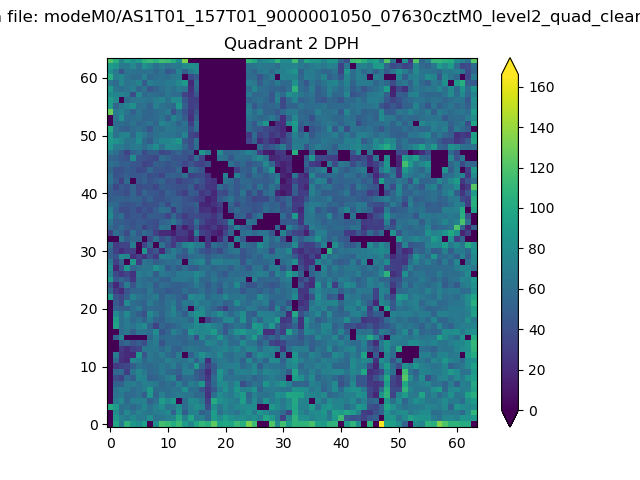 |
Quadrant C |
| Plot type | Count rate plots | Images |
|---|---|---|
| Comparison with Poisson distribution Blue bars denote a histogram of data divided into 1 sec bins. Red curve is a Poisson curve with rate = median count rate of data. |
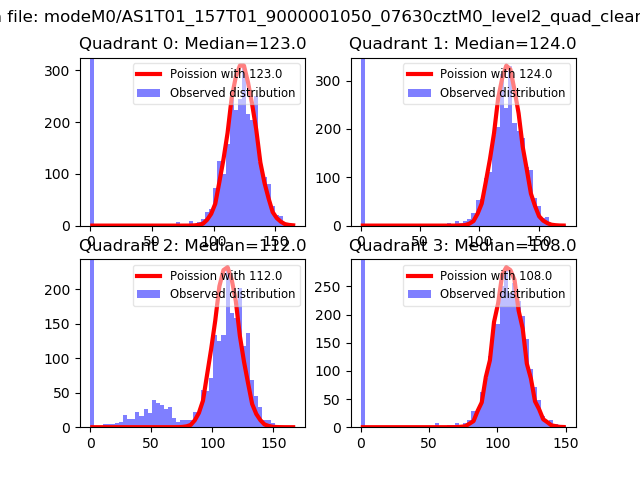 |
 |
| Quadrant-wise count rates Data is divided into 100 sec bins |
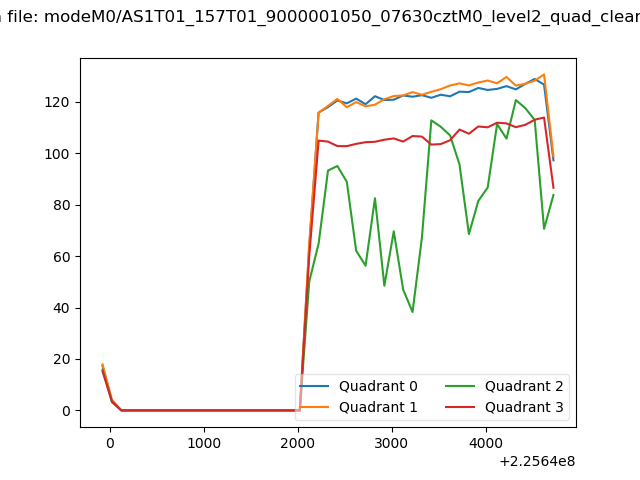 |
|
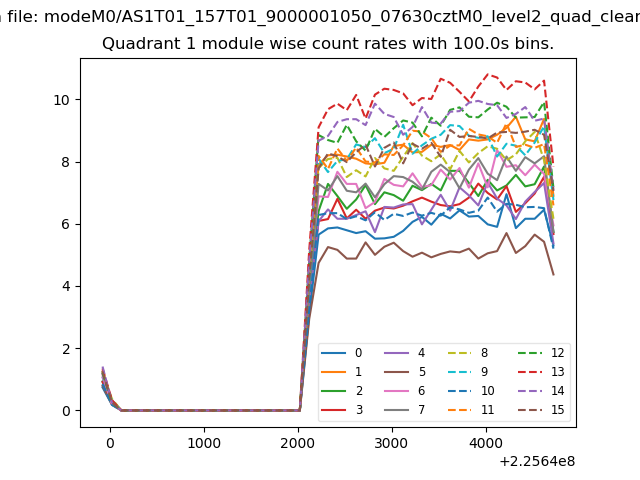
| Module-wise count rates for Quadrant A Data is divided into 100 sec bins |
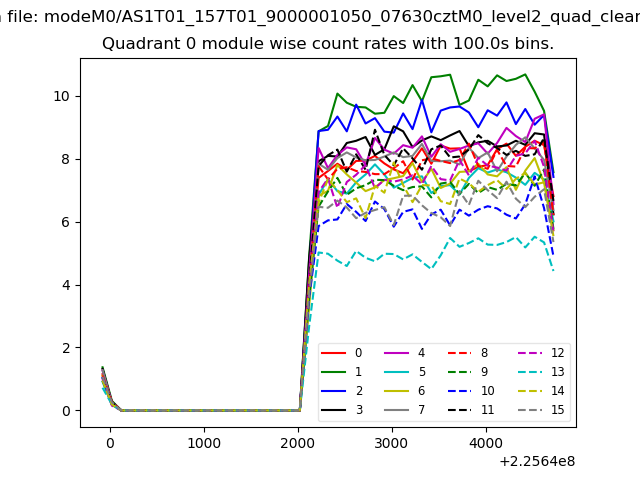 |
 |
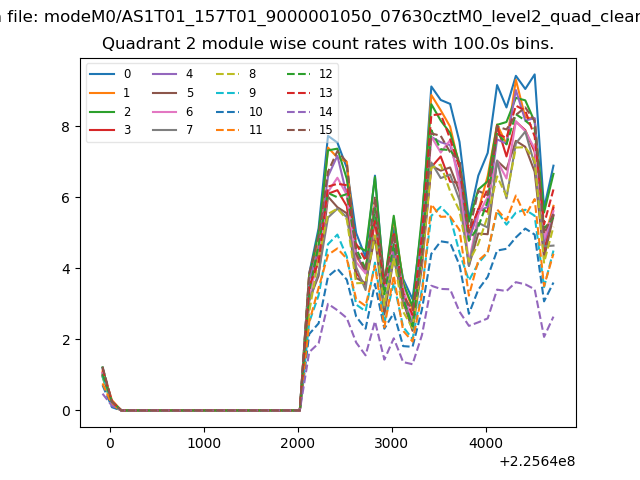
| Module-wise count rates for Quadrant B Data is divided into 100 sec bins |
 |
 |
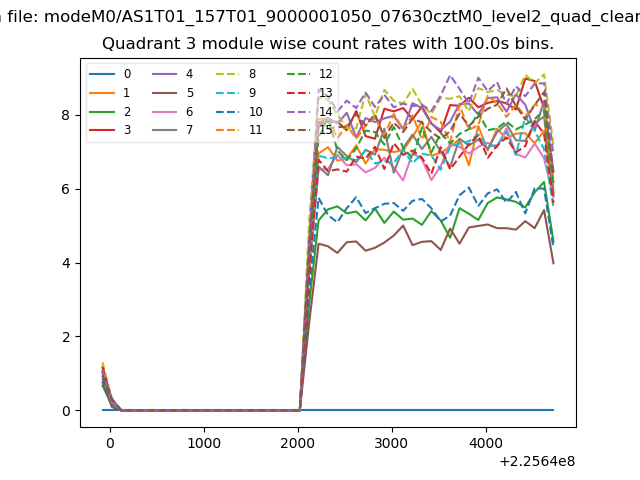
| Module-wise count rates for Quadrant C Data is divided into 100 sec bins |
 |
 |
| Module-wise count rates for Quadrant D Data is divided into 100 sec bins |
 |
 |
| Parameter | Plot |
|---|---|
| CZT HV Monitor | 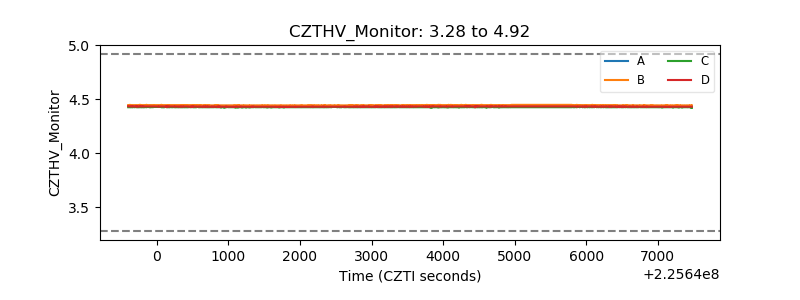 |
| D_VDD | 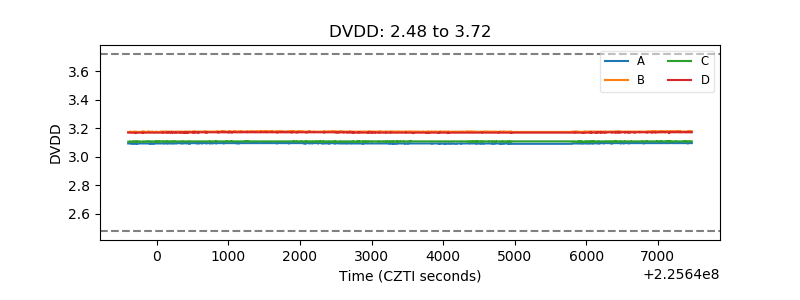 |
| Temperature 1 | 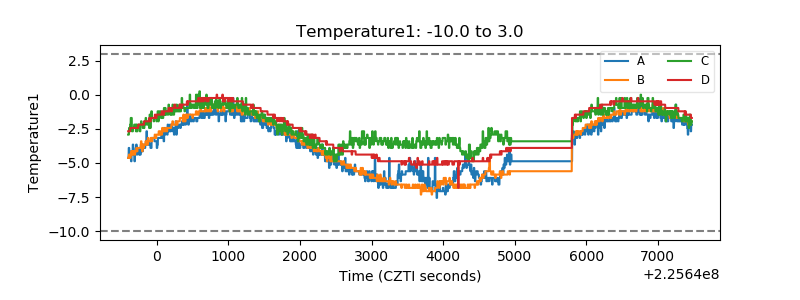 |
| Veto HV Monitor | 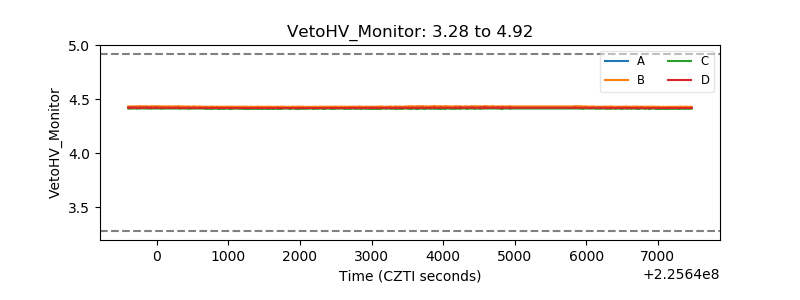 |
| Veto LLD |  |
| Alpha Counter | 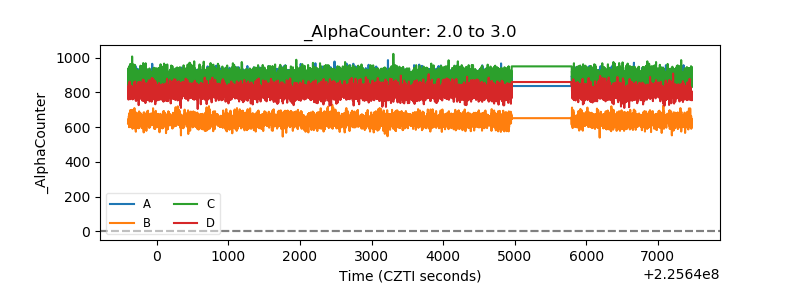 |
| _CPM_Rate | 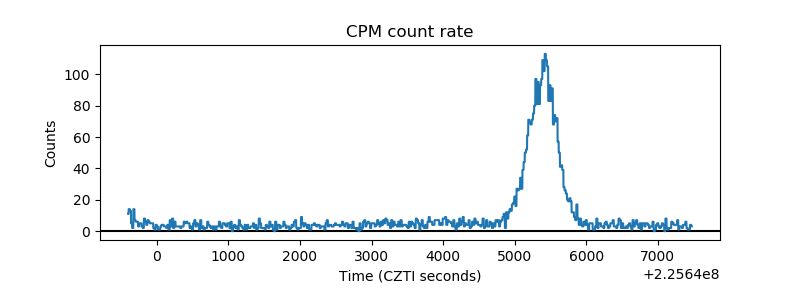 |
| CZT Counter | 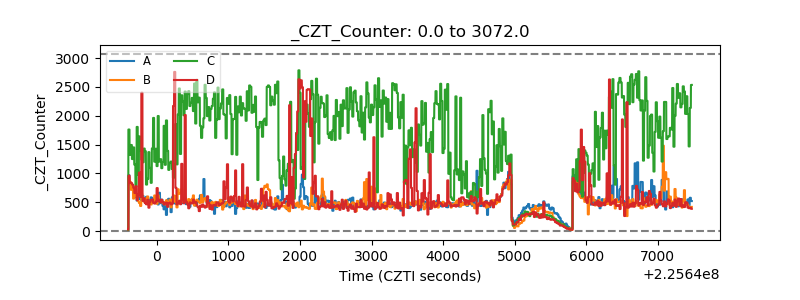 |
| +2.5 Volts monitor |  |
| +5 Volts monitor |  |
| _ROLL_ROT | 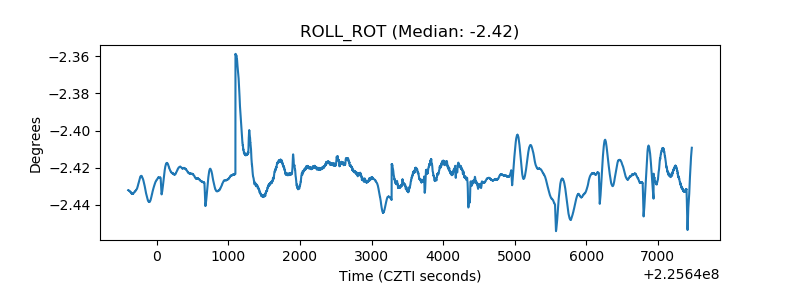 |
| _Roll_DEC | 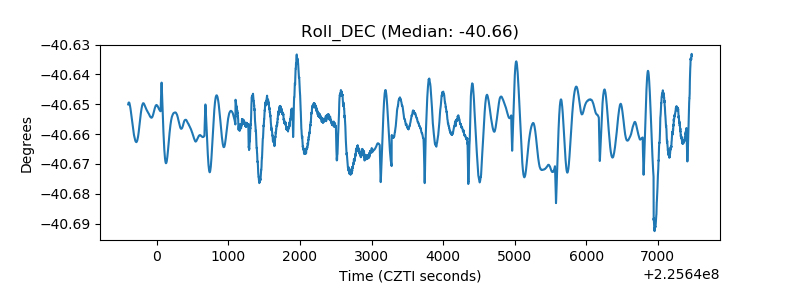 |
| _Roll_RA | 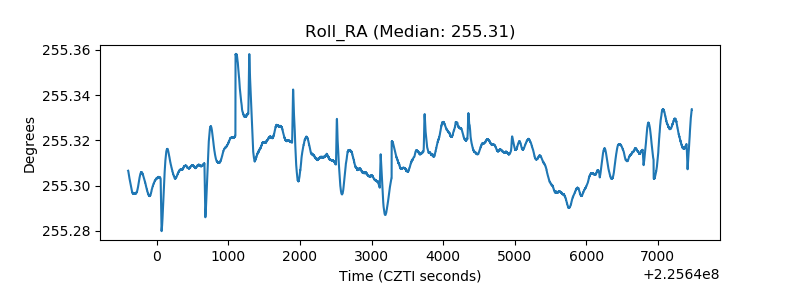 |
| Veto Counter | 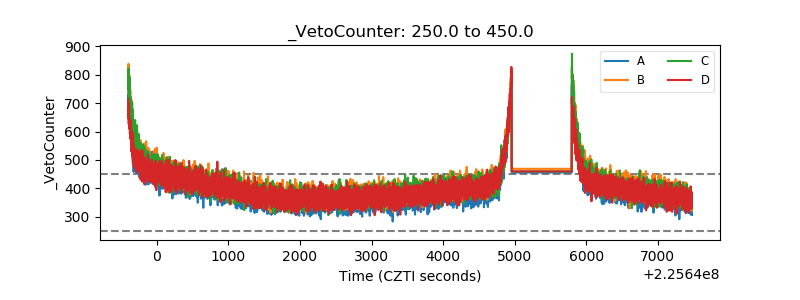 |