| Param | Original file | Final file |
|---|---|---|
| Filename | modeM0/AS1T01_157T01_9000001050_07632cztM0_level2.evt | modeM0/AS1T01_157T01_9000001050_07632cztM0_level2_quad_clean.evt |
| Size (bytes) | 371,649,600 | 27,518,400 |
| Size | 354.4 MB | 26.2 MB |
| Events in quadrant A | 1,712,824 | 156,184 |
| Events in quadrant B | 1,598,072 | 159,104 |
| Events in quadrant C | 5,736,877 | 142,121 |
| Events in quadrant D | 1,991,595 | 149,975 |
| Mode SS | |||
|---|---|---|---|
| Quadrant | BADHDUFLAG | Total packets | Discarded packets |
| A | 0 | 66 | 0 |
| B | 0 | 66 | 0 |
| C | 0 | 66 | 0 |
| D | 0 | 66 | 0 |
| Mode M0 | |||
|---|---|---|---|
| Quadrant | BADHDUFLAG | Total packets | Discarded packets |
| A | 0 | 7239 | 1 |
| B | 0 | 6816 | 1 |
| C | 0 | 19226 | 1 |
| D | 0 | 8102 | 1 |
| Mode M9 | |||
|---|---|---|---|
| Quadrant | BADHDUFLAG | Total packets | Discarded packets |
| A | 0 | 4 | 0 |
| B | 0 | 4 | 0 |
| C | 0 | 4 | 0 |
| D | 0 | 4 | 0 |
| Quadrant | Total seconds | Saturated seconds | Saturation percentage |
|---|---|---|---|
| A | 3163 | 211 | 6.670882% |
| B | 3163 | 151 | 4.773949% |
| C | 3163 | 1436 | 45.399937% |
| D | 3163 | 200 | 6.323111% |
Noise dominated data is calculated using 1-second bins in cleaned event files. If a bin has >2000 counts, and if more than 50% of those come from <1% of pixels, then it is considered to be noise-dominated and hence unusable.
| Quadrant | # 1 sec bins | Bins with >0 counts | Bins with >2000 counts | High rate bins dominated by noise | Noise dominated (total time) | Noise dominated (detector-on time) | Marked lightcurve |
|---|---|---|---|---|---|---|---|
| A | 3543 | 3164 | 19 | 19 | 0.54% | 0.60% | 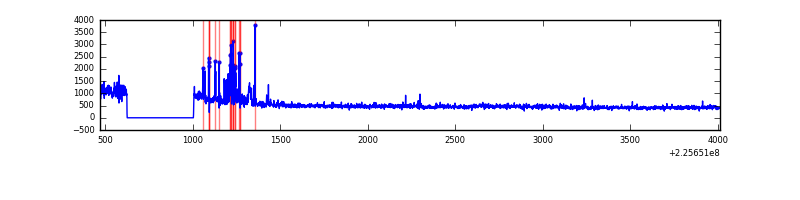 |
| B | 3543 | 3164 | 0 | 0 | 0.00% | 0.00% | 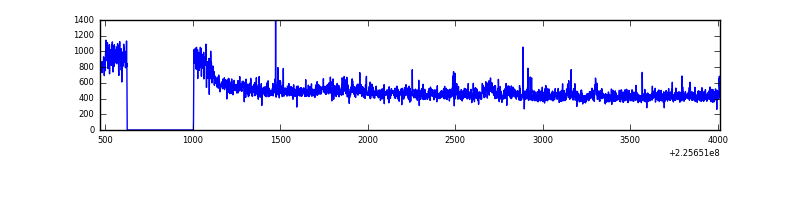 |
| C | 3543 | 3164 | 1171 | 1171 | 33.05% | 37.01% | 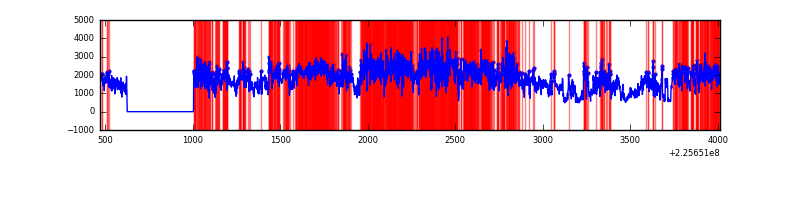 |
| D | 3543 | 3164 | 82 | 82 | 2.31% | 2.59% | 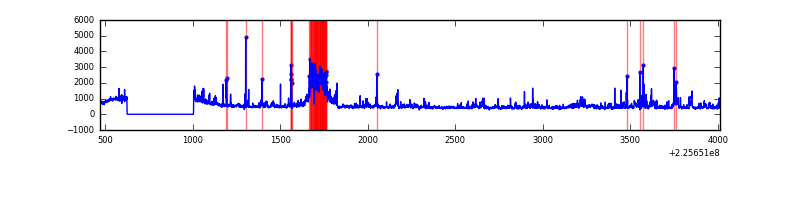 |
Top three noisy pixels from each quadrant. If the there are fewer than three noisy pixels in the level2.evt file, extra rows are filled as -1
| Pixel properties | Quadrant properties | ||||||
|---|---|---|---|---|---|---|---|
| Quadrant | DetID | PixID | Counts | Sigma | Mean | Median | Sigma |
| A | 13 | 251 | 145007 | 1773.66 | 387 | 377 | 81.5 |
| A | 15 | 234 | 69605 | 848.97 | 387 | 377 | 81.5 |
| A | 3 | 1 | 8729 | 102.42 | 387 | 377 | 81.5 |
| B | 0 | 219 | 39572 | 502.34 | 392 | 382 | 78.0 |
| B | 0 | 214 | 9412 | 115.75 | 392 | 382 | 78.0 |
| B | 12 | 111 | 7224 | 87.7 | 392 | 382 | 78.0 |
| C | 9 | 68 | 2255824 | 29151.42 | 324 | 325 | 77.4 |
| C | 9 | 243 | 2155269 | 27851.79 | 324 | 325 | 77.4 |
| C | 1 | 16 | 38185 | 489.33 | 324 | 325 | 77.4 |
| D | 1 | 83 | 222057 | 2375.3 | 374 | 363 | 93.3 |
| D | 2 | 152 | 70055 | 746.7 | 374 | 363 | 93.3 |
| D | 13 | 104 | 66945 | 713.38 | 374 | 363 | 93.3 |
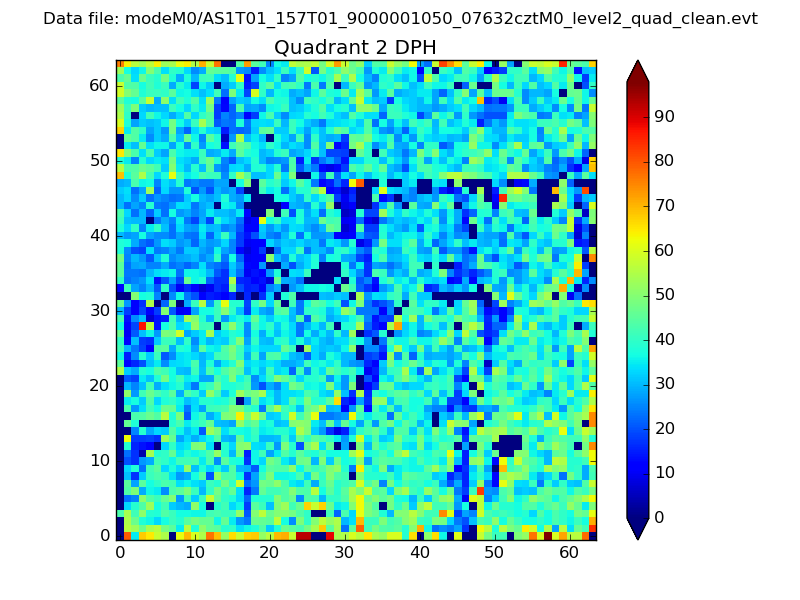
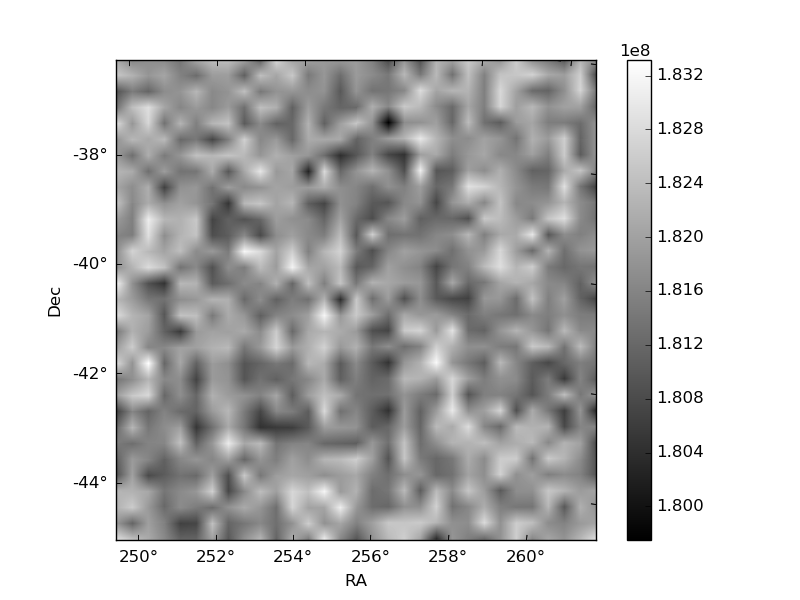
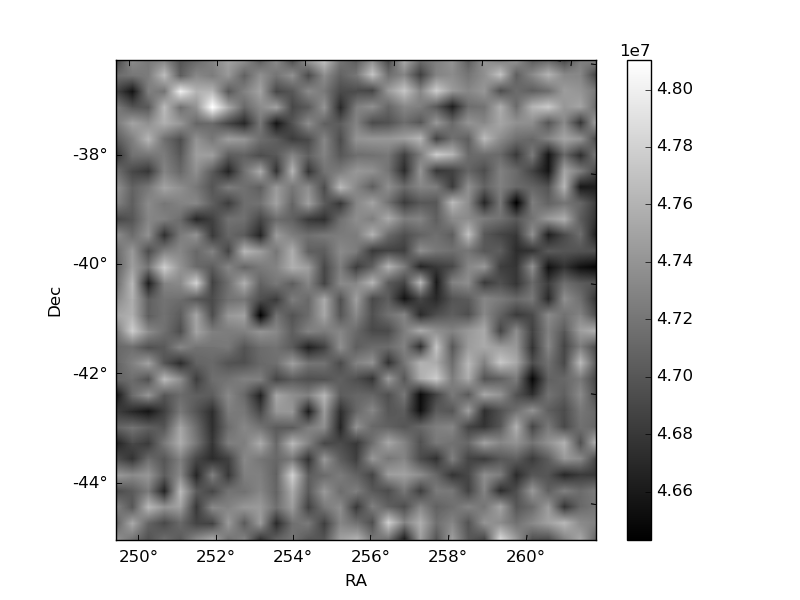
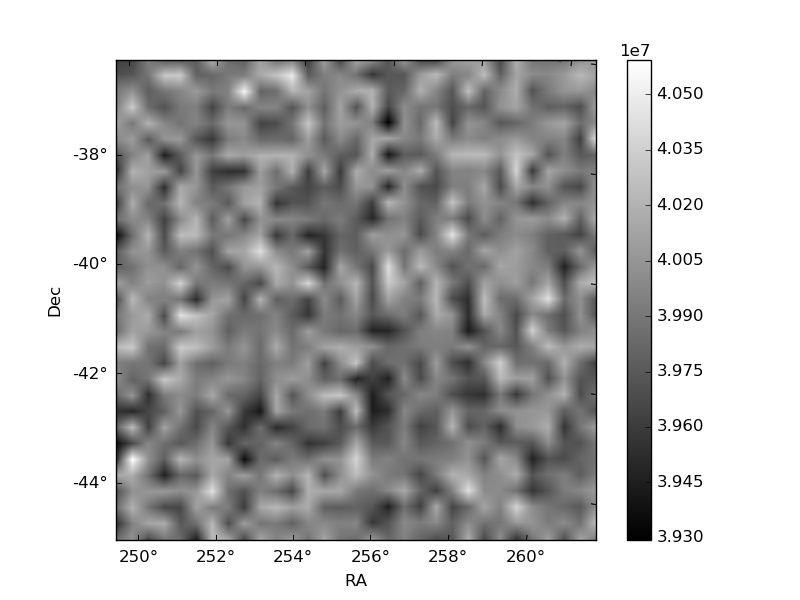
Histogram calculated using DETX and DETY for each event in the final _common_clean file
| Quadrant A | 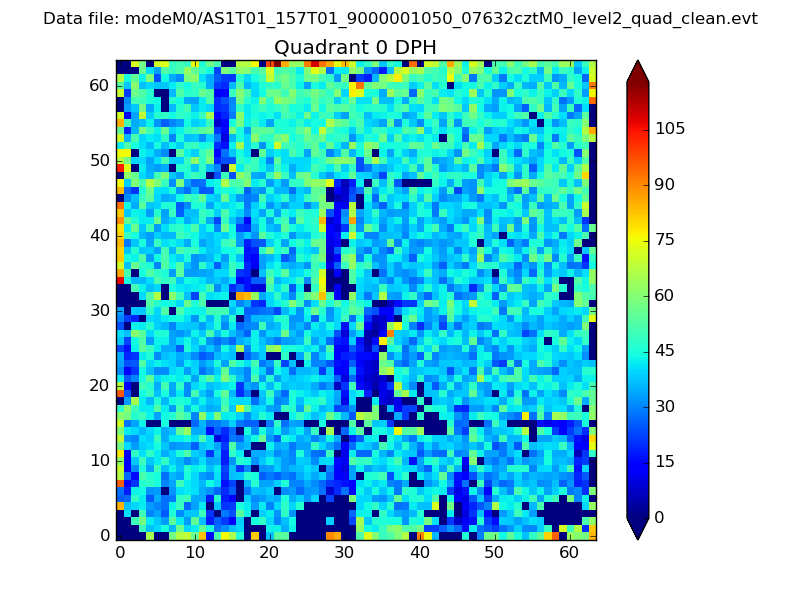 |
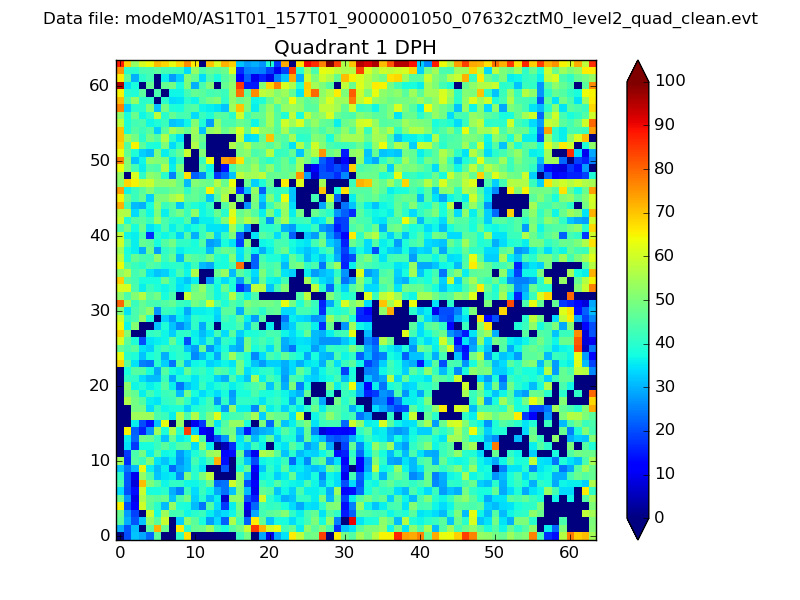 |
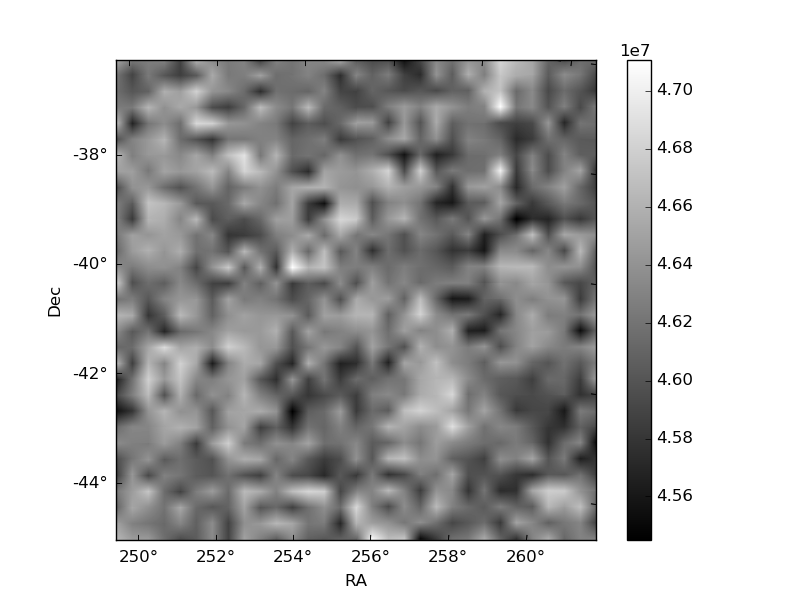
Quadrant B |
|---|---|---|---|
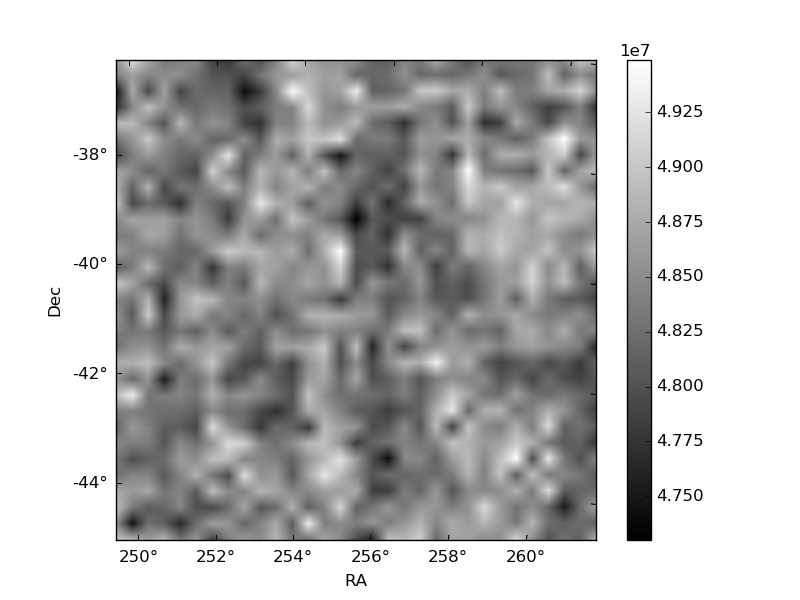
| Quadrant D | 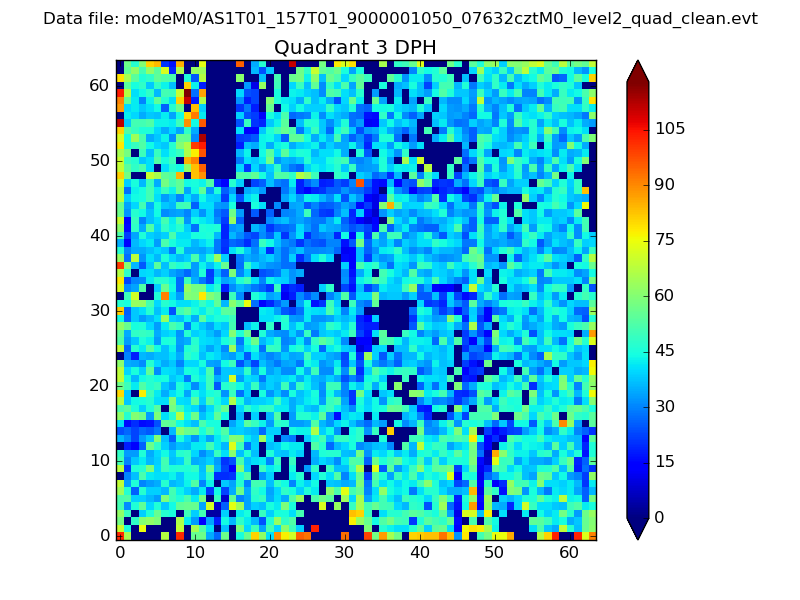 |
 |
Quadrant C |
| Plot type | Count rate plots | Images |
|---|---|---|
| Comparison with Poisson distribution Blue bars denote a histogram of data divided into 1 sec bins. Red curve is a Poisson curve with rate = median count rate of data. |
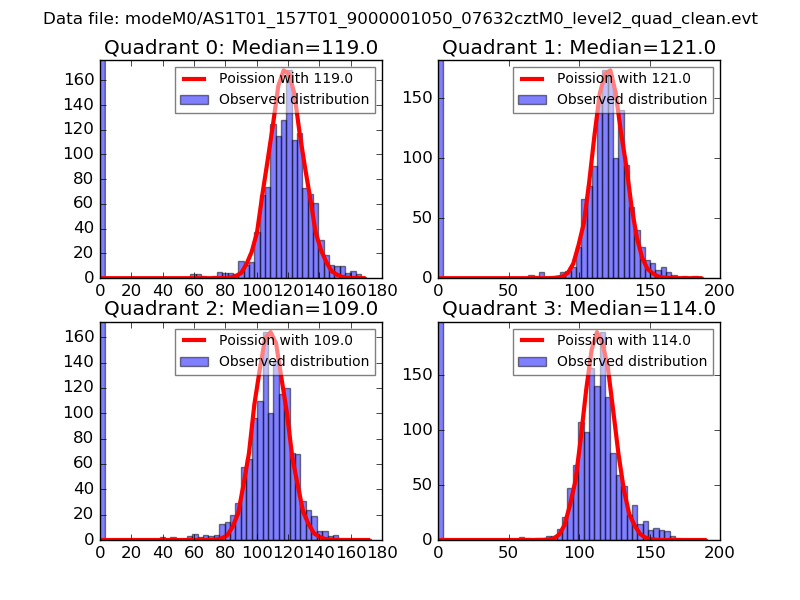 |
 |
| Quadrant-wise count rates Data is divided into 100 sec bins |
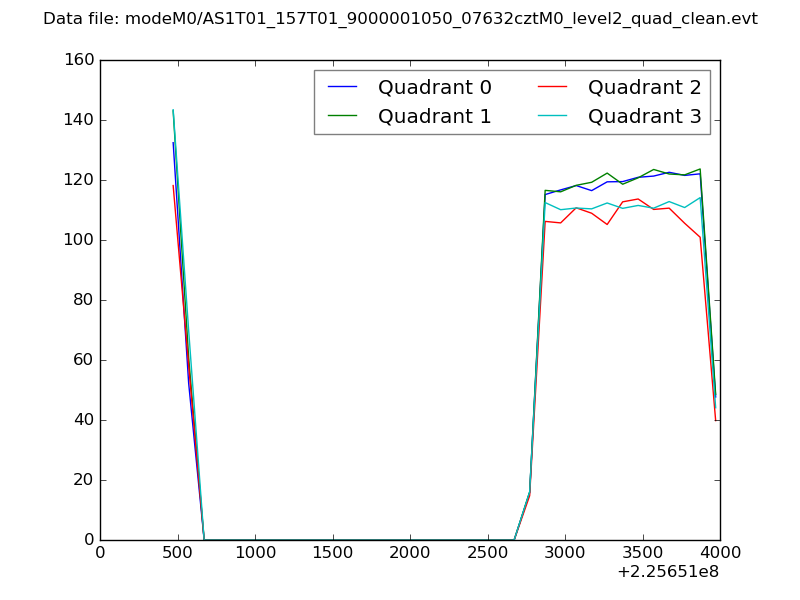 |
|
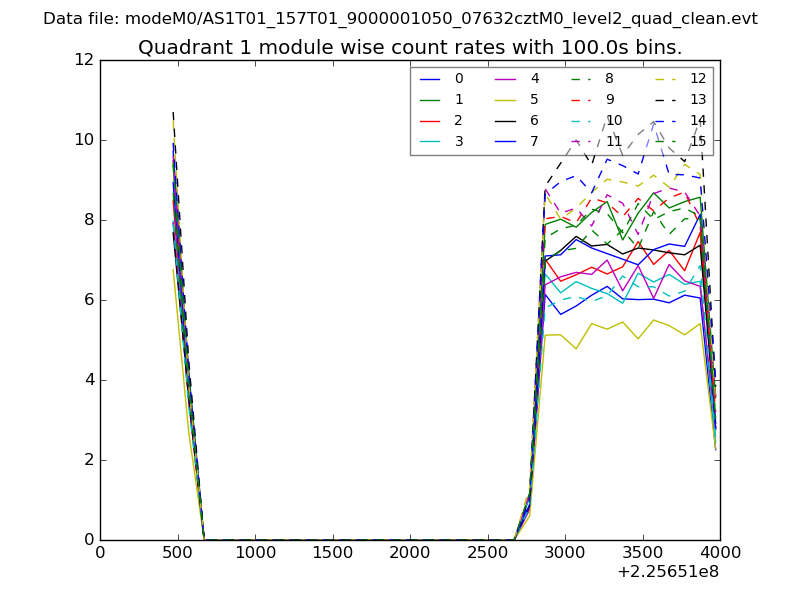
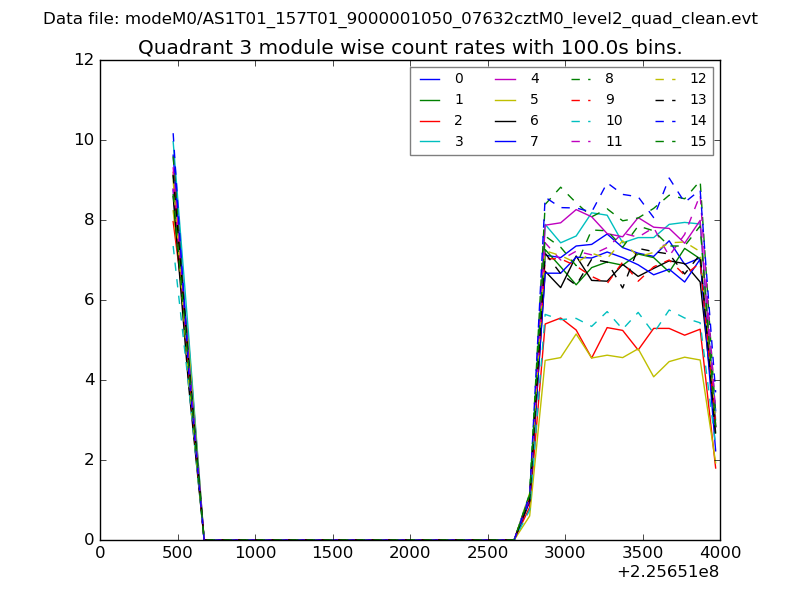
| Module-wise count rates for Quadrant A Data is divided into 100 sec bins |
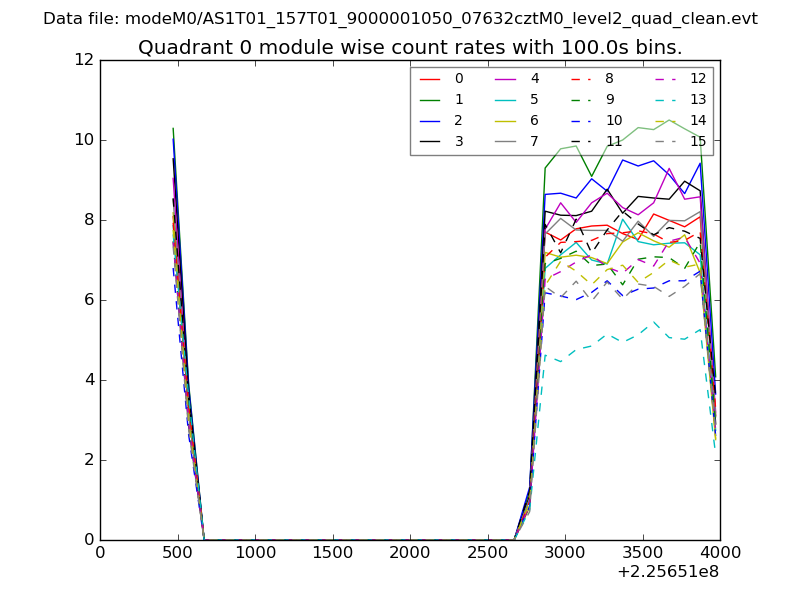 |
 |
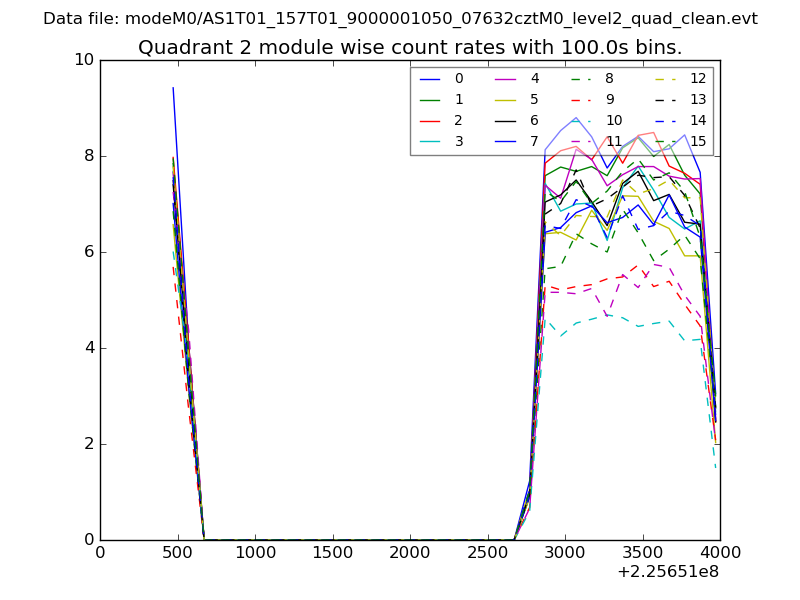
| Module-wise count rates for Quadrant B Data is divided into 100 sec bins |
 |
 |
| Module-wise count rates for Quadrant C Data is divided into 100 sec bins |
 |
 |
| Module-wise count rates for Quadrant D Data is divided into 100 sec bins |
 |
 |
| Parameter | Plot |
|---|---|
| CZT HV Monitor | 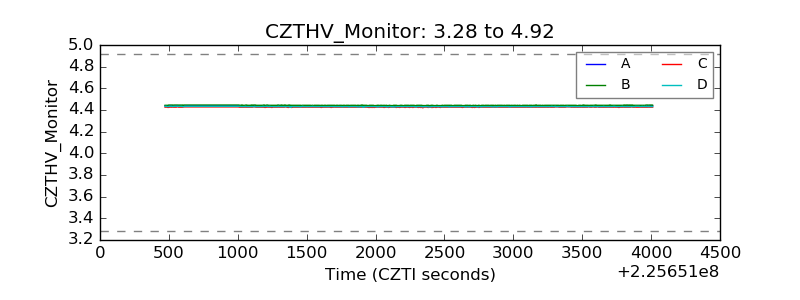 |
| D_VDD | 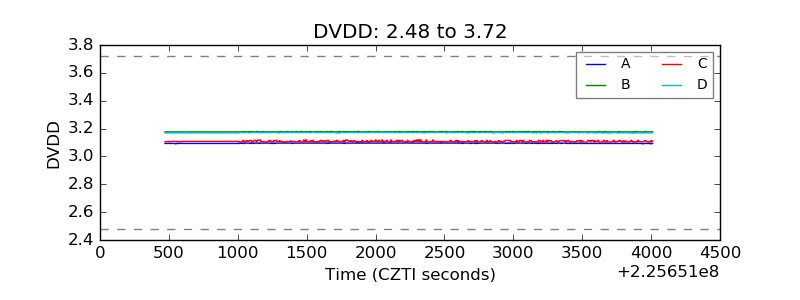 |
| Temperature 1 | 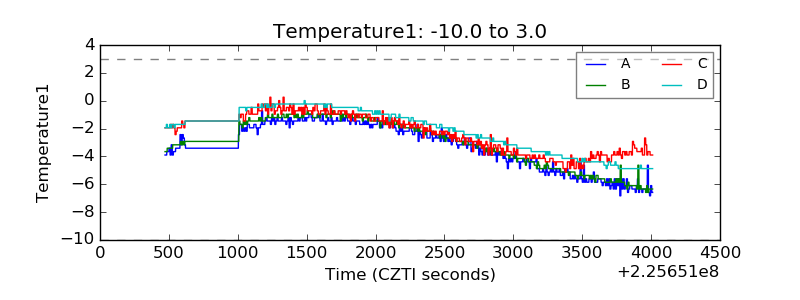 |
| Veto HV Monitor | 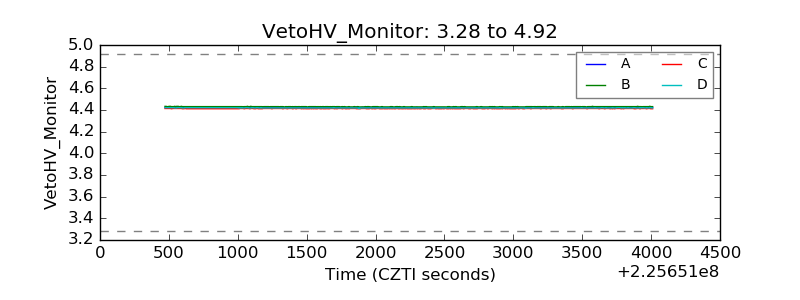 |
| Veto LLD |  |
| Alpha Counter | 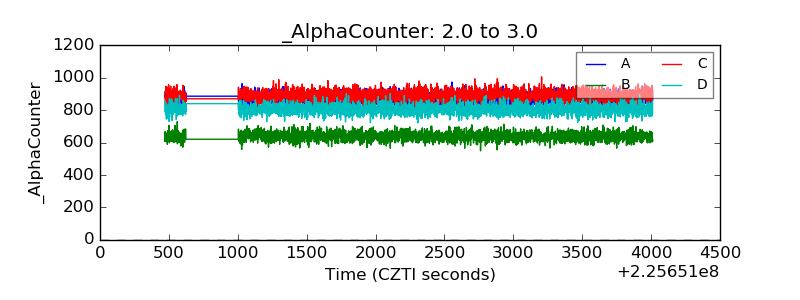 |
| _CPM_Rate | 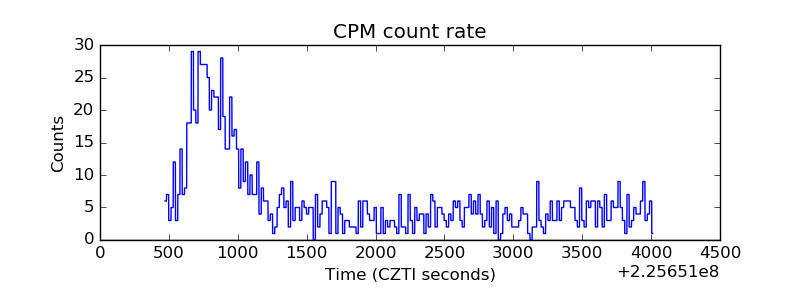 |
| CZT Counter | 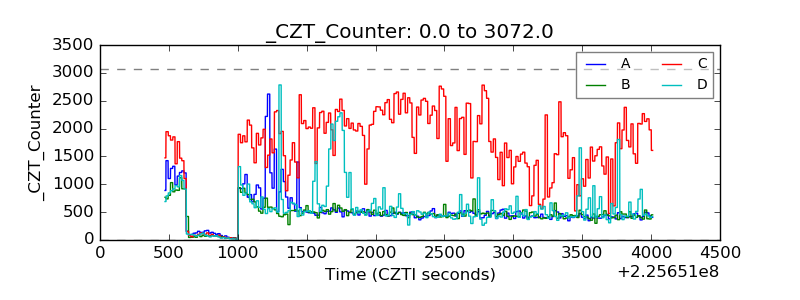 |
| +2.5 Volts monitor |  |
| +5 Volts monitor |  |
| _ROLL_ROT | 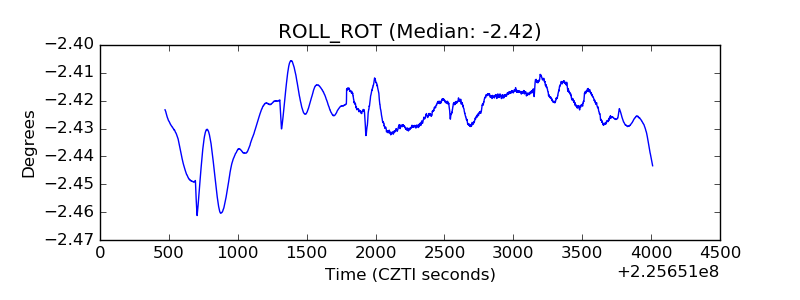 |
| _Roll_DEC | 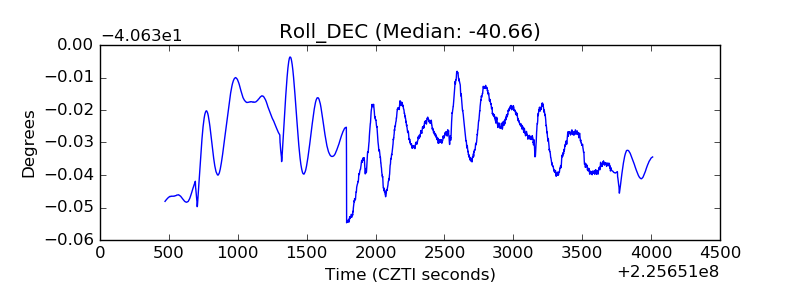 |
| _Roll_RA | 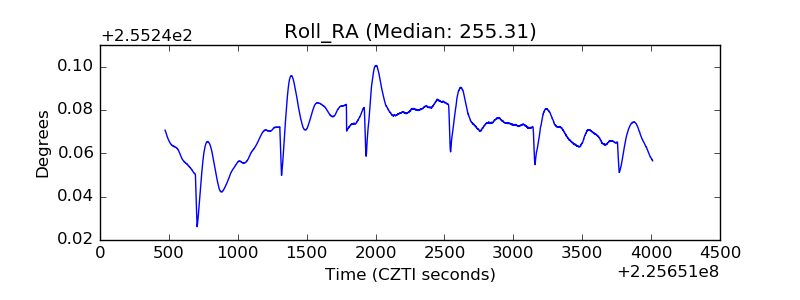 |
| Veto Counter | 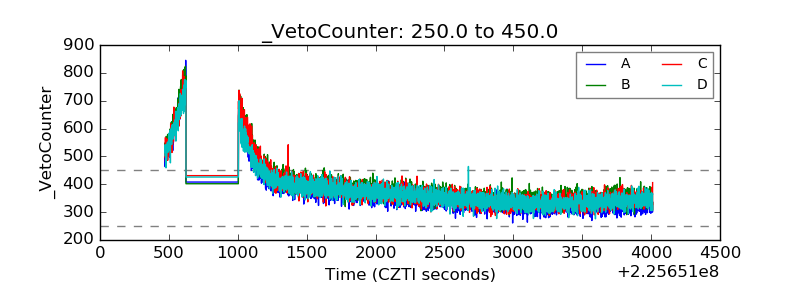 |