| Param | Original file | Final file |
|---|---|---|
| Filename | modeM0/AS1G06_124T01_9000001054_07642cztM0_level2.evt | modeM0/AS1G06_124T01_9000001054_07642cztM0_level2_quad_clean.evt |
| Size (bytes) | 106,597,440 | 7,724,160 |
| Size | 101.7 MB | 7.4 MB |
| Events in quadrant A | 707,528 | 35,446 |
| Events in quadrant B | 723,718 | 36,384 |
| Events in quadrant C | 903,747 | 34,420 |
| Events in quadrant D | 805,970 | 33,199 |
| Mode SS | |||
|---|---|---|---|
| Quadrant | BADHDUFLAG | Total packets | Discarded packets |
| A | 0 | 26 | 0 |
| B | 0 | 26 | 0 |
| C | 0 | 26 | 0 |
| D | 0 | 26 | 0 |
| Mode M9 | |||
|---|---|---|---|
| Quadrant | BADHDUFLAG | Total packets | Discarded packets |
| A | 0 | 4 | 0 |
| B | 0 | 4 | 0 |
| C | 0 | 4 | 0 |
| D | 0 | 4 | 0 |
| Mode M0 | |||
|---|---|---|---|
| Quadrant | BADHDUFLAG | Total packets | Discarded packets |
| A | 0 | 2801 | 2 |
| B | 0 | 2871 | 1 |
| C | 0 | 3634 | 1 |
| D | 0 | 3137 | 1 |
| Quadrant | Total seconds | Saturated seconds | Saturation percentage |
|---|---|---|---|
| A | 1239 | 16 | 1.291364% |
| B | 1239 | 18 | 1.452785% |
| C | 1239 | 17 | 1.372074% |
| D | 1239 | 34 | 2.744149% |
Noise dominated data is calculated using 1-second bins in cleaned event files. If a bin has >2000 counts, and if more than 50% of those come from <1% of pixels, then it is considered to be noise-dominated and hence unusable.
| Quadrant | # 1 sec bins | Bins with >0 counts | Bins with >2000 counts | High rate bins dominated by noise | Noise dominated (total time) | Noise dominated (detector-on time) | Marked lightcurve |
|---|---|---|---|---|---|---|---|
| A | 1239 | 1239 | 0 | 0 | 0.00% | 0.00% | 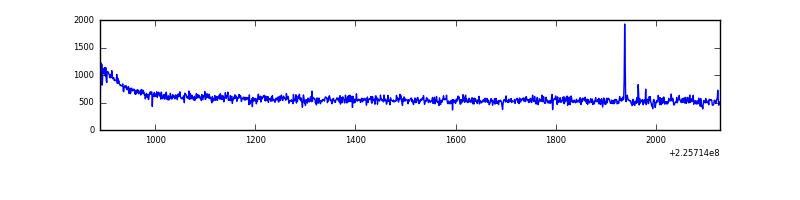 |
| B | 1239 | 1239 | 0 | 0 | 0.00% | 0.00% | 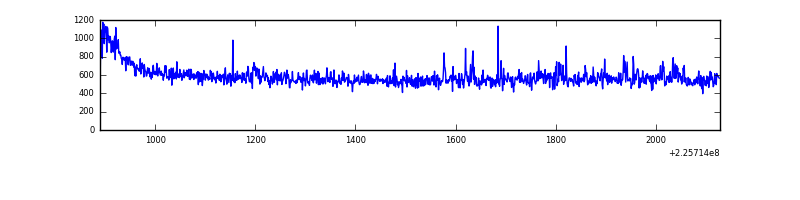 |
| C | 1239 | 1239 | 0 | 0 | 0.00% | 0.00% | 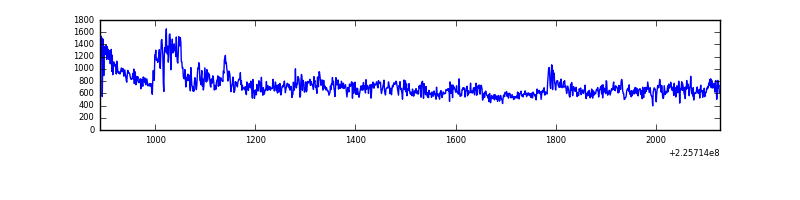 |
| D | 1239 | 1239 | 8 | 8 | 0.65% | 0.65% |  |
Top three noisy pixels from each quadrant. If the there are fewer than three noisy pixels in the level2.evt file, extra rows are filled as -1
| Pixel properties | Quadrant properties | ||||||
|---|---|---|---|---|---|---|---|
| Quadrant | DetID | PixID | Counts | Sigma | Mean | Median | Sigma |
| A | 0 | 128 | 3790 | 94.51 | 182 | 177 | 38.2 |
| A | 15 | 63 | 2998 | 73.79 | 182 | 177 | 38.2 |
| A | 0 | 226 | 1724 | 40.47 | 182 | 177 | 38.2 |
| B | 0 | 214 | 12262 | 335.26 | 180 | 177 | 36.0 |
| B | 0 | 219 | 7617 | 206.4 | 180 | 177 | 36.0 |
| B | 12 | 111 | 3331 | 87.5 | 180 | 177 | 36.0 |
| C | 1 | 16 | 209080 | 4986.36 | 176 | 177 | 41.9 |
| C | 9 | 68 | 7768 | 181.19 | 176 | 177 | 41.9 |
| C | 13 | 61 | 1301 | 26.83 | 176 | 177 | 41.9 |
| D | 2 | 152 | 68399 | 1492.59 | 178 | 173 | 45.7 |
| D | 2 | 14 | 21069 | 457.14 | 178 | 173 | 45.7 |
| D | 14 | 34 | 18293 | 396.41 | 178 | 173 | 45.7 |
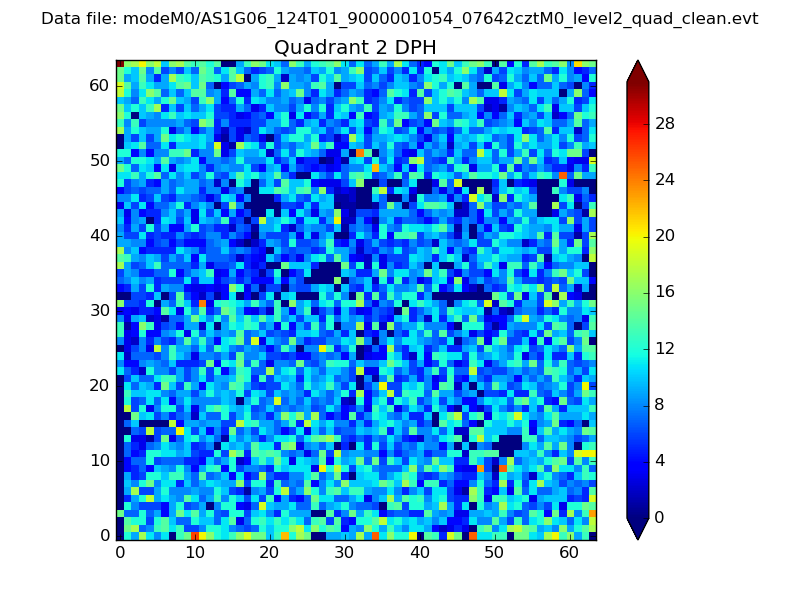
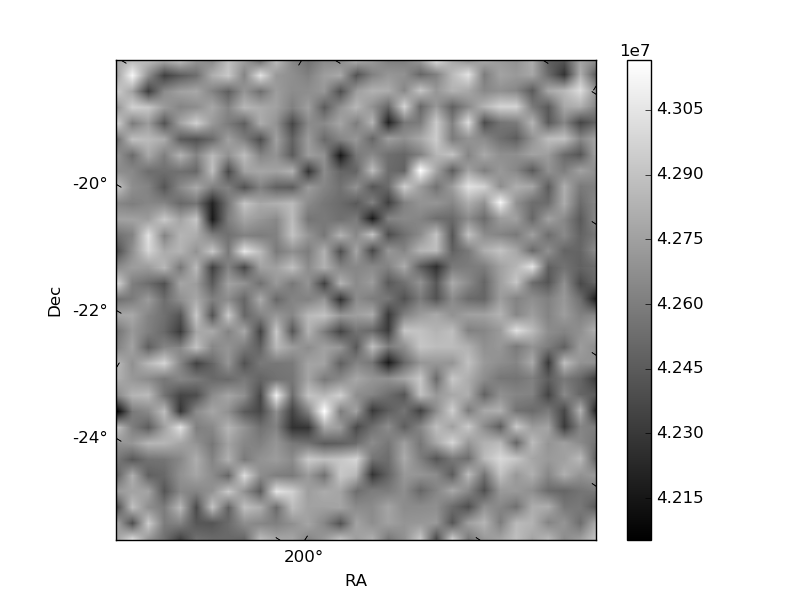
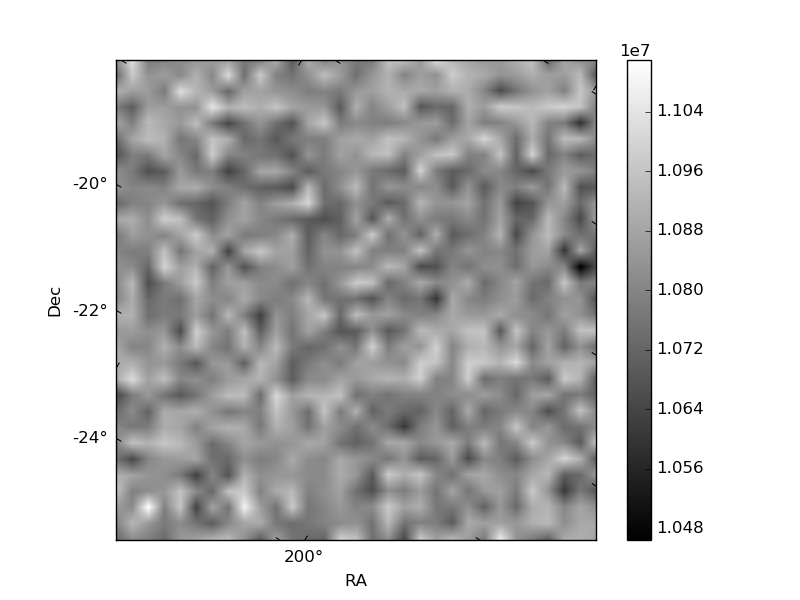
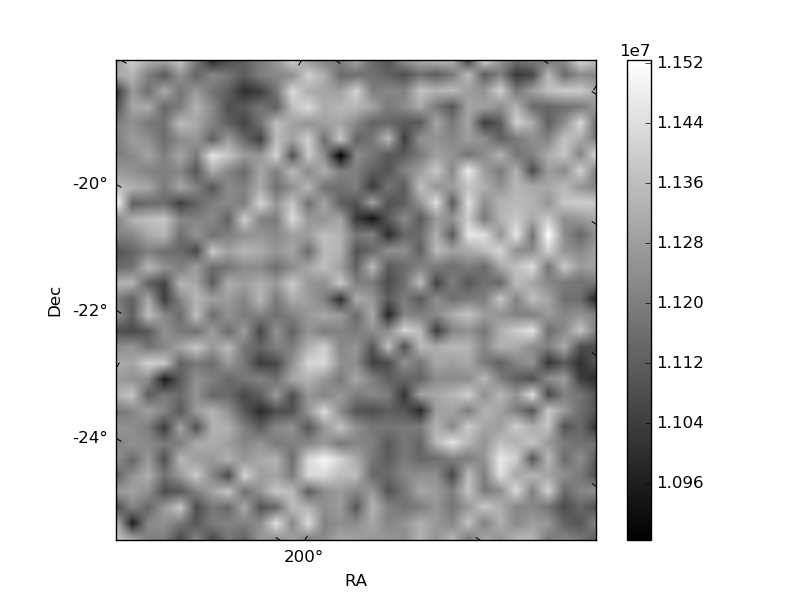
Histogram calculated using DETX and DETY for each event in the final _common_clean file
| Quadrant A | 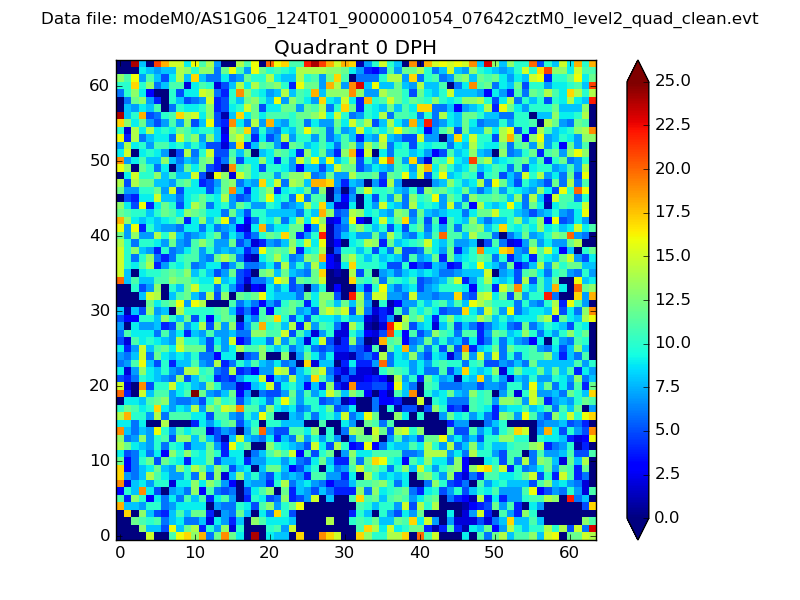 |
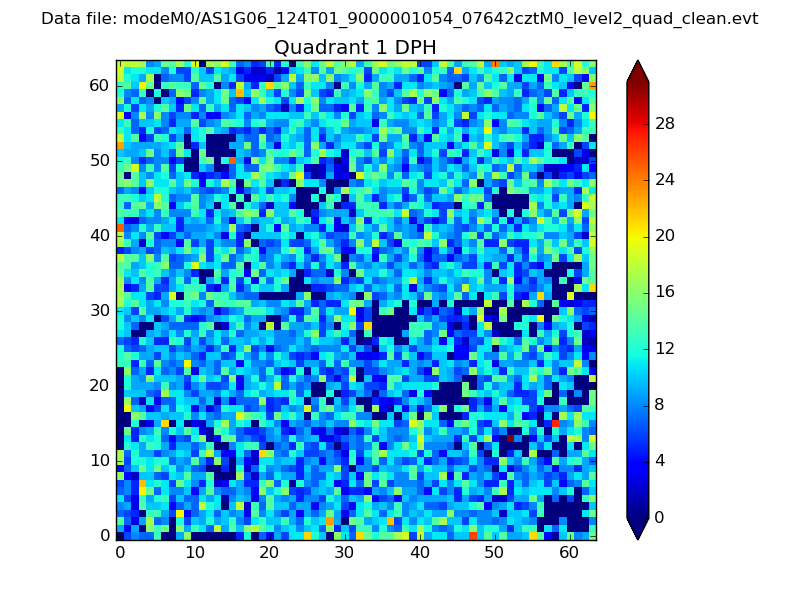 |
Quadrant B |
|---|---|---|---|
| Quadrant D | 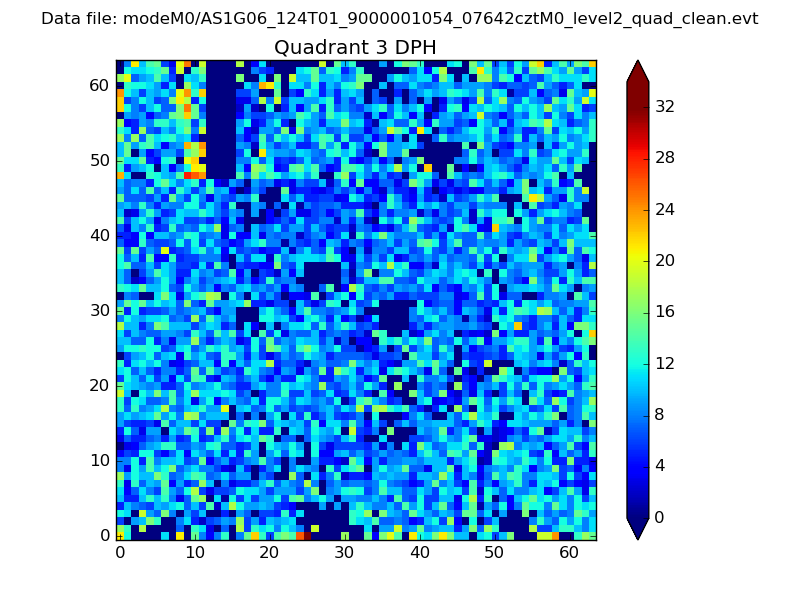 |
 |
Quadrant C |
| Plot type | Count rate plots | Images |
|---|---|---|
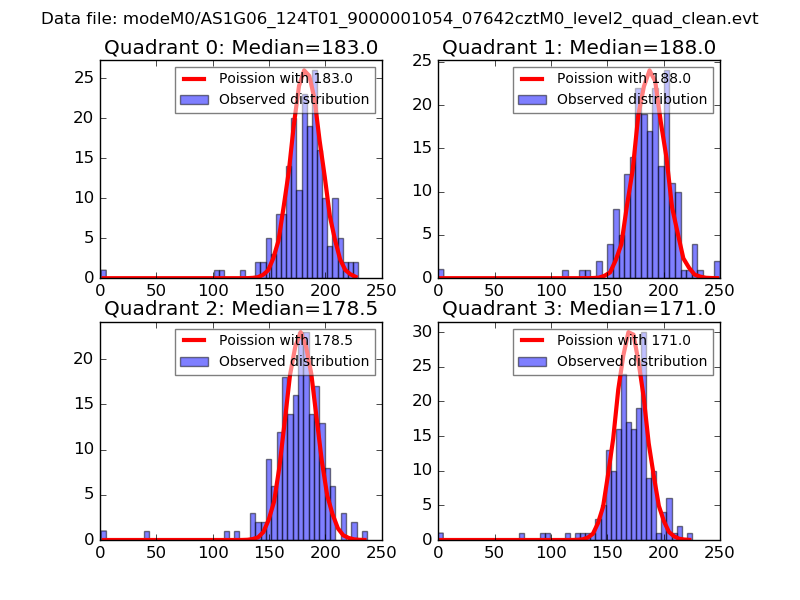
| Comparison with Poisson distribution Blue bars denote a histogram of data divided into 1 sec bins. Red curve is a Poisson curve with rate = median count rate of data. |
 |
 |
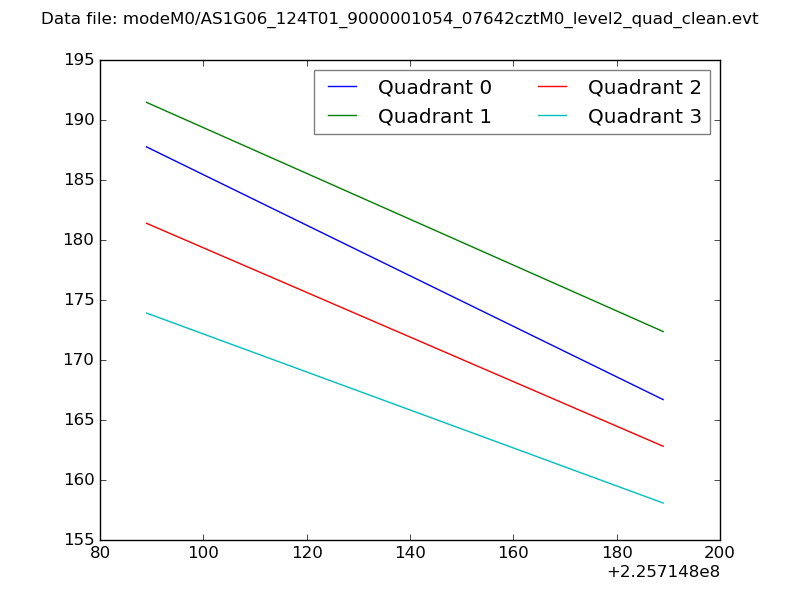
| Quadrant-wise count rates Data is divided into 100 sec bins |
 |
|
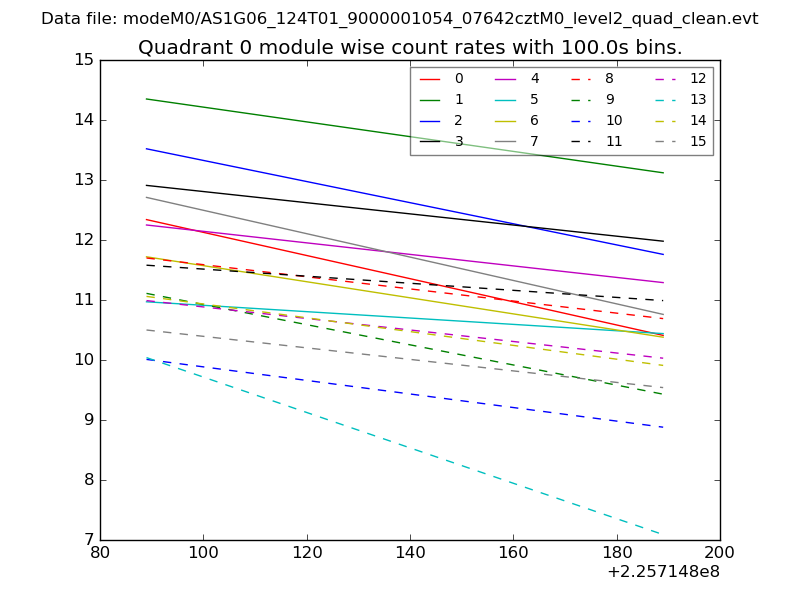
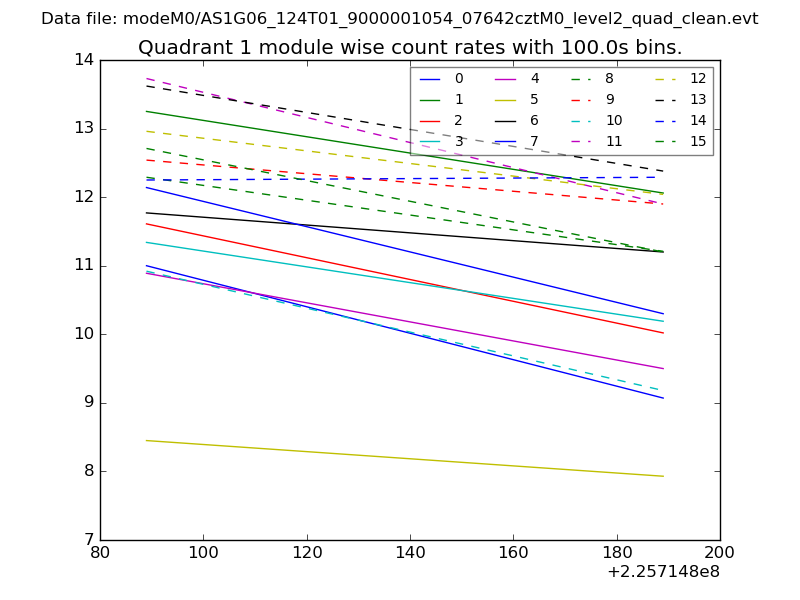
| Module-wise count rates for Quadrant A Data is divided into 100 sec bins |
 |
 |
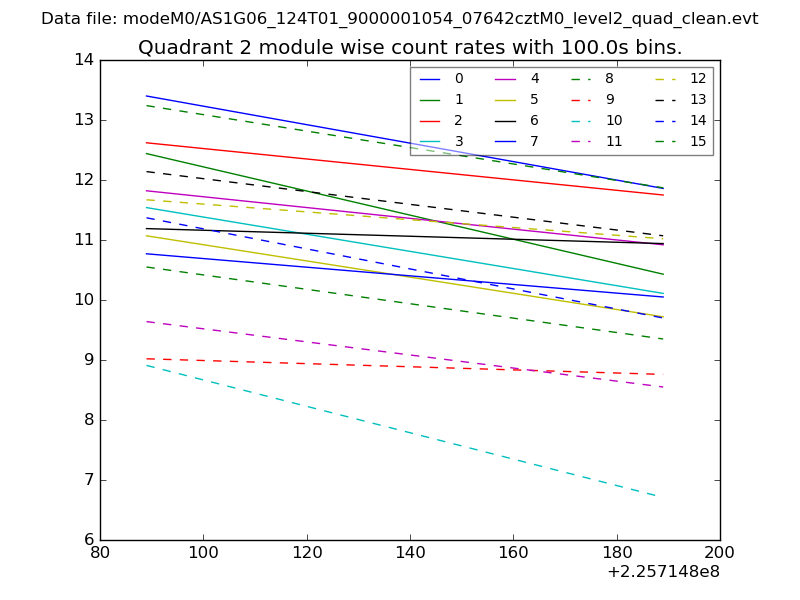
| Module-wise count rates for Quadrant B Data is divided into 100 sec bins |
 |
 |
| Module-wise count rates for Quadrant C Data is divided into 100 sec bins |
 |
 |
| Module-wise count rates for Quadrant D Data is divided into 100 sec bins |
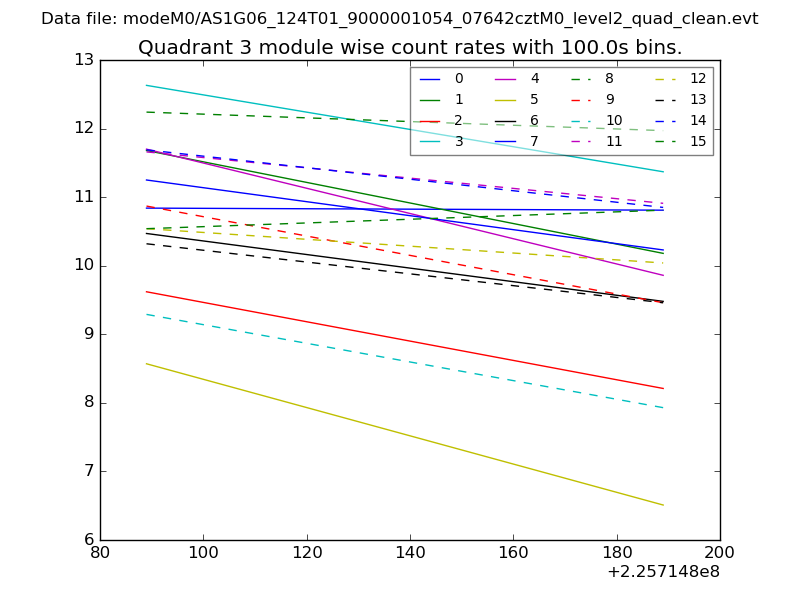 |
 |
| Parameter | Plot |
|---|---|
| CZT HV Monitor | 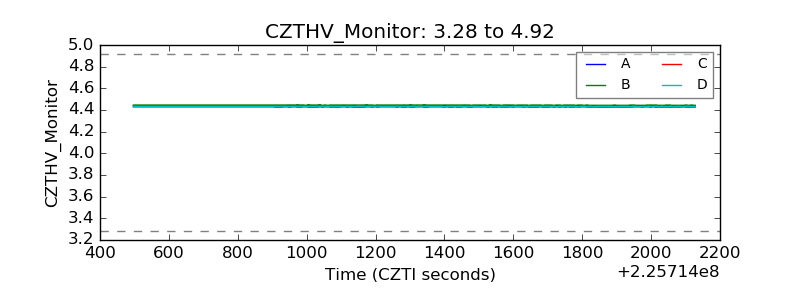 |
| D_VDD | 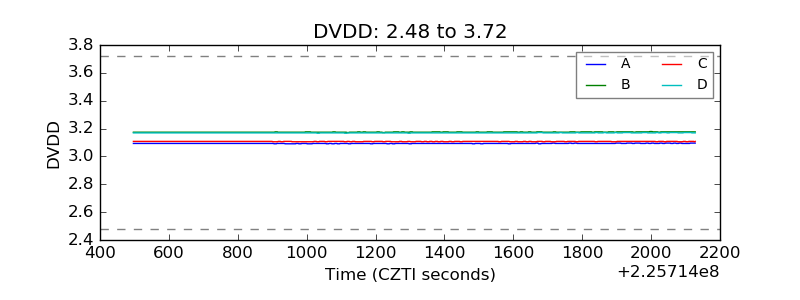 |
| Temperature 1 | 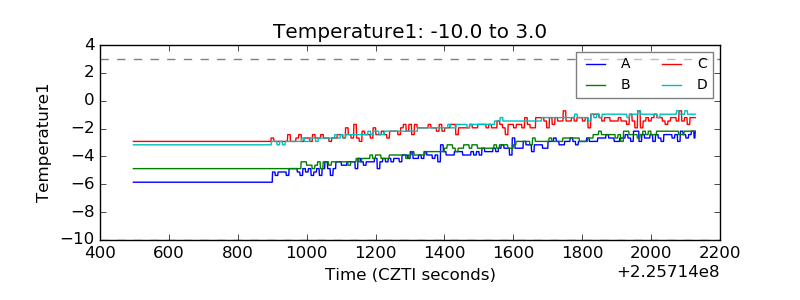 |
| Veto HV Monitor | 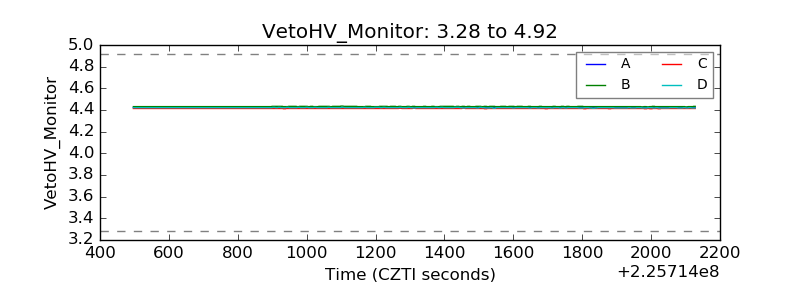 |
| Veto LLD | 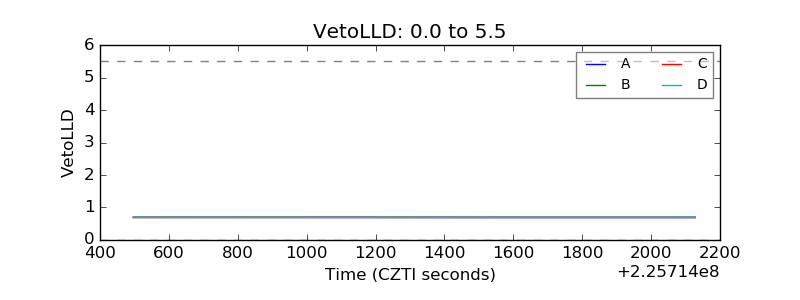 |
| Alpha Counter | 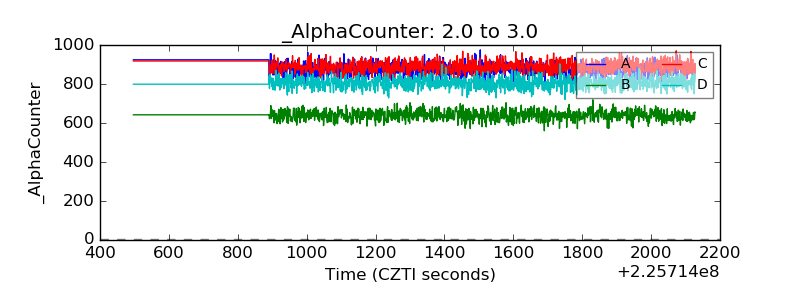 |
| _CPM_Rate | 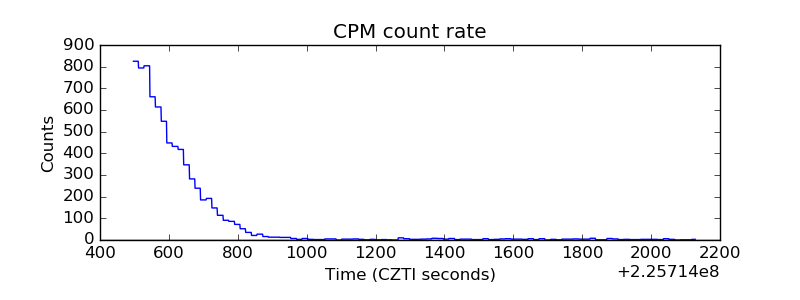 |
| CZT Counter | 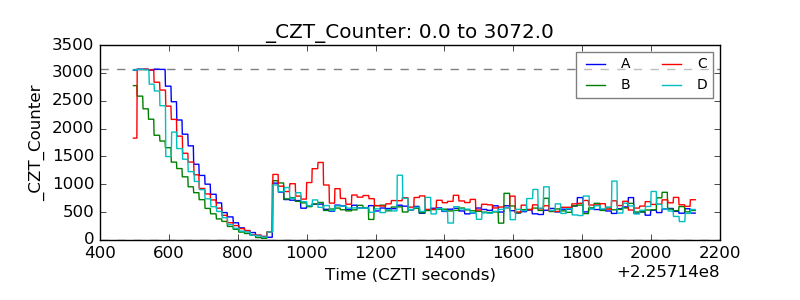 |
| +2.5 Volts monitor | 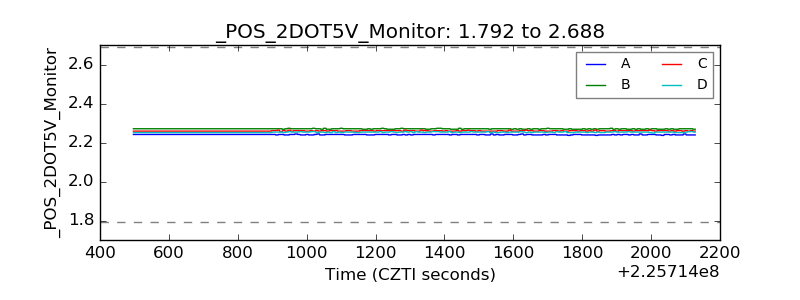 |
| +5 Volts monitor | 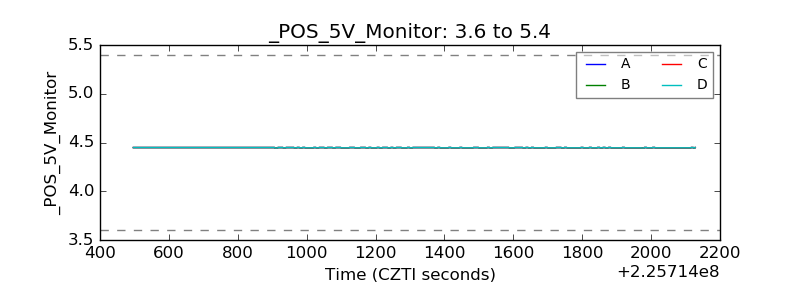 |
| _ROLL_ROT |  |
| _Roll_DEC | 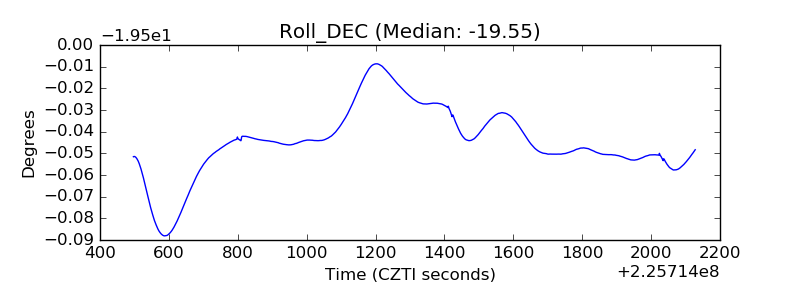 |
| _Roll_RA | 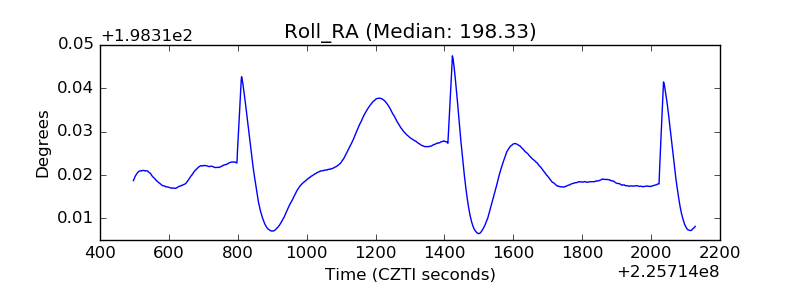 |
| Veto Counter | 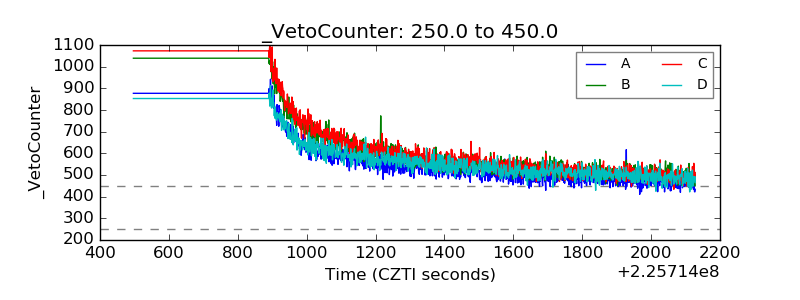 |