| Param | Original file | Final file |
|---|---|---|
| Filename | modeM0/AS1G06_124T01_9000001054_07643cztM0_level2.evt | modeM0/AS1G06_124T01_9000001054_07643cztM0_level2_quad_clean.evt |
| Size (bytes) | 464,186,880 | 63,296,640 |
| Size | 442.7 MB | 60.4 MB |
| Events in quadrant A | 3,307,906 | 371,608 |
| Events in quadrant B | 3,301,131 | 375,704 |
| Events in quadrant C | 3,489,536 | 371,810 |
| Events in quadrant D | 3,530,900 | 357,136 |
| Mode SS | |||
|---|---|---|---|
| Quadrant | BADHDUFLAG | Total packets | Discarded packets |
| A | 0 | 130 | 0 |
| B | 0 | 130 | 0 |
| C | 0 | 130 | 0 |
| D | 0 | 130 | 0 |
| Mode M9 | |||
|---|---|---|---|
| Quadrant | BADHDUFLAG | Total packets | Discarded packets |
| A | 0 | 17 | 0 |
| B | 0 | 17 | 0 |
| C | 0 | 17 | 0 |
| D | 0 | 17 | 0 |
| Mode M0 | |||
|---|---|---|---|
| Quadrant | BADHDUFLAG | Total packets | Discarded packets |
| A | 0 | 13540 | 3 |
| B | 0 | 13607 | 2 |
| C | 0 | 14625 | 2 |
| D | 0 | 14514 | 2 |
| Quadrant | Total seconds | Saturated seconds | Saturation percentage |
|---|---|---|---|
| A | 6305 | 149 | 2.363204% |
| B | 6305 | 140 | 2.220460% |
| C | 6305 | 110 | 1.744647% |
| D | 6305 | 173 | 2.743854% |
Noise dominated data is calculated using 1-second bins in cleaned event files. If a bin has >2000 counts, and if more than 50% of those come from <1% of pixels, then it is considered to be noise-dominated and hence unusable.
| Quadrant | # 1 sec bins | Bins with >0 counts | Bins with >2000 counts | High rate bins dominated by noise | Noise dominated (total time) | Noise dominated (detector-on time) | Marked lightcurve |
|---|---|---|---|---|---|---|---|
| A | 7550 | 6305 | 6 | 6 | 0.08% | 0.10% | 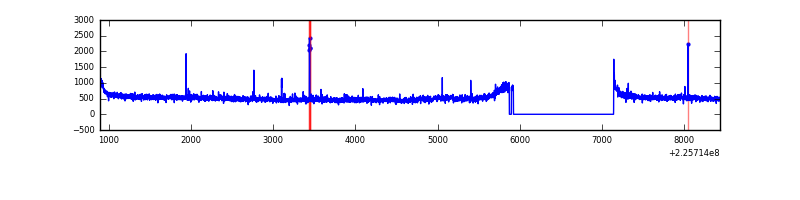 |
| B | 7550 | 6306 | 0 | 0 | 0.00% | 0.00% | 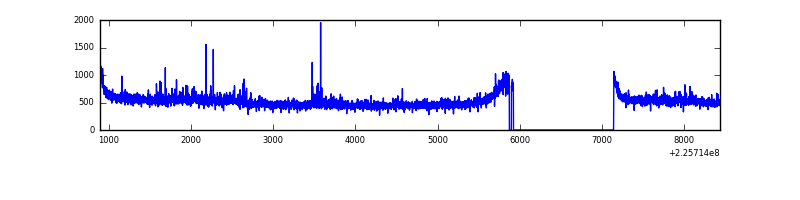 |
| C | 7550 | 6306 | 0 | 0 | 0.00% | 0.00% | 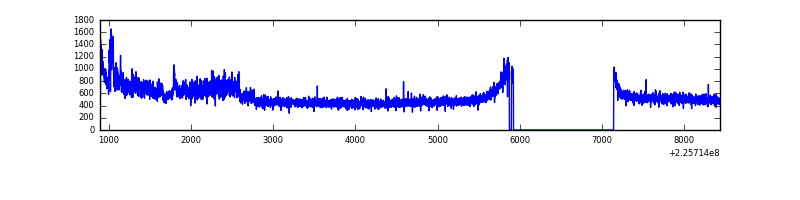 |
| D | 7550 | 6306 | 42 | 42 | 0.56% | 0.67% | 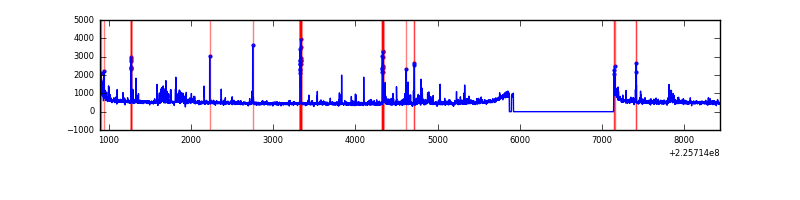 |
Top three noisy pixels from each quadrant. If the there are fewer than three noisy pixels in the level2.evt file, extra rows are filled as -1
| Pixel properties | Quadrant properties | ||||||
|---|---|---|---|---|---|---|---|
| Quadrant | DetID | PixID | Counts | Sigma | Mean | Median | Sigma |
| A | 0 | 128 | 89206 | 529.01 | 832 | 815 | 167.1 |
| A | 0 | 226 | 8002 | 43.01 | 832 | 815 | 167.1 |
| A | 12 | 194 | 7029 | 37.19 | 832 | 815 | 167.1 |
| B | 0 | 214 | 42127 | 262.52 | 829 | 812 | 157.4 |
| B | 0 | 219 | 26490 | 163.16 | 829 | 812 | 157.4 |
| B | 12 | 111 | 15901 | 95.88 | 829 | 812 | 157.4 |
| C | 1 | 16 | 310215 | 1664.68 | 806 | 811 | 185.9 |
| C | 9 | 68 | 34083 | 179.01 | 806 | 811 | 185.9 |
| C | 13 | 61 | 6242 | 29.22 | 806 | 811 | 185.9 |
| D | 2 | 152 | 154186 | 774.76 | 809 | 785 | 198.0 |
| D | 14 | 34 | 146189 | 734.37 | 809 | 785 | 198.0 |
| D | 2 | 14 | 51909 | 258.21 | 809 | 785 | 198.0 |
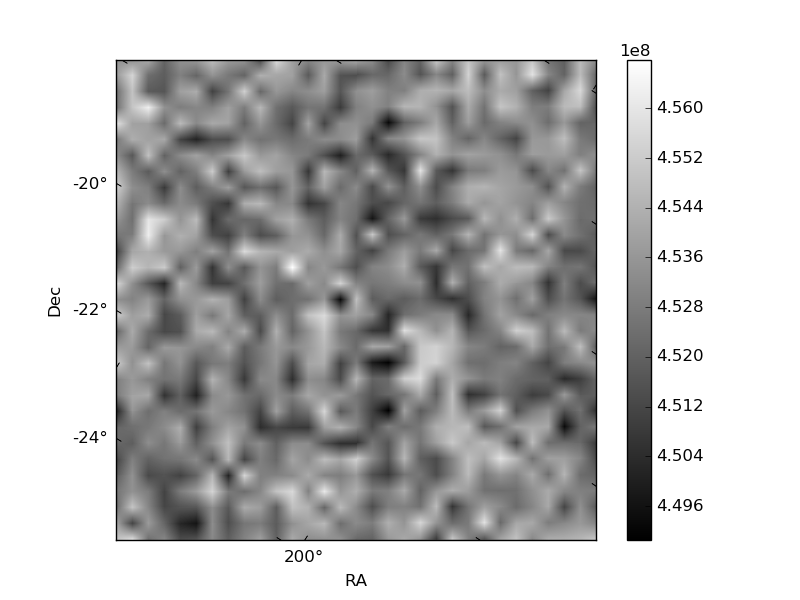
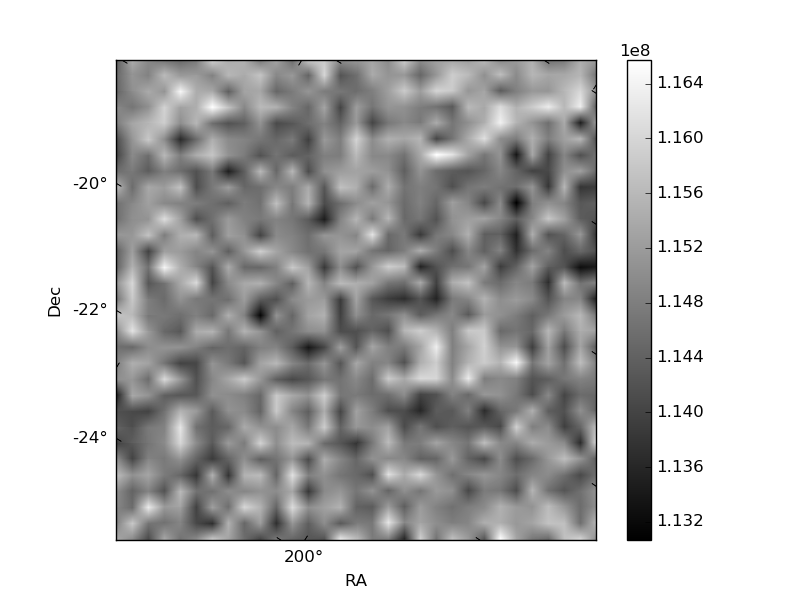
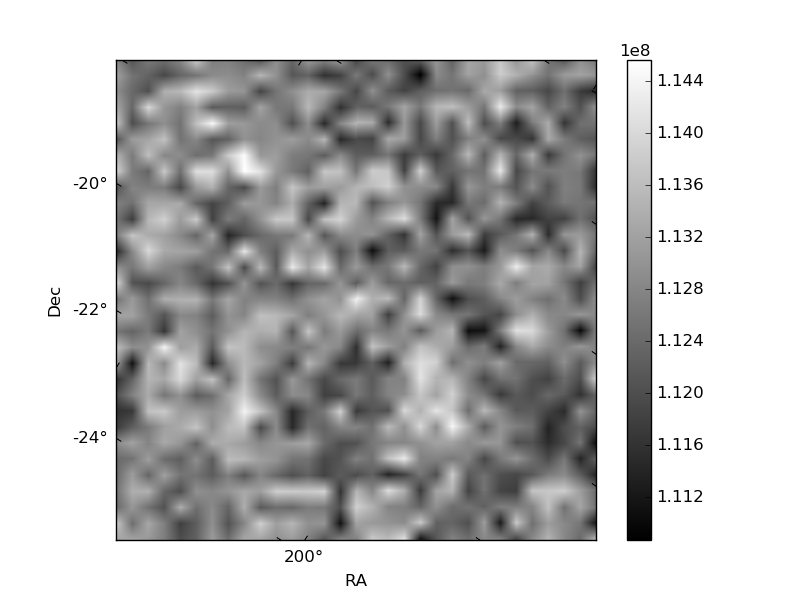
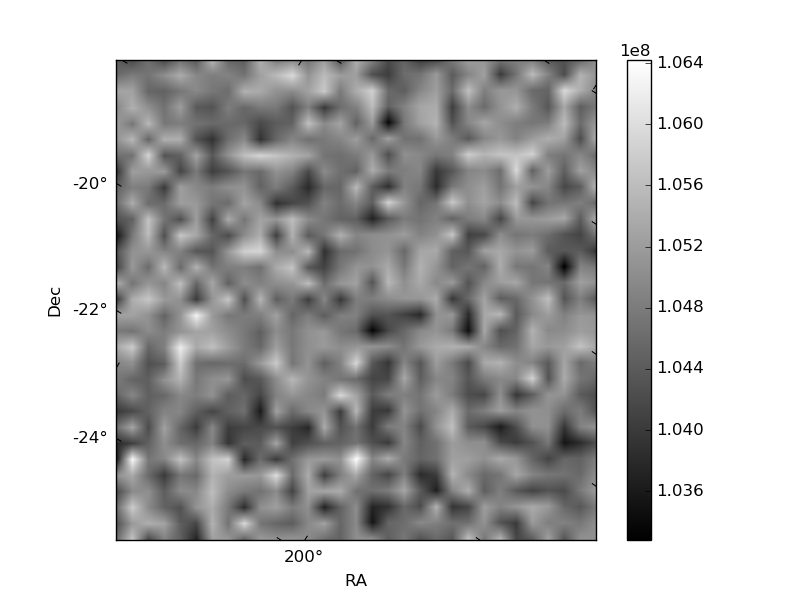
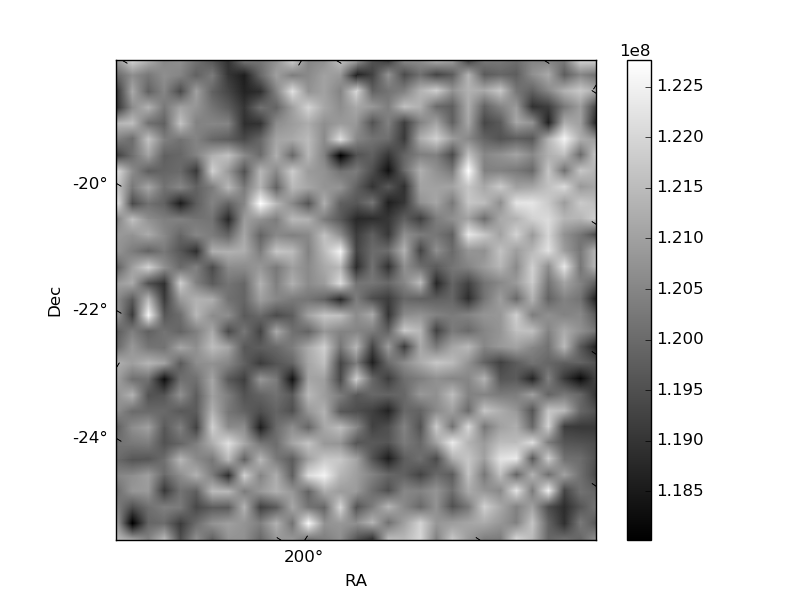
Histogram calculated using DETX and DETY for each event in the final _common_clean file
| Quadrant A | 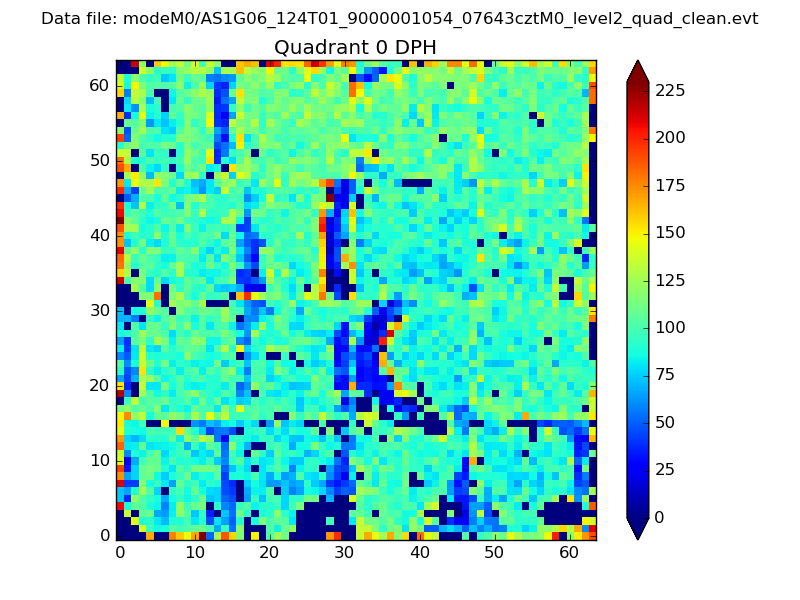 |
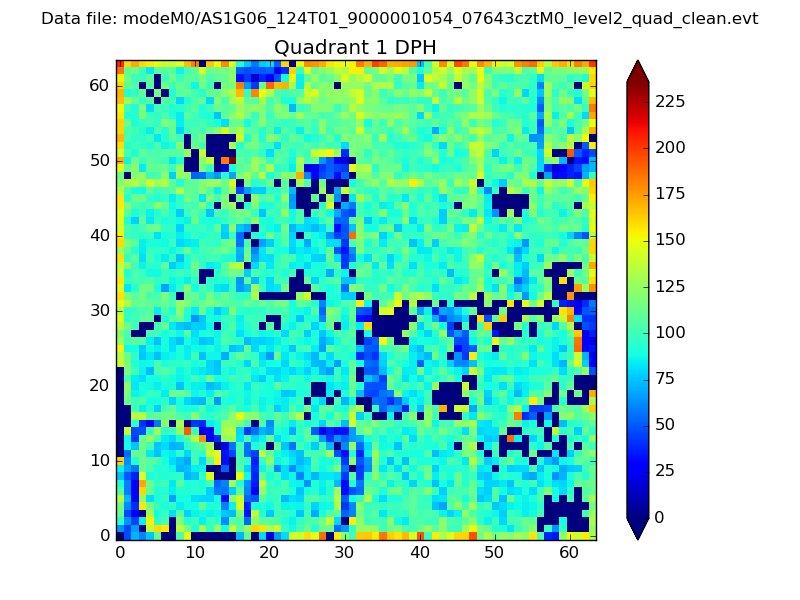 |
Quadrant B |
|---|---|---|---|
| Quadrant D |  |
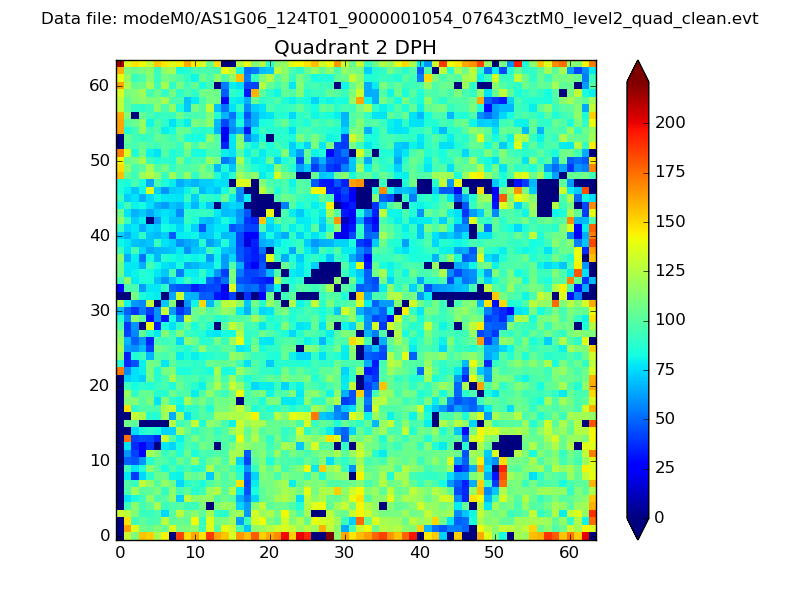 |
Quadrant C |
| Plot type | Count rate plots | Images |
|---|---|---|
| Comparison with Poisson distribution Blue bars denote a histogram of data divided into 1 sec bins. Red curve is a Poisson curve with rate = median count rate of data. |
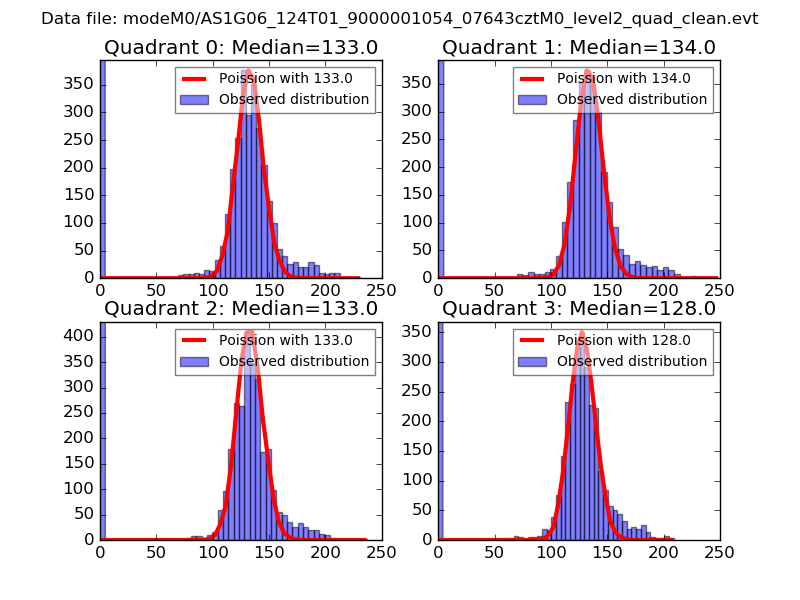 |
 |
| Quadrant-wise count rates Data is divided into 100 sec bins |
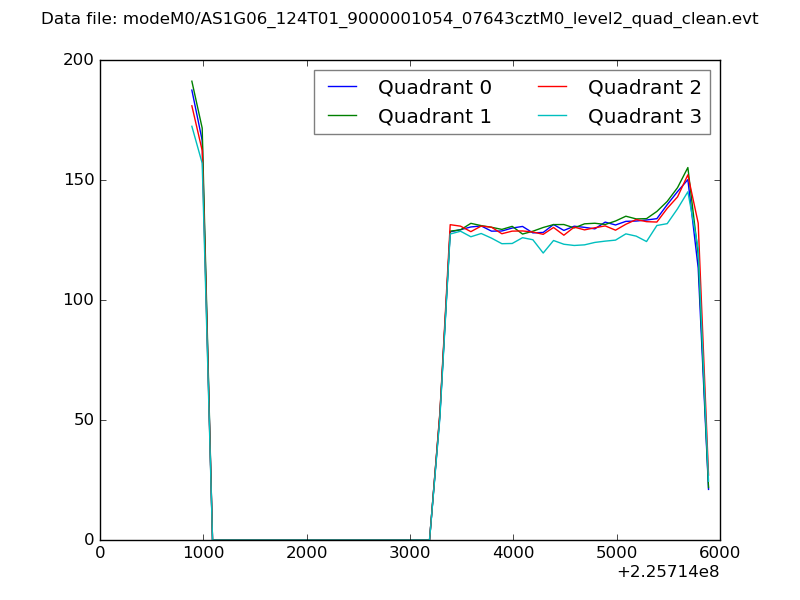 |
|
| Module-wise count rates for Quadrant A Data is divided into 100 sec bins |
 |
 |
| Module-wise count rates for Quadrant B Data is divided into 100 sec bins |
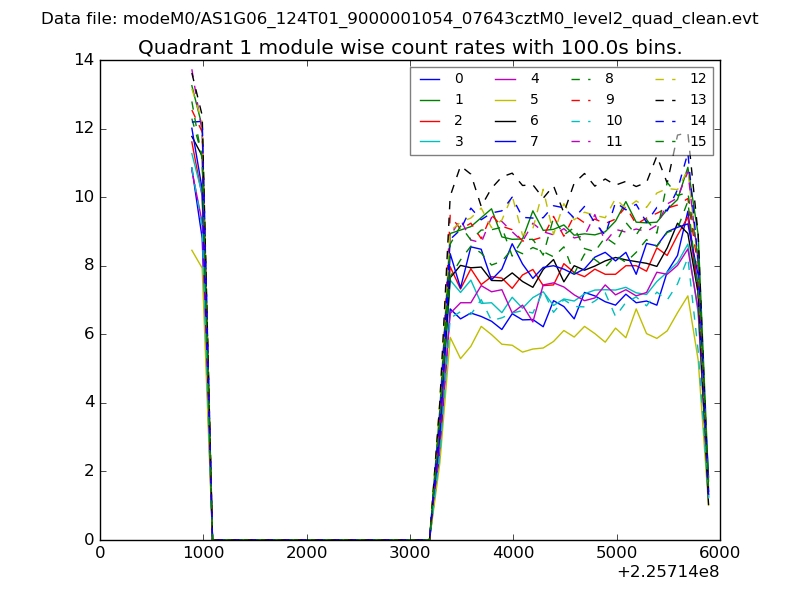 |
 |
| Module-wise count rates for Quadrant C Data is divided into 100 sec bins |
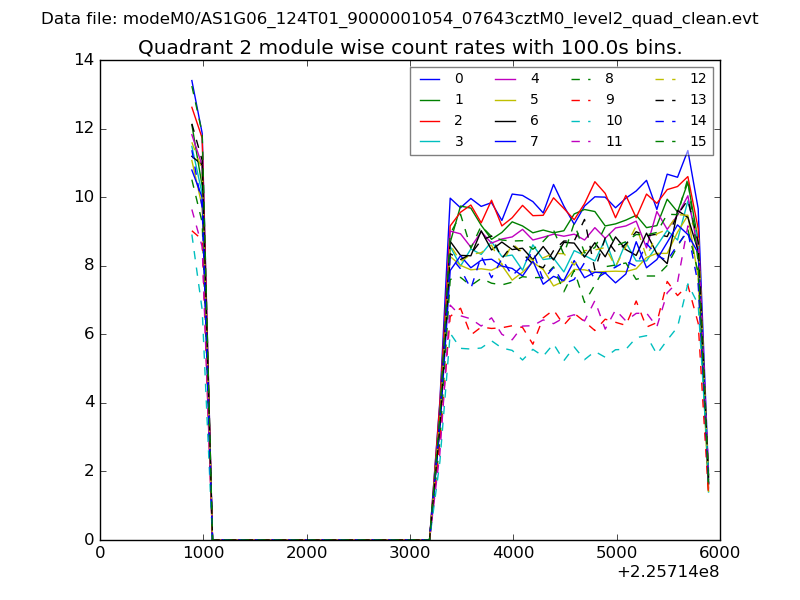 |
 |
| Module-wise count rates for Quadrant D Data is divided into 100 sec bins |
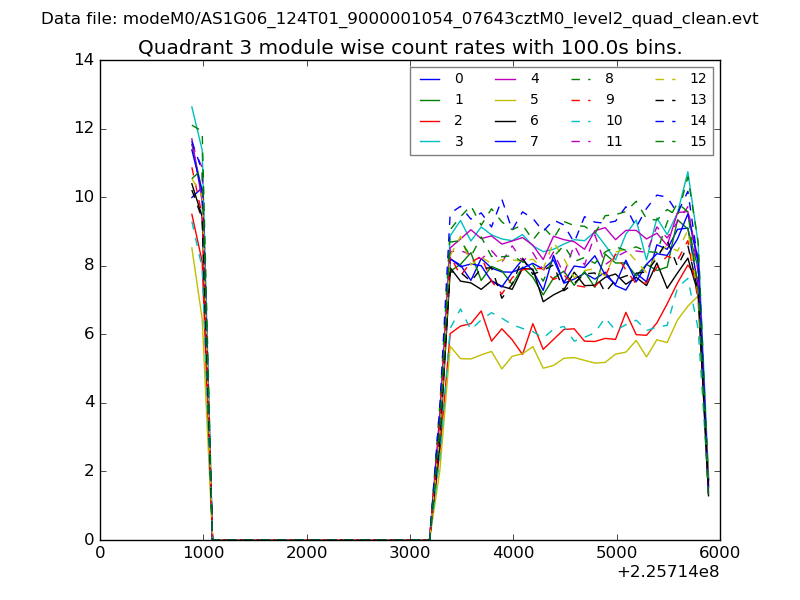 |
 |
| Parameter | Plot |
|---|---|
| CZT HV Monitor |  |
| D_VDD | 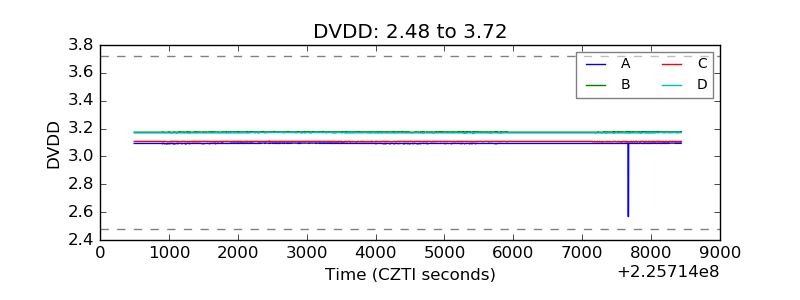 |
| Temperature 1 | 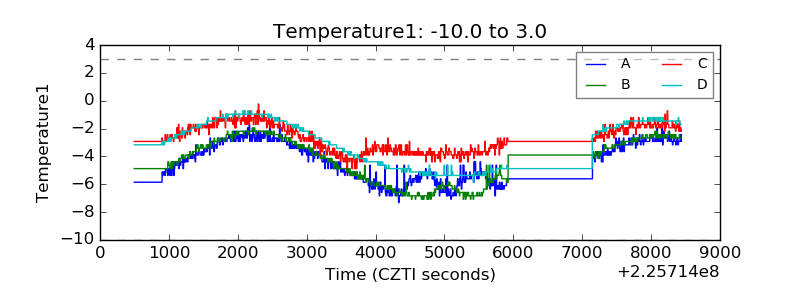 |
| Veto HV Monitor | 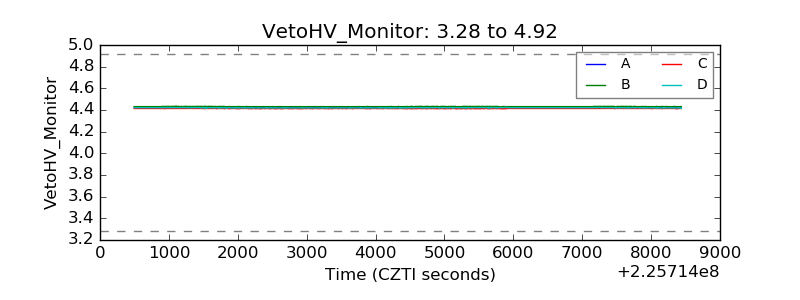 |
| Veto LLD | 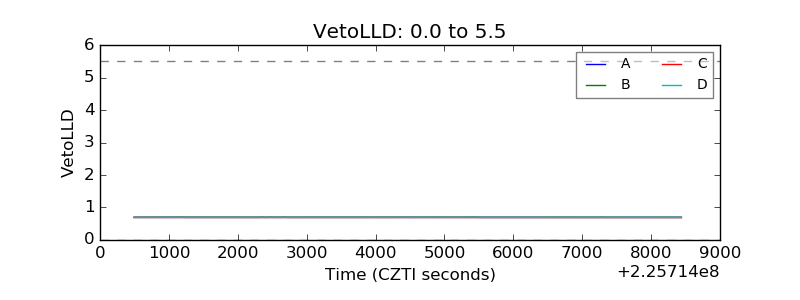 |
| Alpha Counter | 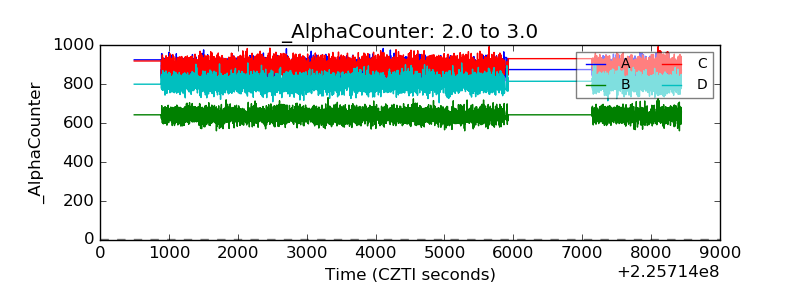 |
| _CPM_Rate | 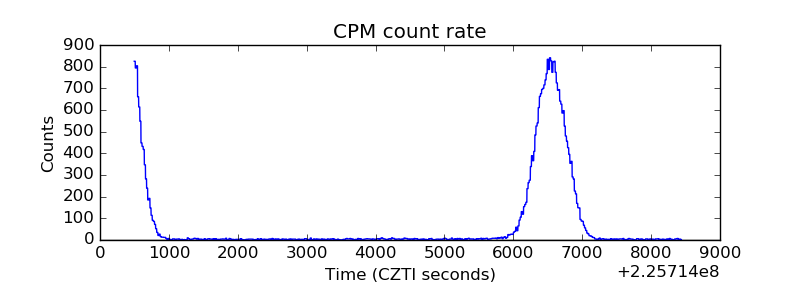 |
| CZT Counter | 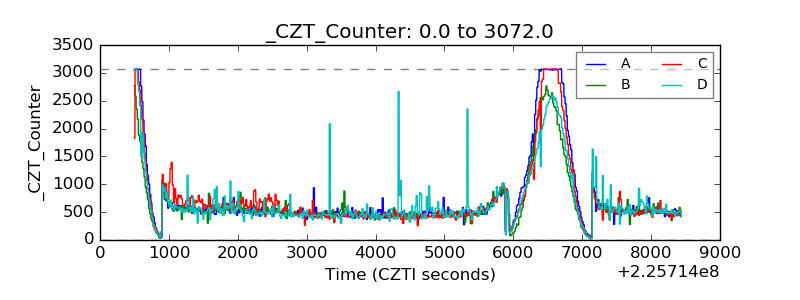 |
| +2.5 Volts monitor |  |
| +5 Volts monitor | 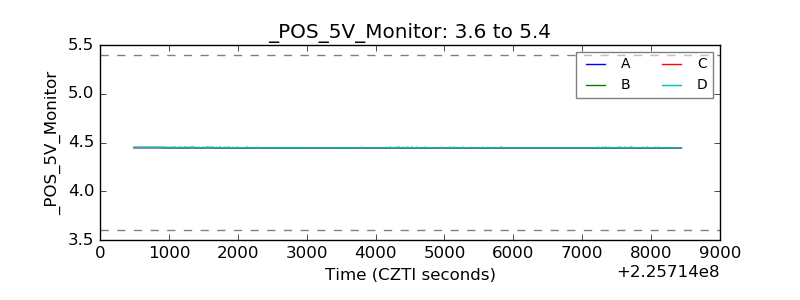 |
| _ROLL_ROT | 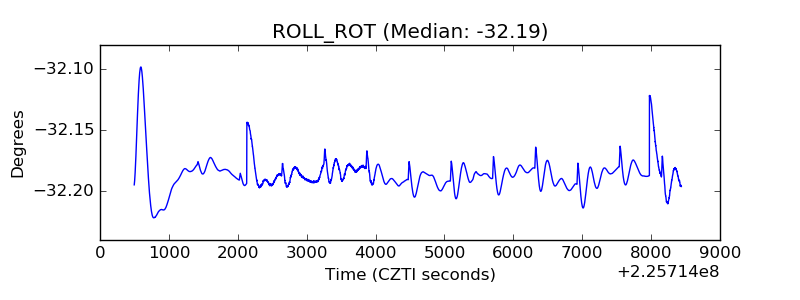 |
| _Roll_DEC | 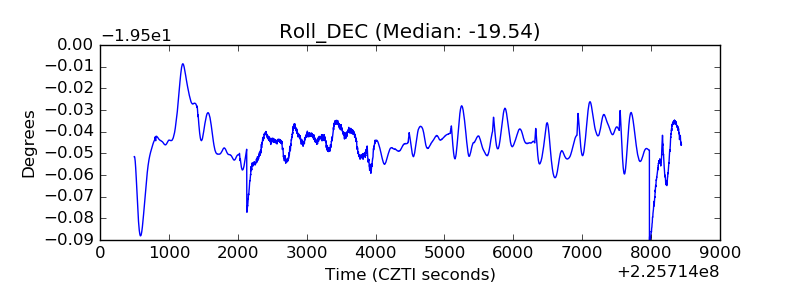 |
| _Roll_RA | 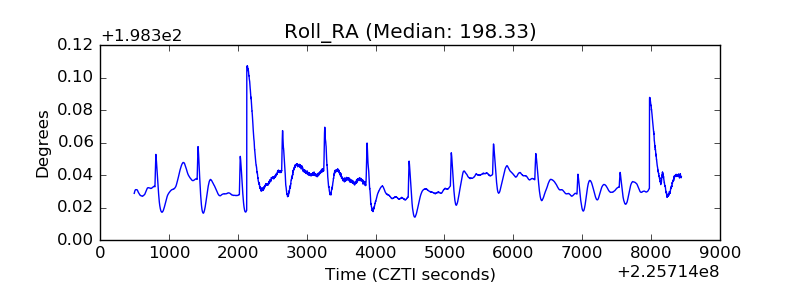 |
| Veto Counter | 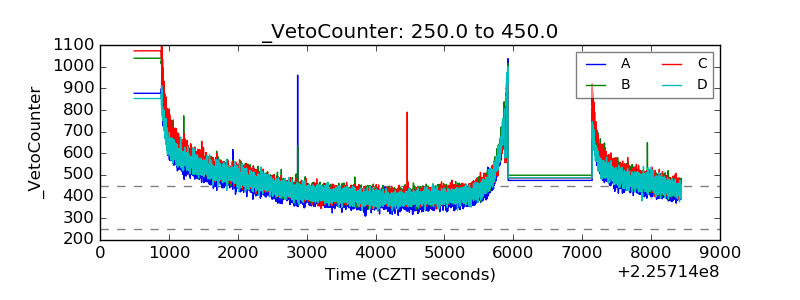 |