| Param | Original file | Final file |
|---|---|---|
| Filename | modeM0/AS1G06_124T01_9000001054_07644cztM0_level2.evt | modeM0/AS1G06_124T01_9000001054_07644cztM0_level2_quad_clean.evt |
| Size (bytes) | 637,945,920 | 59,290,560 |
| Size | 608.4 MB | 56.5 MB |
| Events in quadrant A | 8,489,630 | 100,013 |
| Events in quadrant B | 3,454,167 | 412,428 |
| Events in quadrant C | 3,323,177 | 408,973 |
| Events in quadrant D | 3,585,933 | 392,496 |
| Mode SS | |||
|---|---|---|---|
| Quadrant | BADHDUFLAG | Total packets | Discarded packets |
| A | 0 | 140 | 0 |
| B | 0 | 140 | 0 |
| C | 0 | 140 | 0 |
| D | 0 | 140 | 0 |
| Mode M9 | |||
|---|---|---|---|
| Quadrant | BADHDUFLAG | Total packets | Discarded packets |
| A | 0 | 23 | 0 |
| B | 0 | 23 | 0 |
| C | 0 | 23 | 0 |
| D | 0 | 23 | 0 |
| Mode M0 | |||
|---|---|---|---|
| Quadrant | BADHDUFLAG | Total packets | Discarded packets |
| A | 0 | 29413 | 2 |
| B | 0 | 14555 | 1 |
| C | 0 | 14308 | 1 |
| D | 0 | 15272 | 1 |
| Quadrant | Total seconds | Saturated seconds | Saturation percentage |
|---|---|---|---|
| A | 6892 | 2667 | 38.697040% |
| B | 6892 | 105 | 1.523506% |
| C | 6892 | 65 | 0.943122% |
| D | 6892 | 139 | 2.016831% |
Noise dominated data is calculated using 1-second bins in cleaned event files. If a bin has >2000 counts, and if more than 50% of those come from <1% of pixels, then it is considered to be noise-dominated and hence unusable.
| Quadrant | # 1 sec bins | Bins with >0 counts | Bins with >2000 counts | High rate bins dominated by noise | Noise dominated (total time) | Noise dominated (detector-on time) | Marked lightcurve |
|---|---|---|---|---|---|---|---|
| A | 9192 | 6893 | 2494 | 2494 | 27.13% | 36.18% | 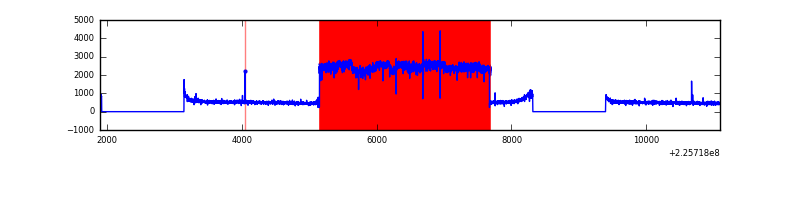 |
| B | 9192 | 6893 | 6 | 6 | 0.07% | 0.09% | 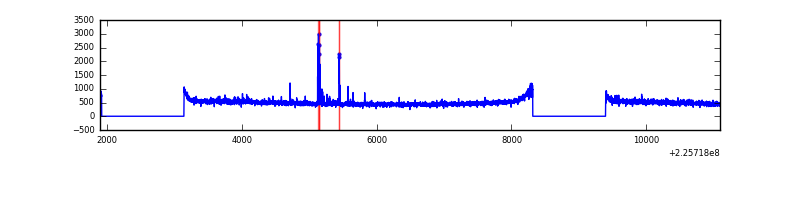 |
| C | 9192 | 6893 | 0 | 0 | 0.00% | 0.00% | 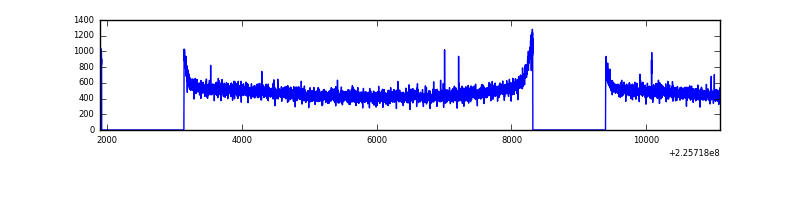 |
| D | 9192 | 6893 | 28 | 28 | 0.30% | 0.41% | 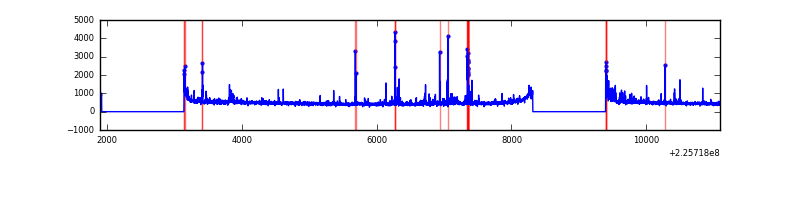 |
Top three noisy pixels from each quadrant. If the there are fewer than three noisy pixels in the level2.evt file, extra rows are filled as -1
| Pixel properties | Quadrant properties | ||||||
|---|---|---|---|---|---|---|---|
| Quadrant | DetID | PixID | Counts | Sigma | Mean | Median | Sigma |
| A | 0 | 128 | 6152599 | 49673.57 | 604 | 591 | 123.8 |
| A | 0 | 226 | 5754 | 41.68 | 604 | 591 | 123.8 |
| A | 12 | 194 | 5289 | 37.93 | 604 | 591 | 123.8 |
| B | 0 | 214 | 35797 | 209.34 | 868 | 849 | 166.9 |
| B | 4 | 80 | 30340 | 176.65 | 868 | 849 | 166.9 |
| B | 12 | 111 | 17095 | 97.31 | 868 | 849 | 166.9 |
| C | 9 | 68 | 29674 | 146.57 | 844 | 849 | 196.7 |
| C | 13 | 61 | 6400 | 28.23 | 844 | 849 | 196.7 |
| C | 3 | 202 | 2176 | 6.75 | 844 | 849 | 196.7 |
| D | 14 | 34 | 150909 | 719.18 | 843 | 816 | 208.7 |
| D | 2 | 152 | 126148 | 600.53 | 843 | 816 | 208.7 |
| D | 13 | 104 | 62052 | 293.42 | 843 | 816 | 208.7 |
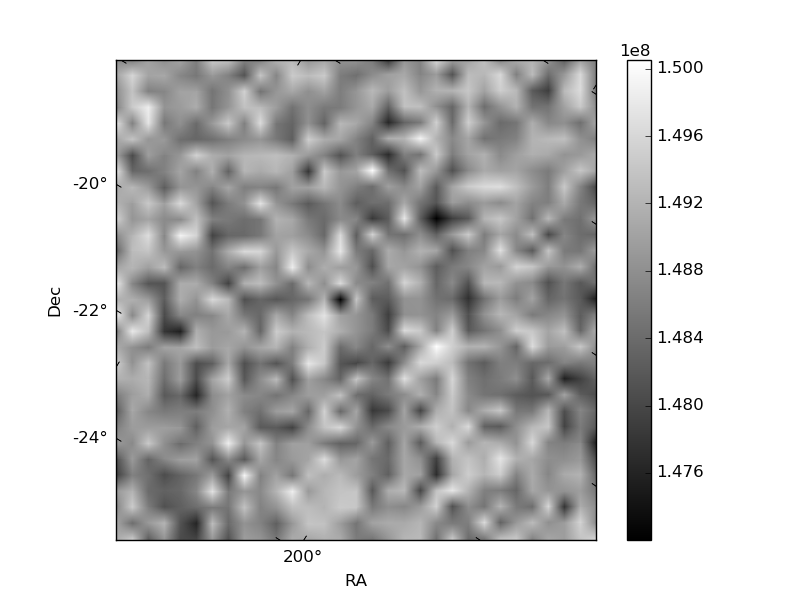
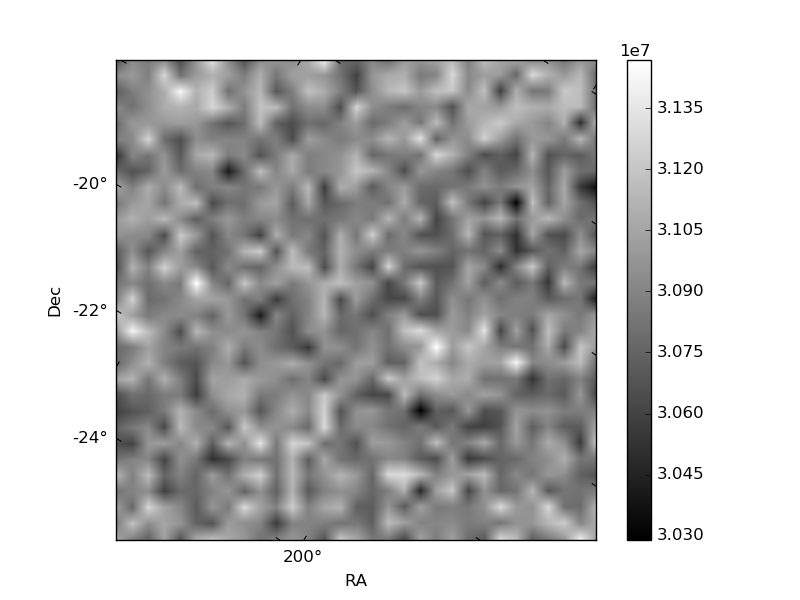
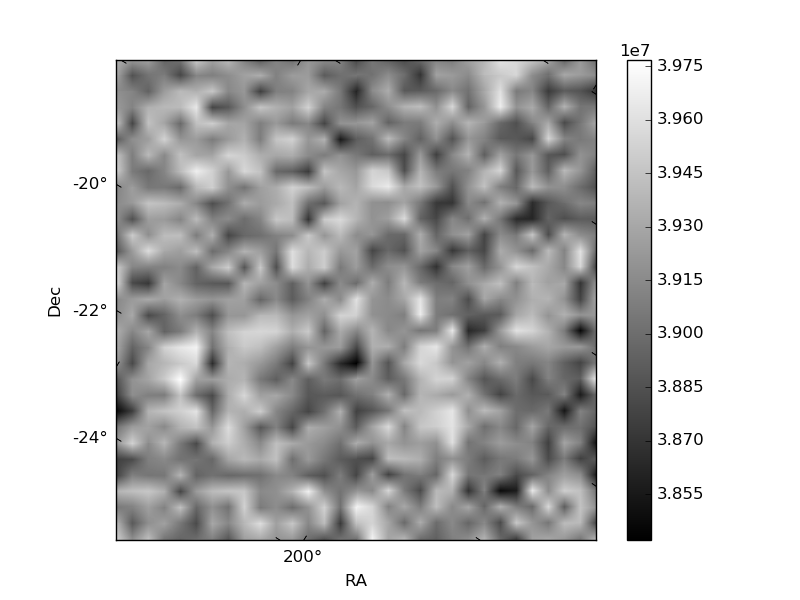
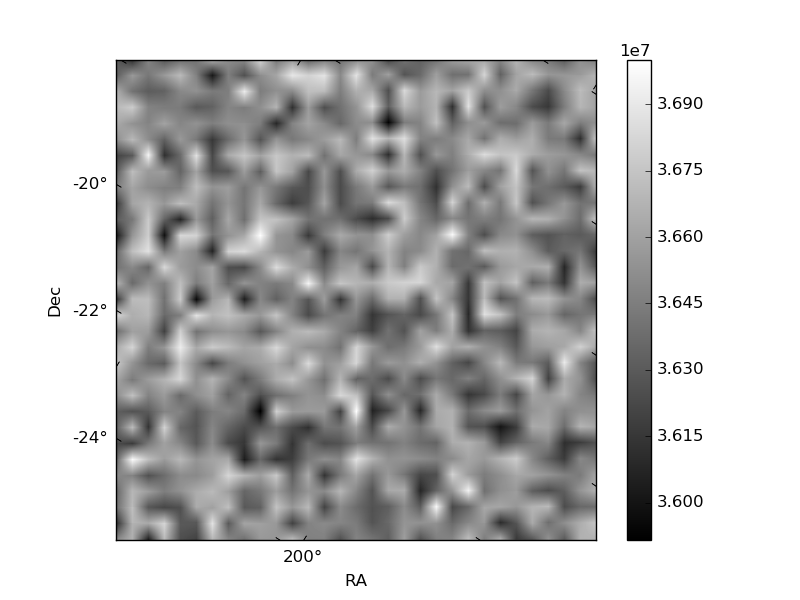
Histogram calculated using DETX and DETY for each event in the final _common_clean file
| Quadrant A | 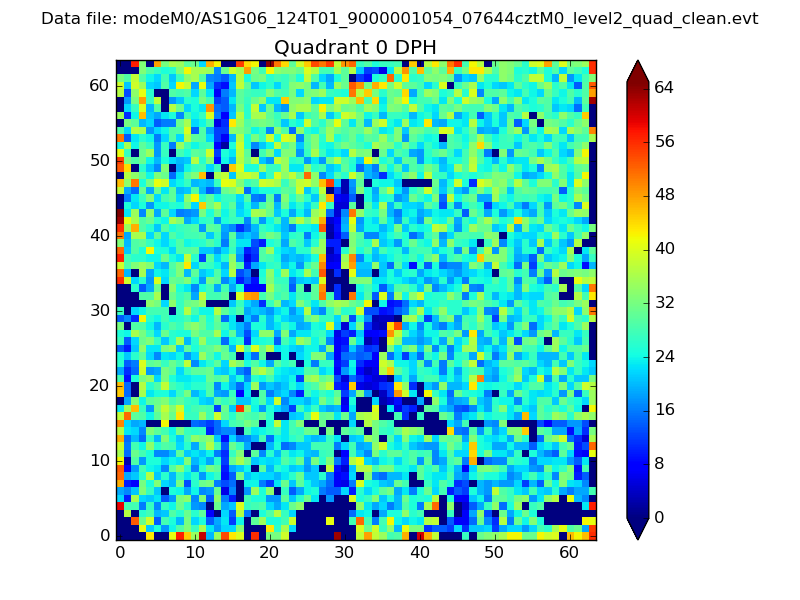 |
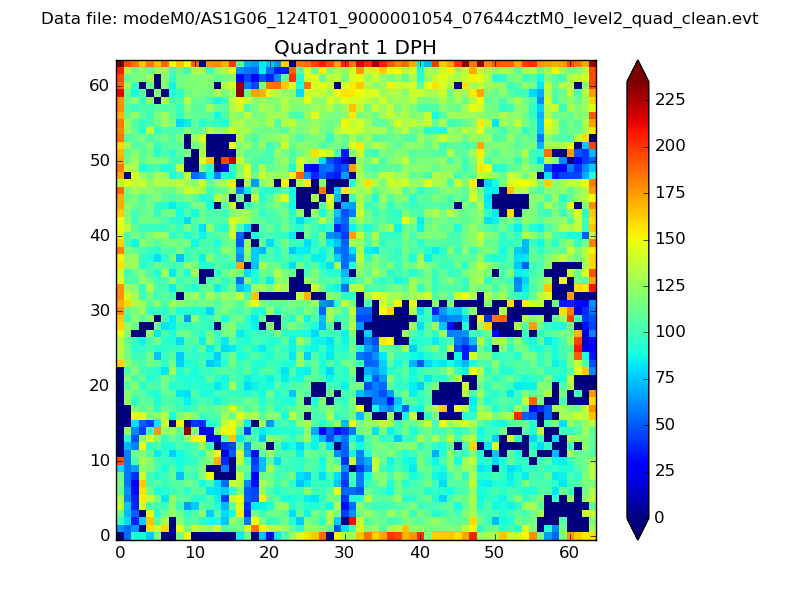 |
Quadrant B |
|---|---|---|---|
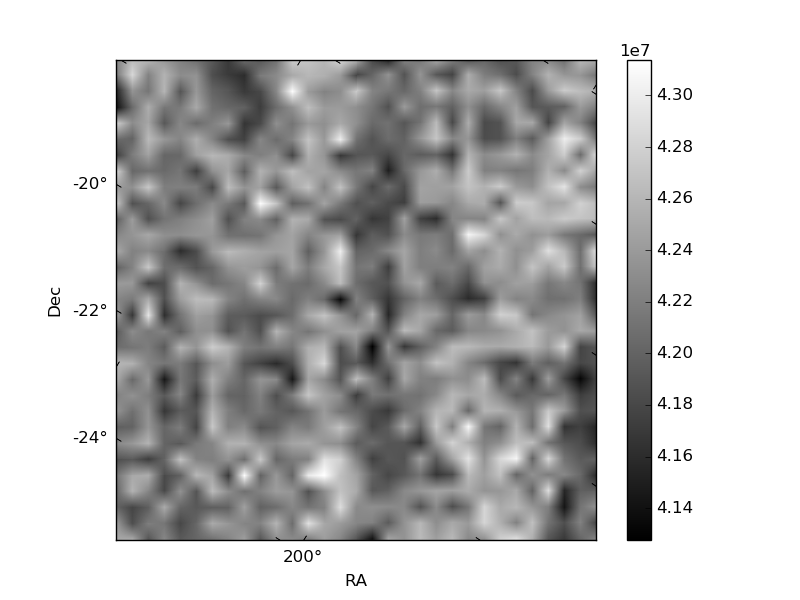
| Quadrant D | 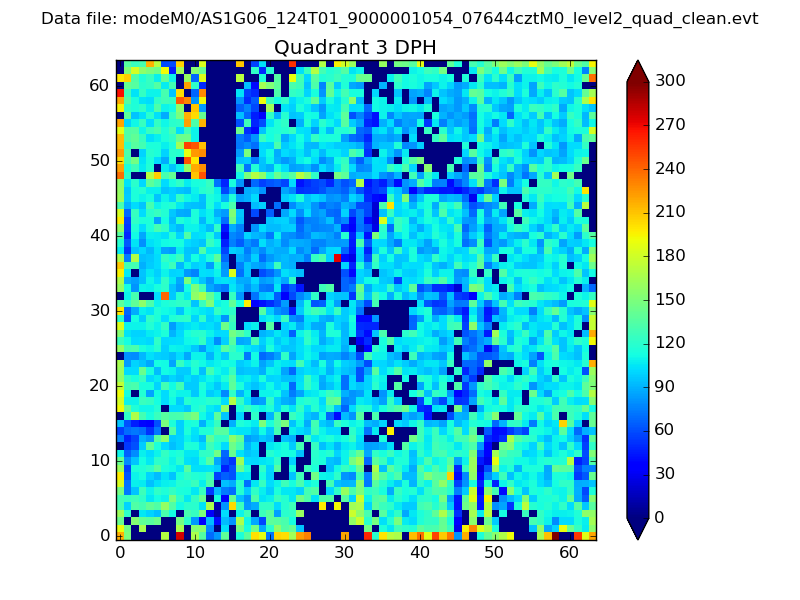 |
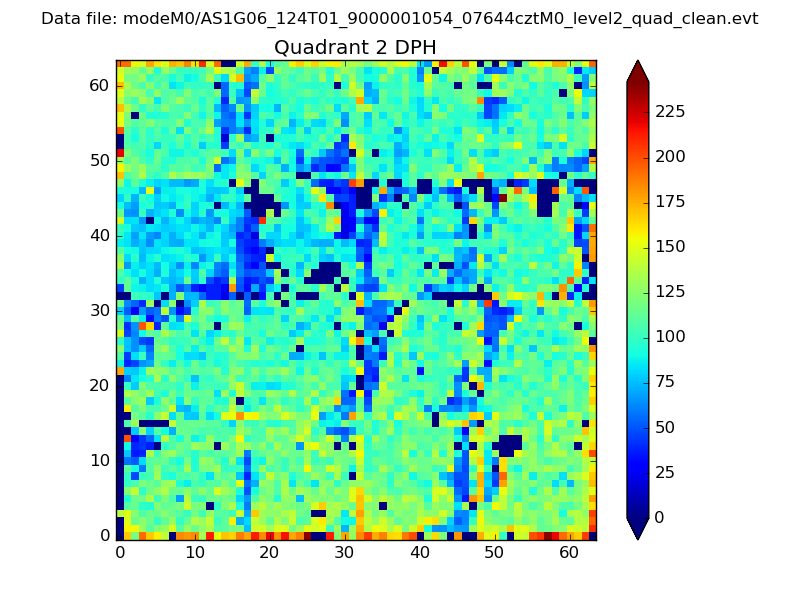 |
Quadrant C |
| Plot type | Count rate plots | Images |
|---|---|---|
| Comparison with Poisson distribution Blue bars denote a histogram of data divided into 1 sec bins. Red curve is a Poisson curve with rate = median count rate of data. |
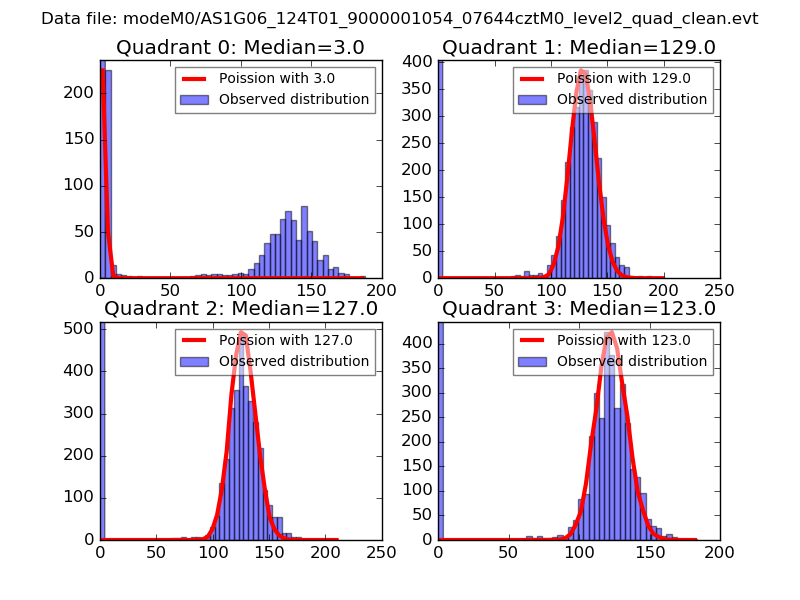 |
 |
| Quadrant-wise count rates Data is divided into 100 sec bins |
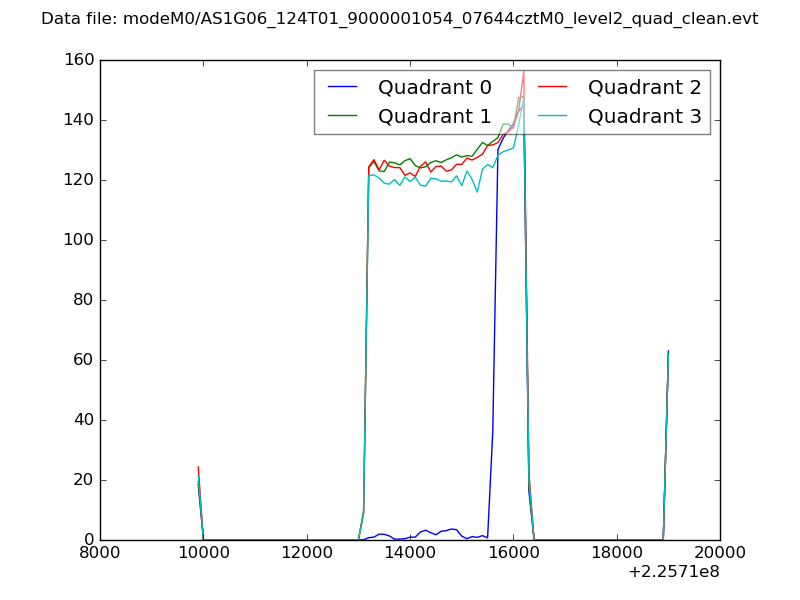 |
|
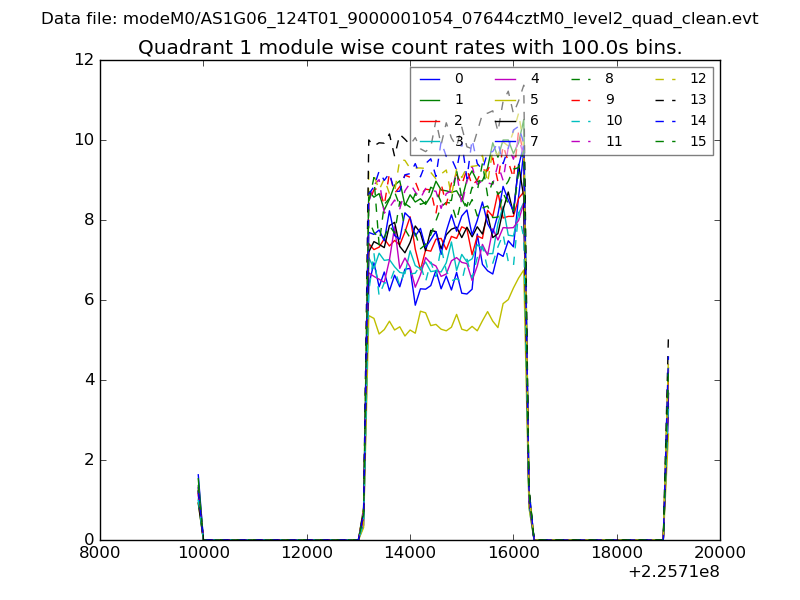
| Module-wise count rates for Quadrant A Data is divided into 100 sec bins |
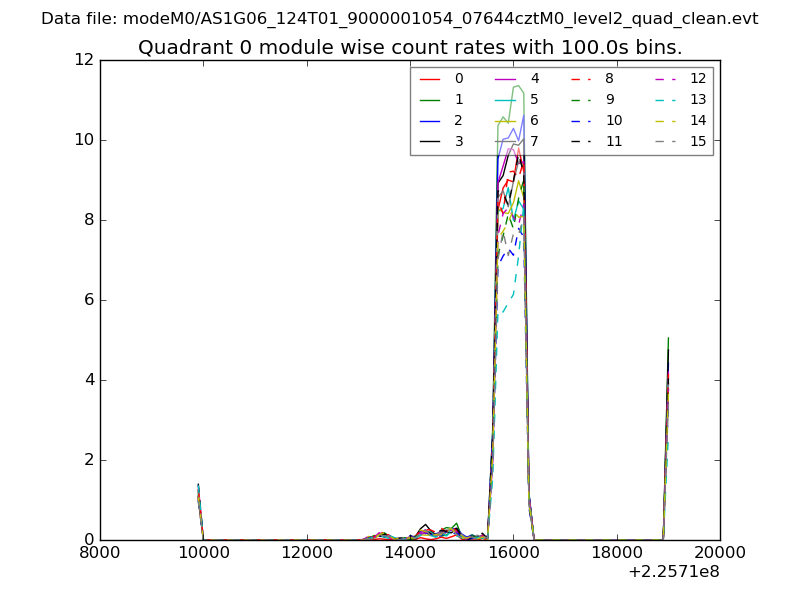 |
 |
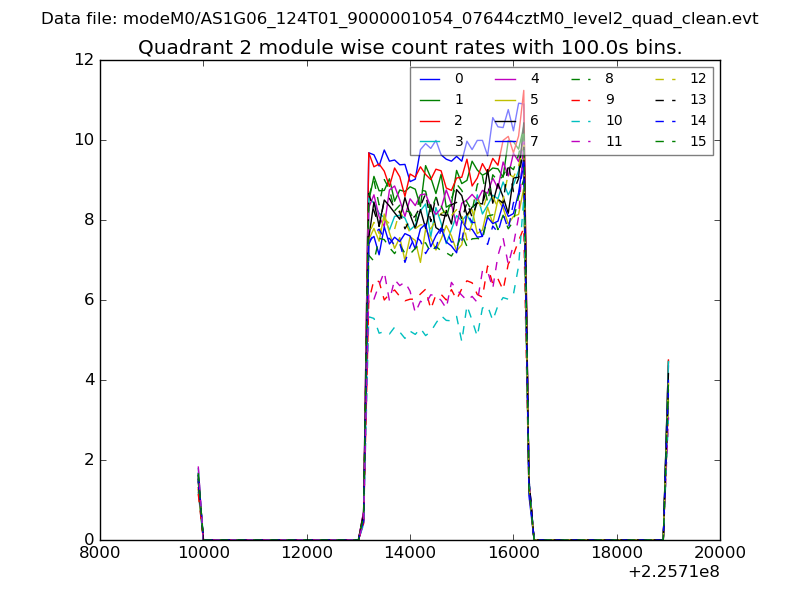
| Module-wise count rates for Quadrant B Data is divided into 100 sec bins |
 |
 |
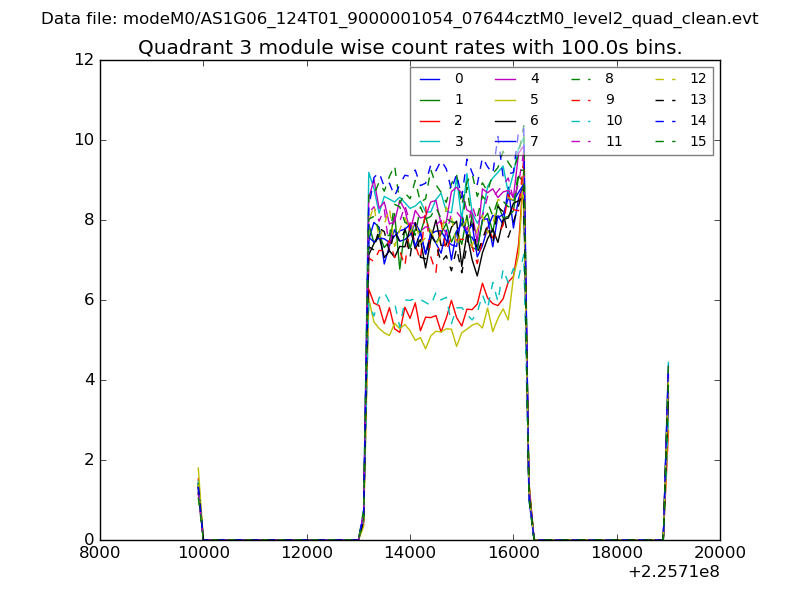
| Module-wise count rates for Quadrant C Data is divided into 100 sec bins |
 |
 |
| Module-wise count rates for Quadrant D Data is divided into 100 sec bins |
 |
 |
| Parameter | Plot |
|---|---|
| CZT HV Monitor | 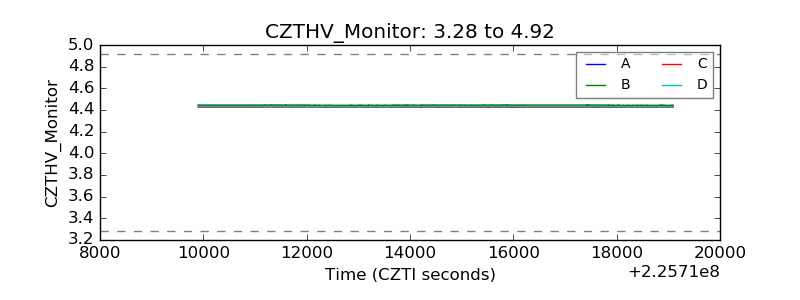 |
| D_VDD | 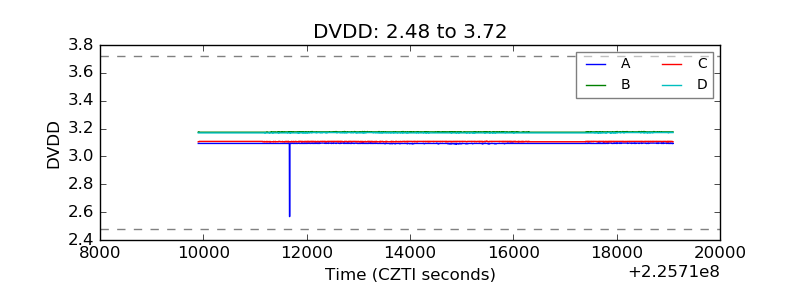 |
| Temperature 1 |  |
| Veto HV Monitor | 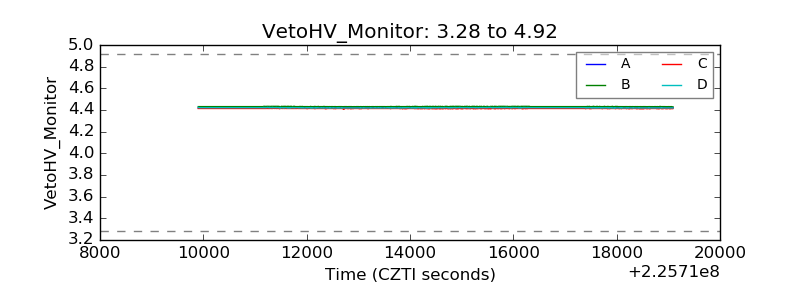 |
| Veto LLD | 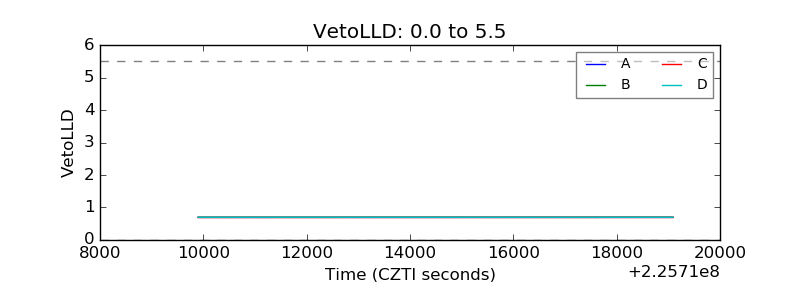 |
| Alpha Counter | 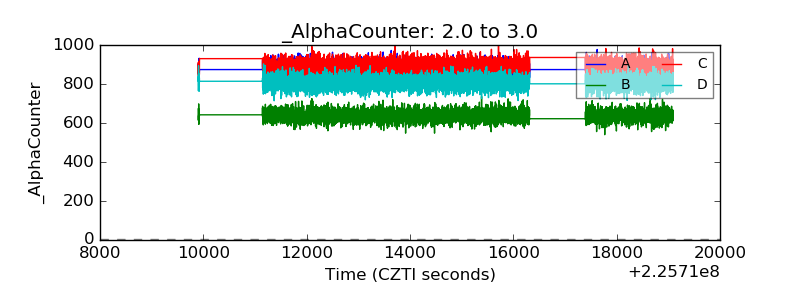 |
| _CPM_Rate | 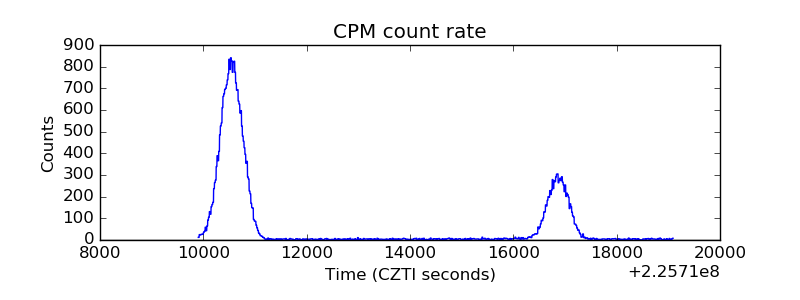 |
| CZT Counter |  |
| +2.5 Volts monitor |  |
| +5 Volts monitor |  |
| _ROLL_ROT | 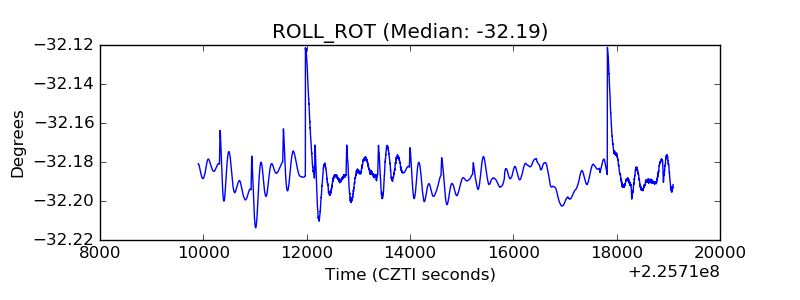 |
| _Roll_DEC | 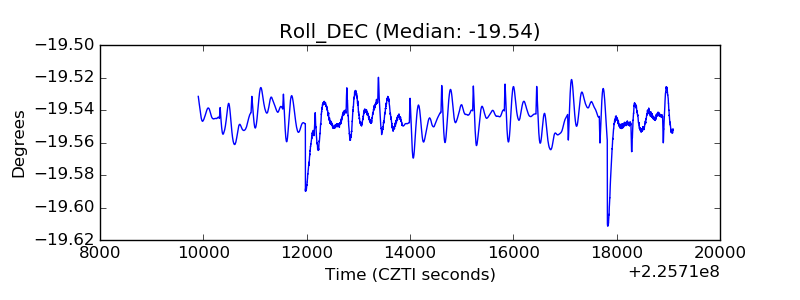 |
| _Roll_RA | 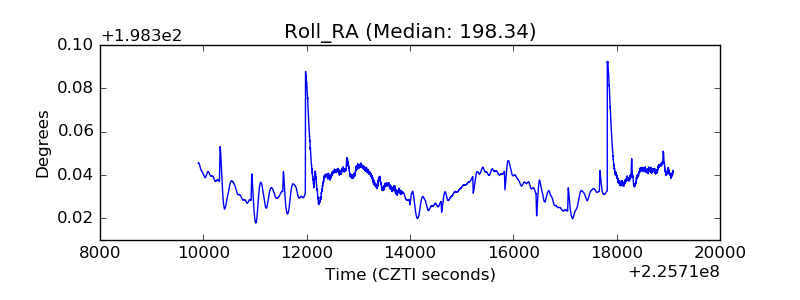 |
| Veto Counter | 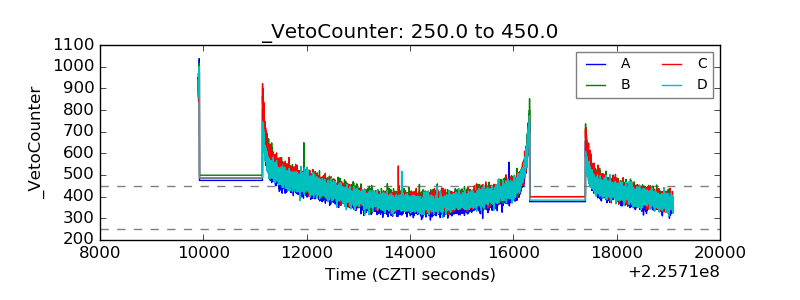 |