| Param | Original file | Final file |
|---|---|---|
| Filename | modeM0/AS1G06_124T01_9000001054_07645cztM0_level2.evt | modeM0/AS1G06_124T01_9000001054_07645cztM0_level2_quad_clean.evt |
| Size (bytes) | 470,747,520 | 79,686,720 |
| Size | 448.9 MB | 76.0 MB |
| Events in quadrant A | 3,362,535 | 481,458 |
| Events in quadrant B | 3,423,645 | 487,323 |
| Events in quadrant C | 3,341,404 | 482,960 |
| Events in quadrant D | 3,643,796 | 464,140 |
| Mode SS | |||
|---|---|---|---|
| Quadrant | BADHDUFLAG | Total packets | Discarded packets |
| A | 0 | 146 | 0 |
| B | 0 | 146 | 0 |
| C | 0 | 146 | 0 |
| D | 0 | 146 | 0 |
| Mode M9 | |||
|---|---|---|---|
| Quadrant | BADHDUFLAG | Total packets | Discarded packets |
| A | 0 | 19 | 0 |
| B | 0 | 19 | 0 |
| C | 0 | 19 | 0 |
| D | 0 | 19 | 0 |
| Mode M0 | |||
|---|---|---|---|
| Quadrant | BADHDUFLAG | Total packets | Discarded packets |
| A | 0 | 14742 | 2 |
| B | 0 | 14827 | 1 |
| C | 0 | 14736 | 1 |
| D | 0 | 15758 | 1 |
| Quadrant | Total seconds | Saturated seconds | Saturation percentage |
|---|---|---|---|
| A | 7142 | 94 | 1.316158% |
| B | 7142 | 94 | 1.316158% |
| C | 7142 | 49 | 0.686082% |
| D | 7142 | 115 | 1.610193% |
Noise dominated data is calculated using 1-second bins in cleaned event files. If a bin has >2000 counts, and if more than 50% of those come from <1% of pixels, then it is considered to be noise-dominated and hence unusable.
| Quadrant | # 1 sec bins | Bins with >0 counts | Bins with >2000 counts | High rate bins dominated by noise | Noise dominated (total time) | Noise dominated (detector-on time) | Marked lightcurve |
|---|---|---|---|---|---|---|---|
| A | 8947 | 7144 | 0 | 0 | 0.00% | 0.00% | 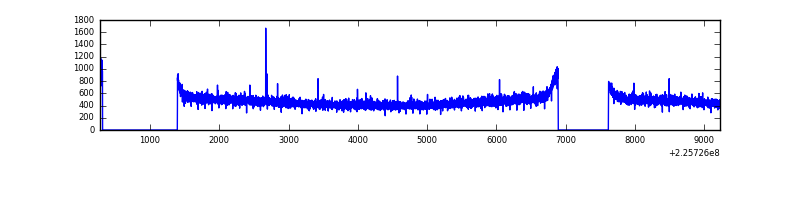 |
| B | 8947 | 7144 | 1 | 1 | 0.01% | 0.01% | 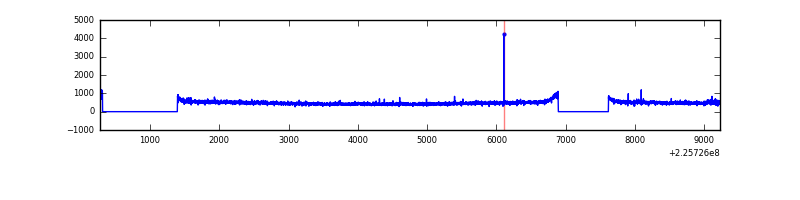 |
| C | 8947 | 7144 | 0 | 0 | 0.00% | 0.00% | 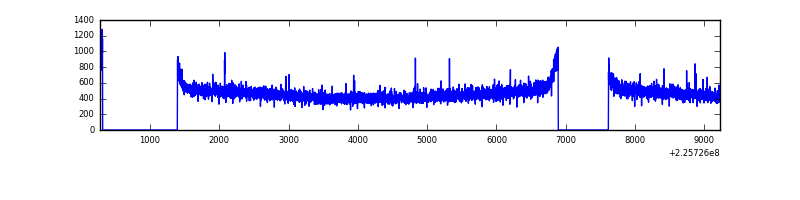 |
| D | 8947 | 7144 | 33 | 33 | 0.37% | 0.46% | 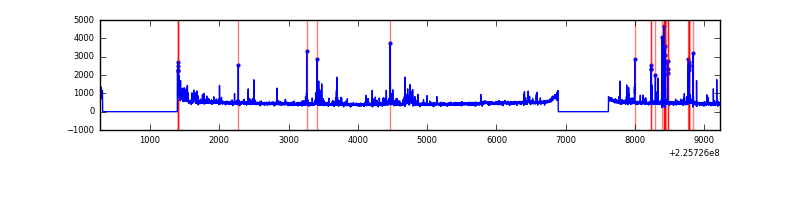 |
Top three noisy pixels from each quadrant. If the there are fewer than three noisy pixels in the level2.evt file, extra rows are filled as -1
| Pixel properties | Quadrant properties | ||||||
|---|---|---|---|---|---|---|---|
| Quadrant | DetID | PixID | Counts | Sigma | Mean | Median | Sigma |
| A | 0 | 226 | 8107 | 40.56 | 871 | 851 | 178.9 |
| A | 12 | 194 | 7825 | 38.98 | 871 | 851 | 178.9 |
| A | 3 | 1 | 4317 | 19.37 | 871 | 851 | 178.9 |
| B | 12 | 111 | 17308 | 98.29 | 870 | 849 | 167.5 |
| B | 0 | 214 | 16111 | 91.14 | 870 | 849 | 167.5 |
| B | 11 | 111 | 13963 | 78.31 | 870 | 849 | 167.5 |
| C | 9 | 68 | 40145 | 198.01 | 845 | 848 | 198.5 |
| C | 13 | 61 | 6517 | 28.56 | 845 | 848 | 198.5 |
| C | 8 | 222 | 2542 | 8.54 | 845 | 848 | 198.5 |
| D | 13 | 104 | 134042 | 641.22 | 844 | 818 | 207.8 |
| D | 14 | 34 | 100416 | 479.37 | 844 | 818 | 207.8 |
| D | 2 | 152 | 99806 | 476.44 | 844 | 818 | 207.8 |
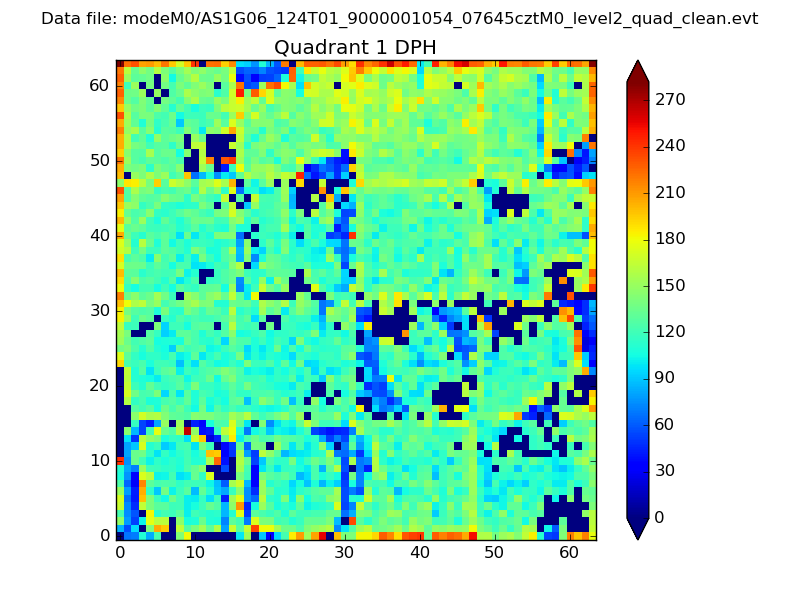
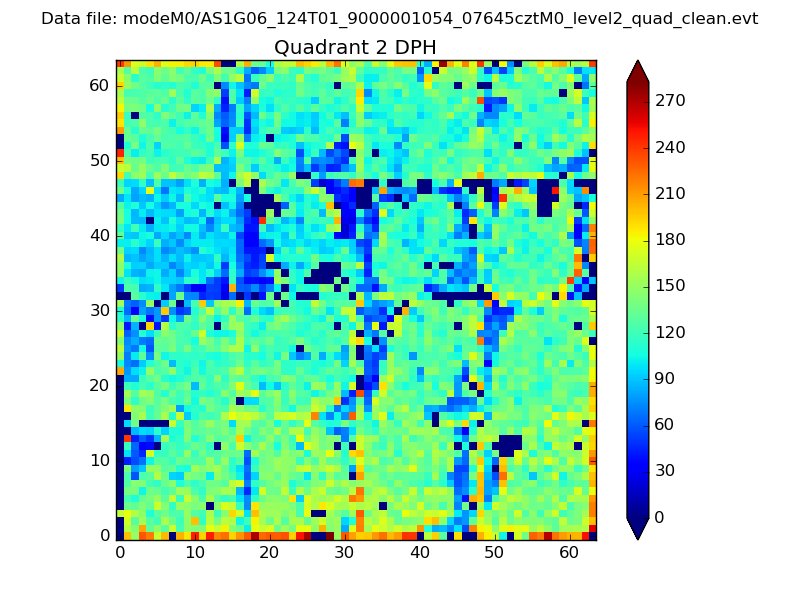
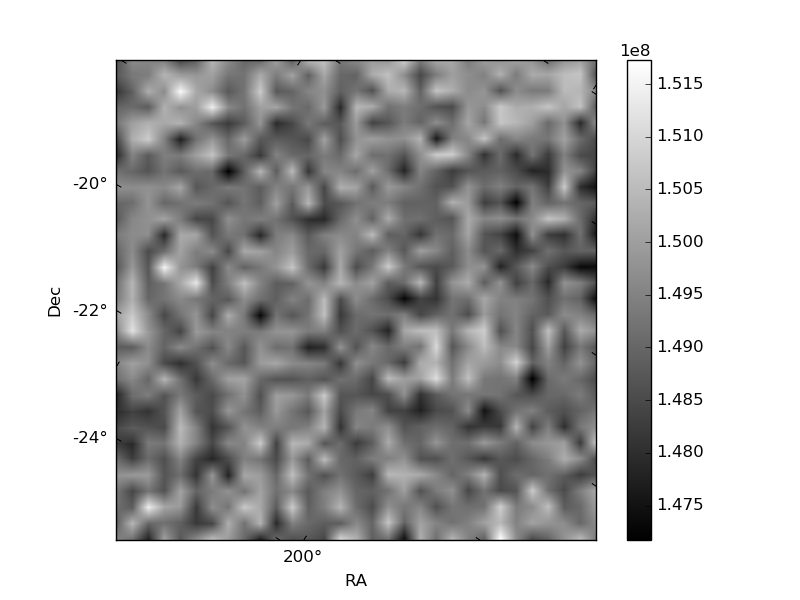
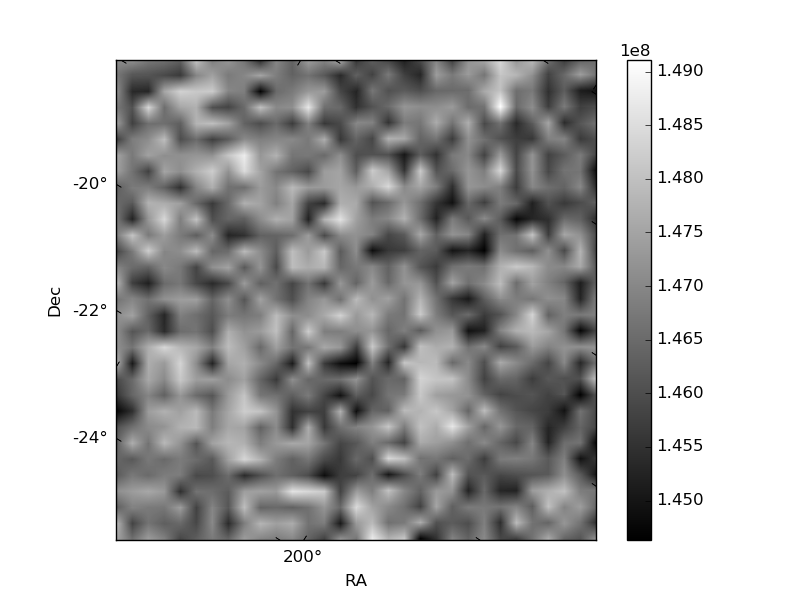
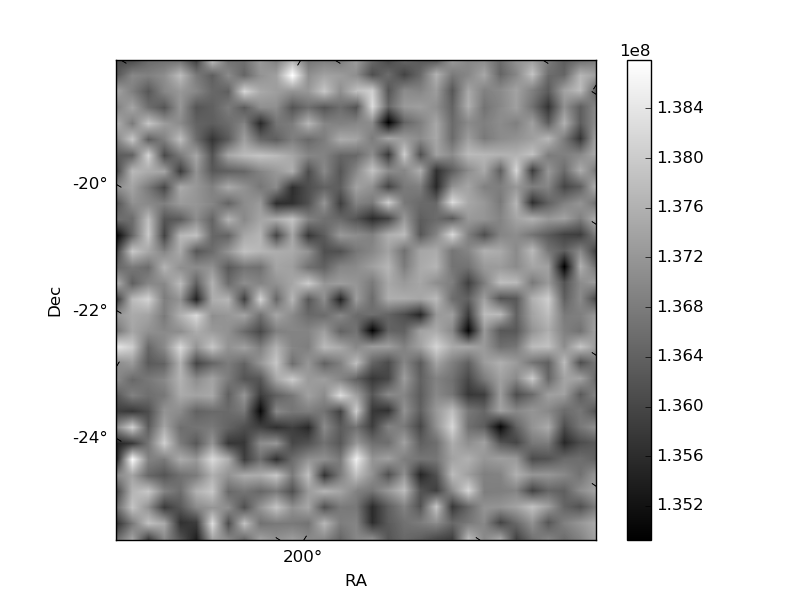
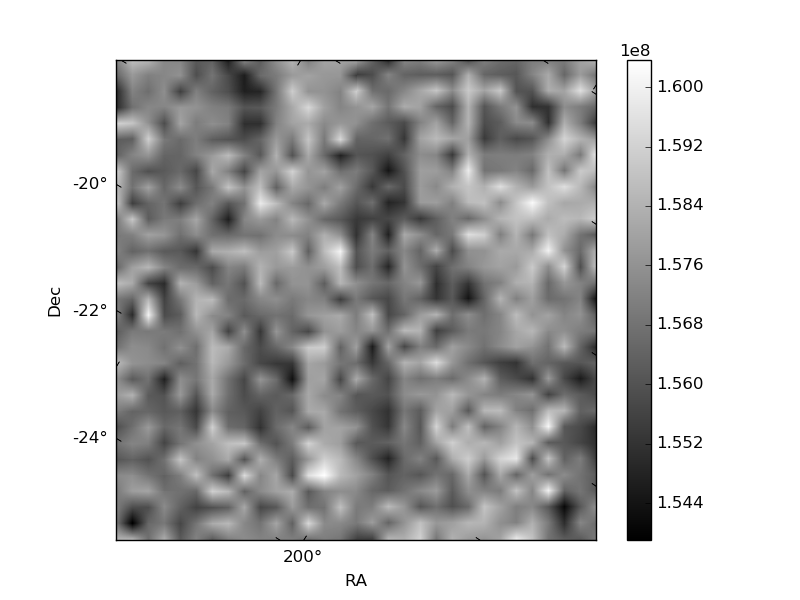
Histogram calculated using DETX and DETY for each event in the final _common_clean file
| Quadrant A |  |
 |
Quadrant B |
|---|---|---|---|
| Quadrant D |  |
 |
Quadrant C |
| Plot type | Count rate plots | Images |
|---|---|---|
| Comparison with Poisson distribution Blue bars denote a histogram of data divided into 1 sec bins. Red curve is a Poisson curve with rate = median count rate of data. |
 |
 |
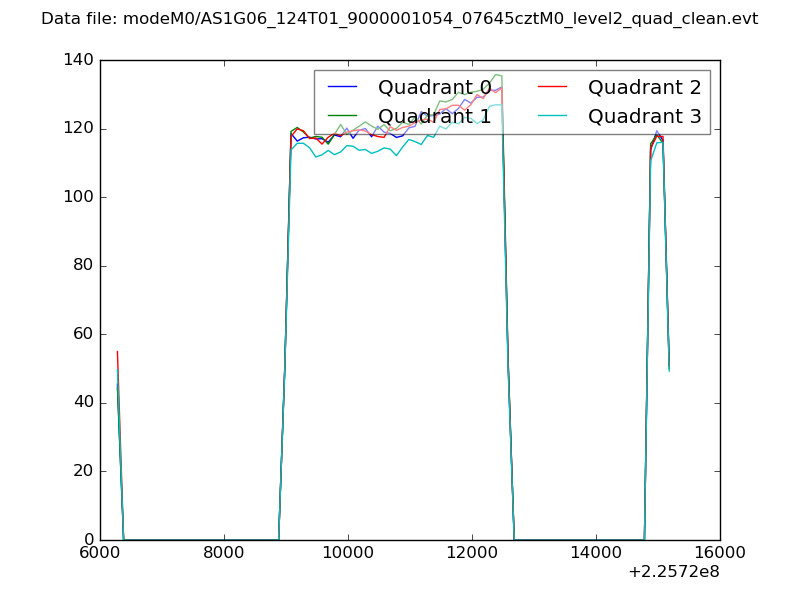
| Quadrant-wise count rates Data is divided into 100 sec bins |
 |
|
| Module-wise count rates for Quadrant A Data is divided into 100 sec bins |
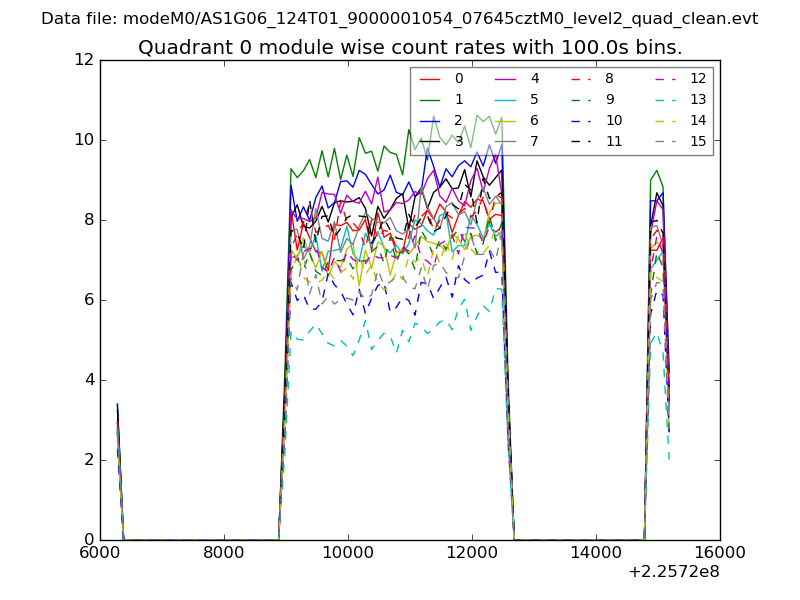 |
 |
| Module-wise count rates for Quadrant B Data is divided into 100 sec bins |
 |
 |
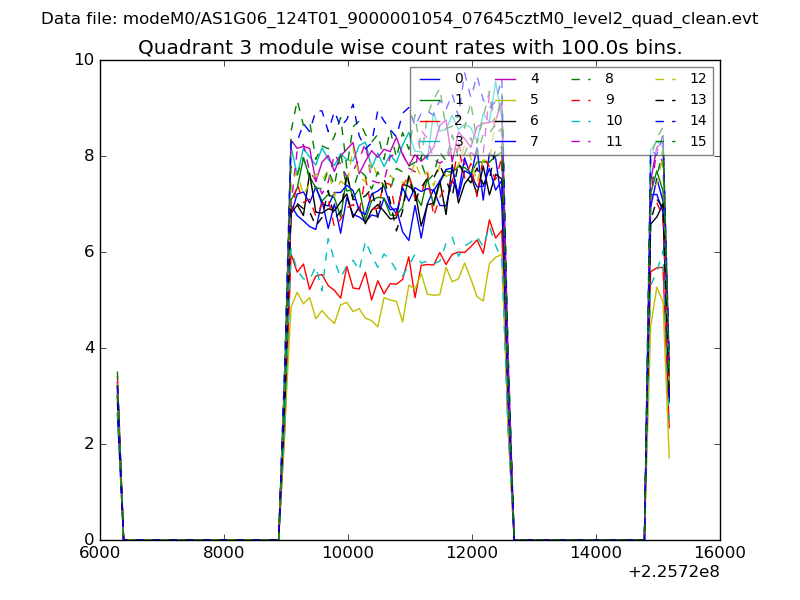
| Module-wise count rates for Quadrant C Data is divided into 100 sec bins |
 |
 |
| Module-wise count rates for Quadrant D Data is divided into 100 sec bins |
 |
 |
| Parameter | Plot |
|---|---|
| CZT HV Monitor |  |
| D_VDD | 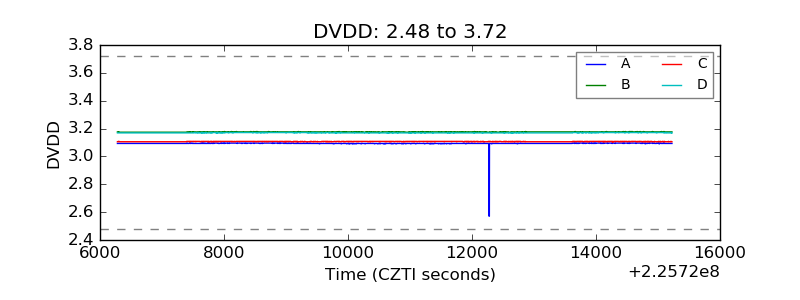 |
| Temperature 1 | 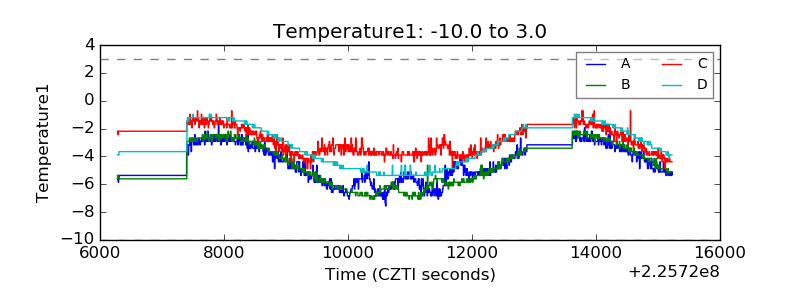 |
| Veto HV Monitor | 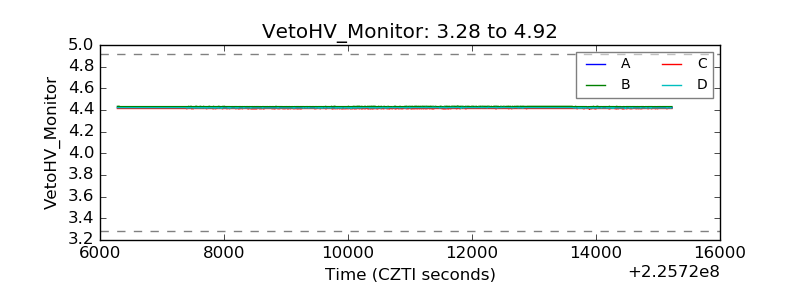 |
| Veto LLD | 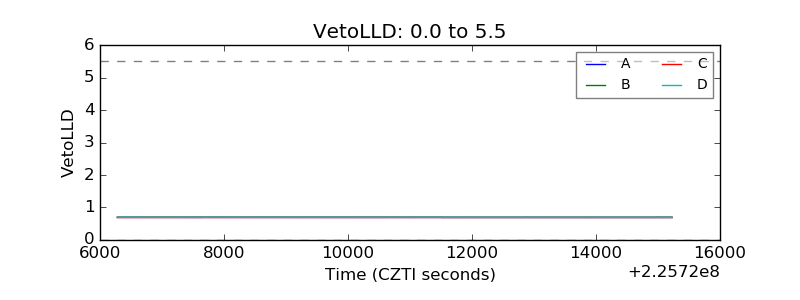 |
| Alpha Counter | 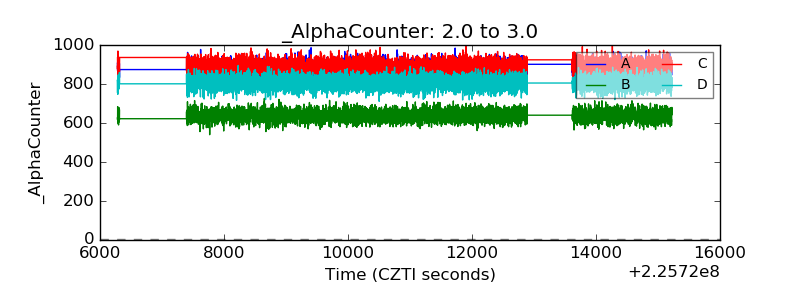 |
| _CPM_Rate | 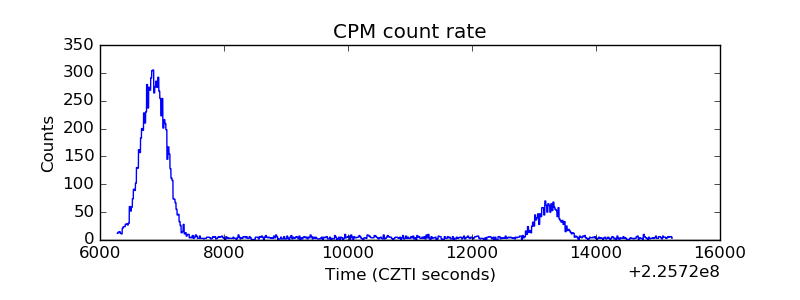 |
| CZT Counter | 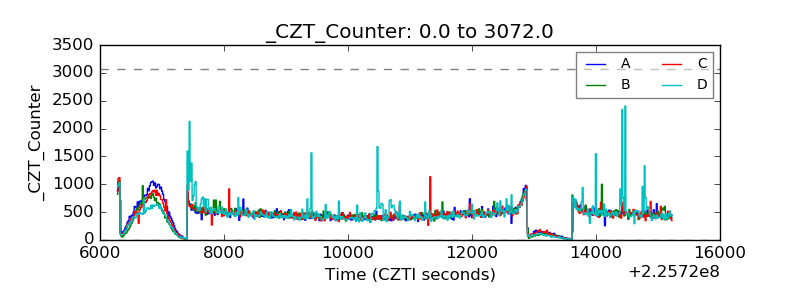 |
| +2.5 Volts monitor |  |
| +5 Volts monitor |  |
| _ROLL_ROT | 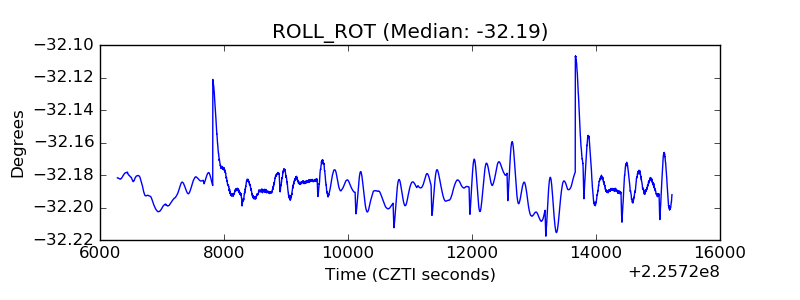 |
| _Roll_DEC | 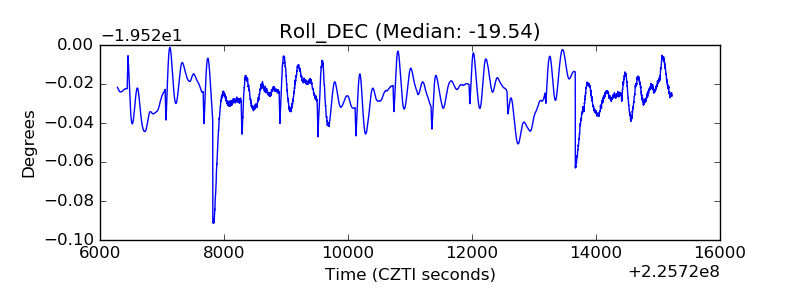 |
| _Roll_RA | 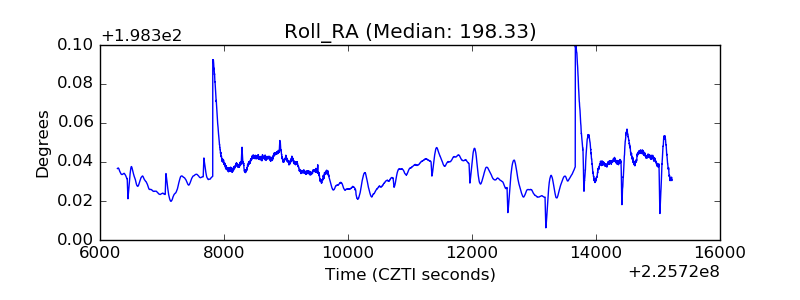 |
| Veto Counter | 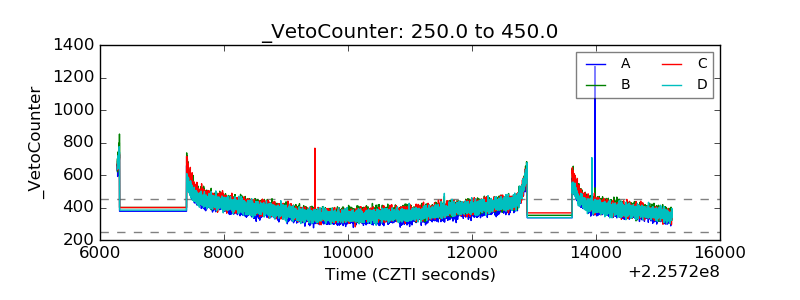 |