| Param | Original file | Final file |
|---|---|---|
| Filename | modeM0/AS1G06_124T01_9000001054_07646cztM0_level2.evt | modeM0/AS1G06_124T01_9000001054_07646cztM0_level2_quad_clean.evt |
| Size (bytes) | 612,040,320 | 81,504,000 |
| Size | 583.7 MB | 77.7 MB |
| Events in quadrant A | 3,414,109 | 497,332 |
| Events in quadrant B | 3,538,314 | 500,670 |
| Events in quadrant C | 7,462,036 | 475,182 |
| Events in quadrant D | 3,621,448 | 480,714 |
| Mode SS | |||
|---|---|---|---|
| Quadrant | BADHDUFLAG | Total packets | Discarded packets |
| A | 0 | 150 | 0 |
| B | 0 | 150 | 0 |
| C | 0 | 150 | 0 |
| D | 0 | 150 | 0 |
| Mode M9 | |||
|---|---|---|---|
| Quadrant | BADHDUFLAG | Total packets | Discarded packets |
| A | 0 | 2 | 0 |
| B | 0 | 2 | 0 |
| C | 0 | 2 | 0 |
| D | 0 | 2 | 0 |
| Mode M0 | |||
|---|---|---|---|
| Quadrant | BADHDUFLAG | Total packets | Discarded packets |
| A | 0 | 15178 | 2 |
| B | 0 | 15339 | 1 |
| C | 0 | 27399 | 1 |
| D | 0 | 15998 | 1 |
| Quadrant | Total seconds | Saturated seconds | Saturation percentage |
|---|---|---|---|
| A | 7386 | 58 | 0.785269% |
| B | 7386 | 78 | 1.056052% |
| C | 7386 | 278 | 3.763878% |
| D | 7386 | 71 | 0.961278% |
Noise dominated data is calculated using 1-second bins in cleaned event files. If a bin has >2000 counts, and if more than 50% of those come from <1% of pixels, then it is considered to be noise-dominated and hence unusable.
| Quadrant | # 1 sec bins | Bins with >0 counts | Bins with >2000 counts | High rate bins dominated by noise | Noise dominated (total time) | Noise dominated (detector-on time) | Marked lightcurve |
|---|---|---|---|---|---|---|---|
| A | 7636 | 7387 | 0 | 0 | 0.00% | 0.00% | 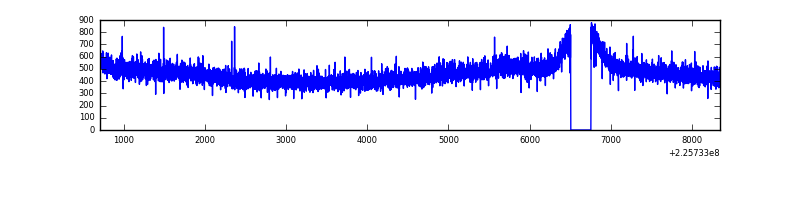 |
| B | 7636 | 7387 | 0 | 0 | 0.00% | 0.00% | 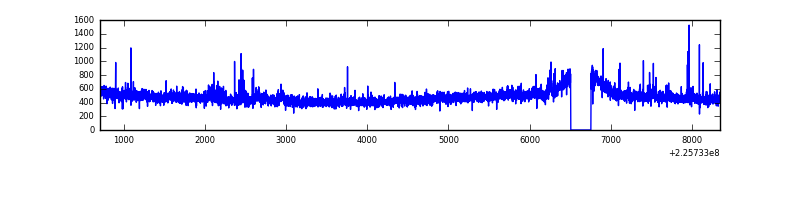 |
| C | 7636 | 7387 | 77 | 77 | 1.01% | 1.04% | 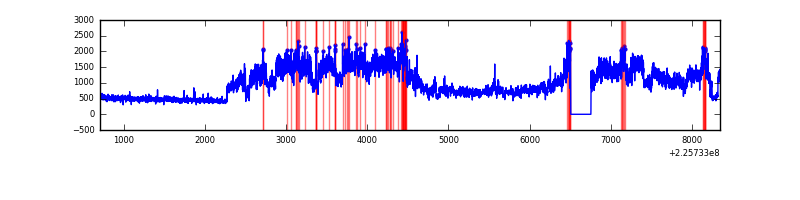 |
| D | 7636 | 7387 | 43 | 43 | 0.56% | 0.58% |  |
Top three noisy pixels from each quadrant. If the there are fewer than three noisy pixels in the level2.evt file, extra rows are filled as -1
| Pixel properties | Quadrant properties | ||||||
|---|---|---|---|---|---|---|---|
| Quadrant | DetID | PixID | Counts | Sigma | Mean | Median | Sigma |
| A | 0 | 226 | 8474 | 42.2 | 884 | 866 | 180.3 |
| A | 12 | 194 | 7905 | 39.04 | 884 | 866 | 180.3 |
| A | 13 | 14 | 6471 | 31.09 | 884 | 866 | 180.3 |
| B | 0 | 219 | 38214 | 217.81 | 886 | 863 | 171.5 |
| B | 0 | 214 | 27036 | 152.62 | 886 | 863 | 171.5 |
| B | 4 | 173 | 24730 | 139.18 | 886 | 863 | 171.5 |
| C | 9 | 68 | 4120711 | 20916.37 | 848 | 853 | 197.0 |
| C | 5 | 37 | 27097 | 133.24 | 848 | 853 | 197.0 |
| C | 13 | 61 | 6339 | 27.85 | 848 | 853 | 197.0 |
| D | 13 | 104 | 217942 | 1035.35 | 857 | 830 | 209.7 |
| D | 14 | 34 | 64453 | 303.4 | 857 | 830 | 209.7 |
| D | 2 | 152 | 33661 | 156.56 | 857 | 830 | 209.7 |
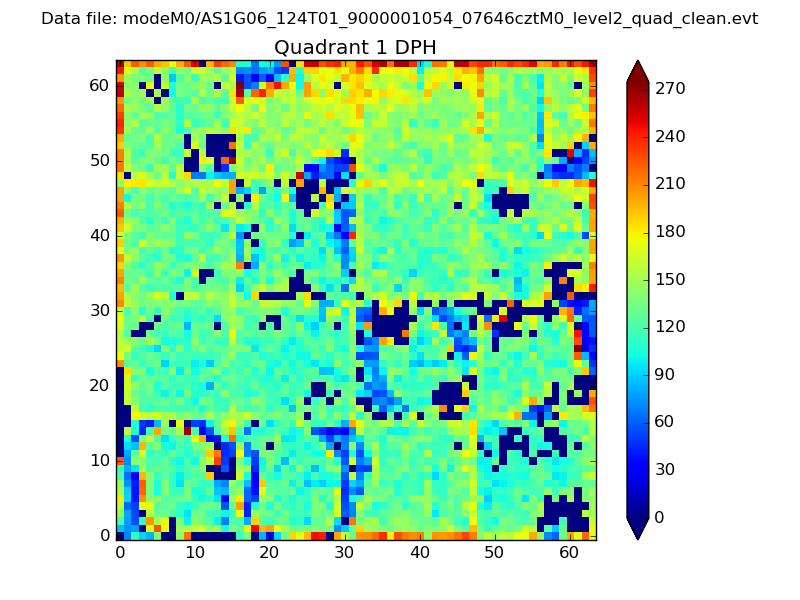
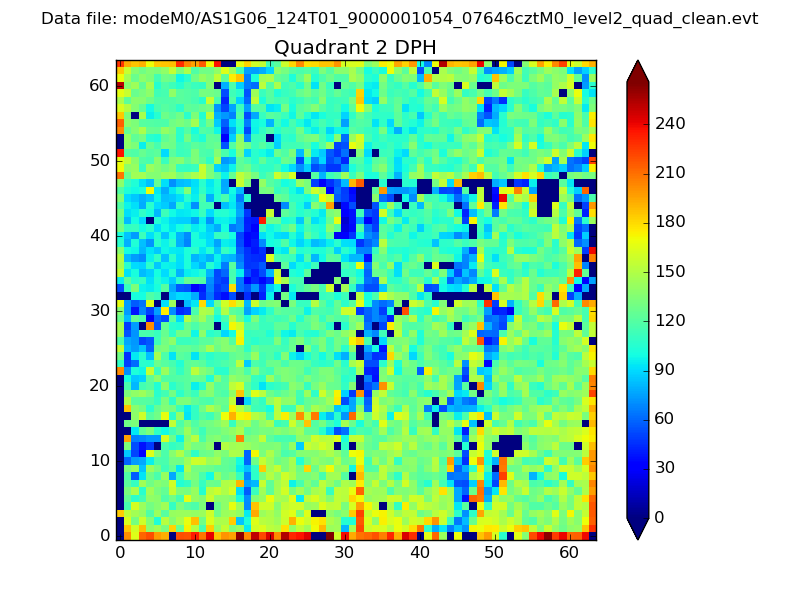
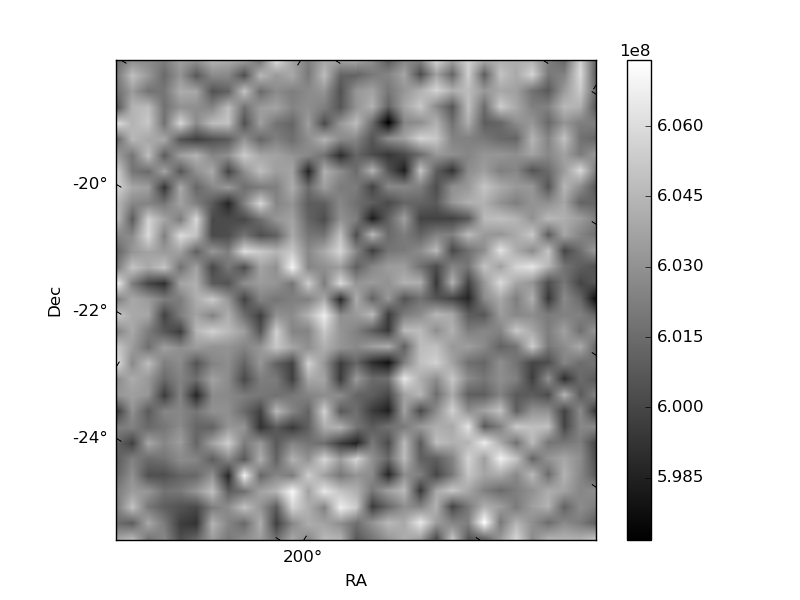
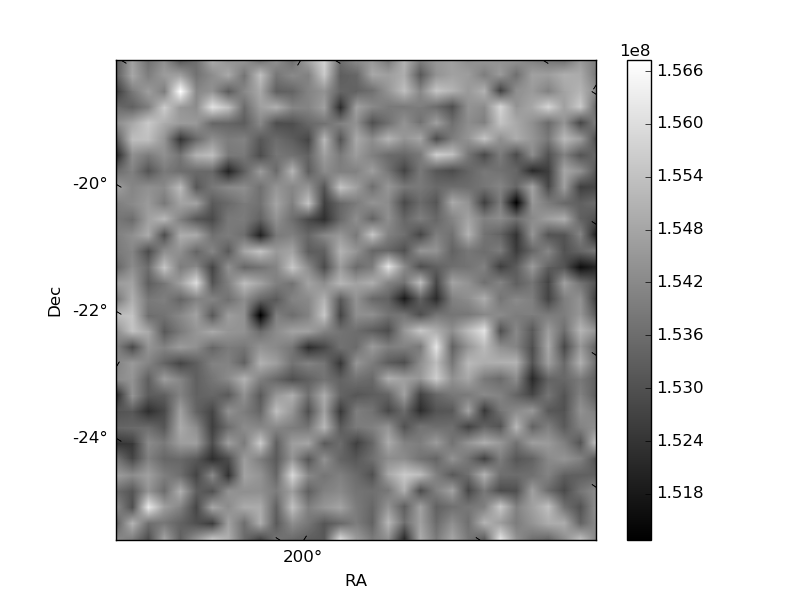
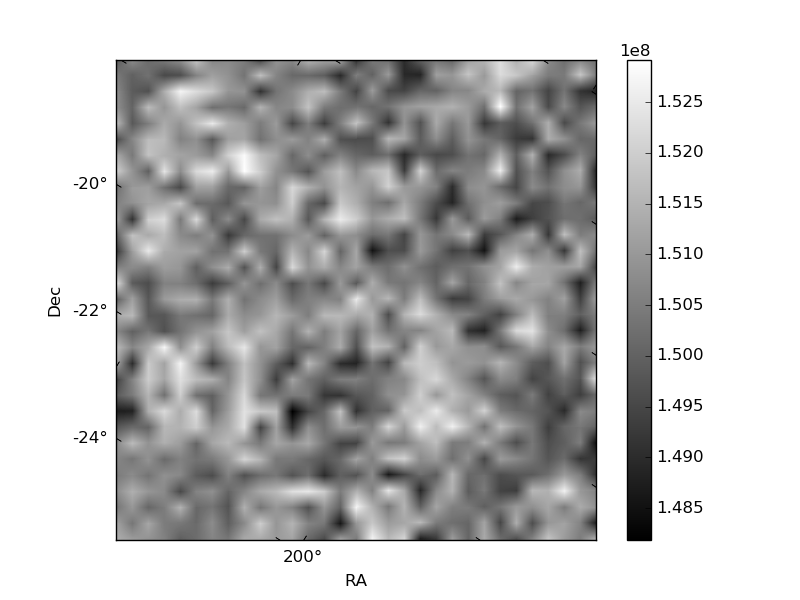
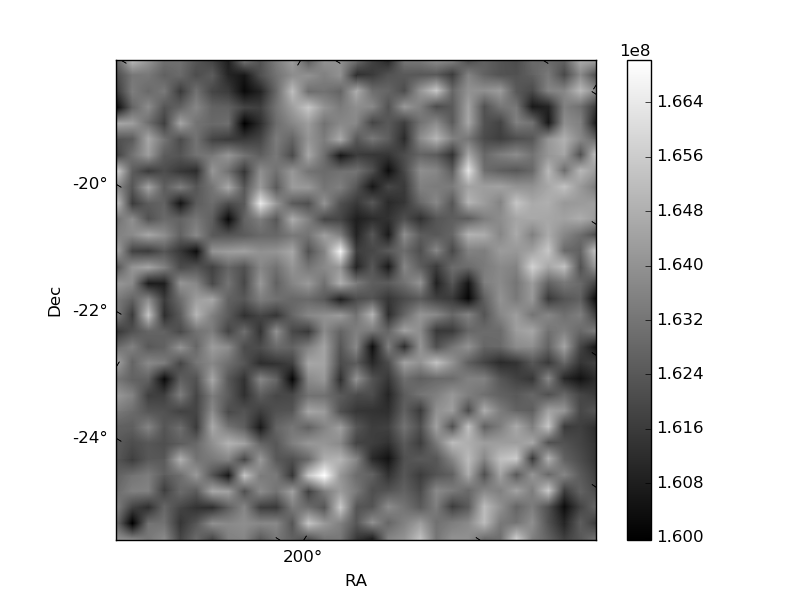
Histogram calculated using DETX and DETY for each event in the final _common_clean file
| Quadrant A | 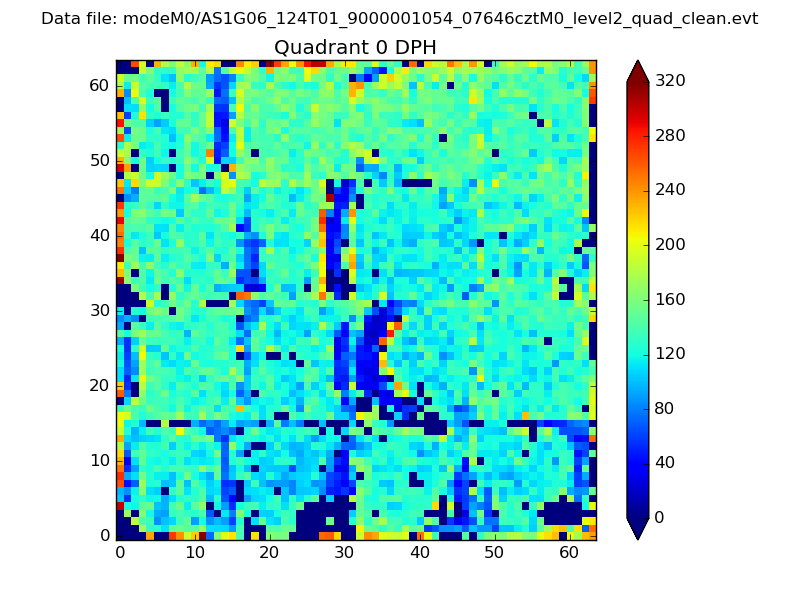 |
 |
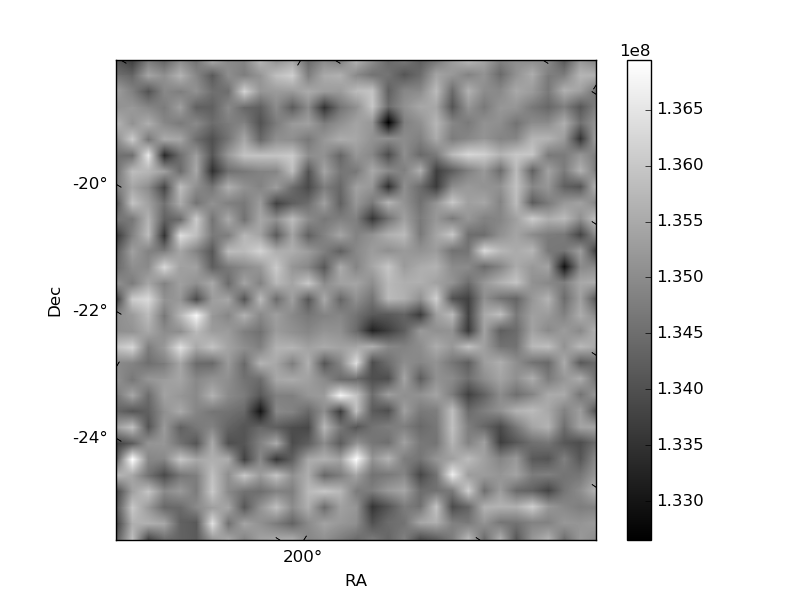
Quadrant B |
|---|---|---|---|
| Quadrant D | 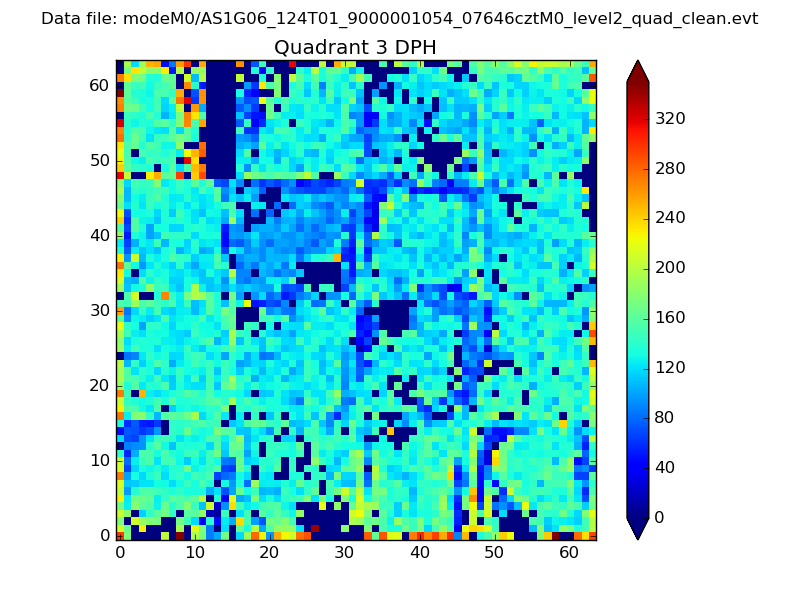 |
 |
Quadrant C |
| Plot type | Count rate plots | Images |
|---|---|---|
| Comparison with Poisson distribution Blue bars denote a histogram of data divided into 1 sec bins. Red curve is a Poisson curve with rate = median count rate of data. |
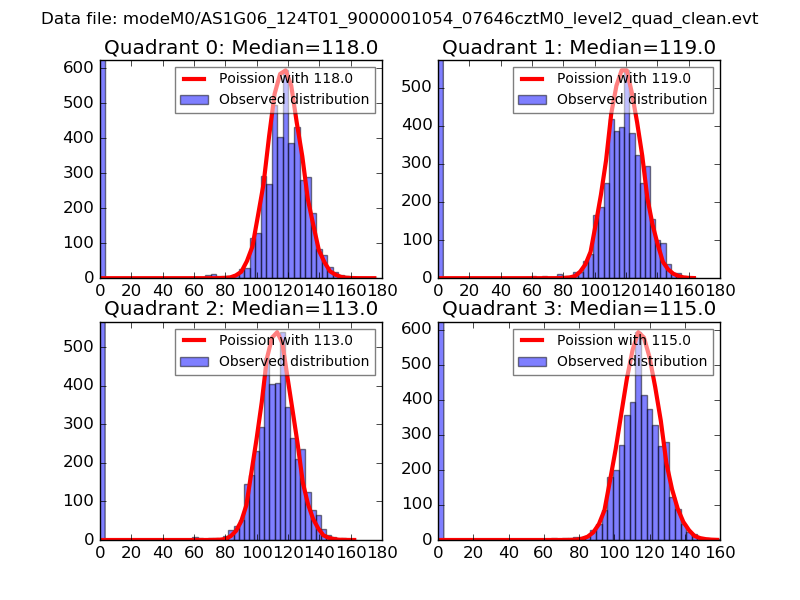 |
 |
| Quadrant-wise count rates Data is divided into 100 sec bins |
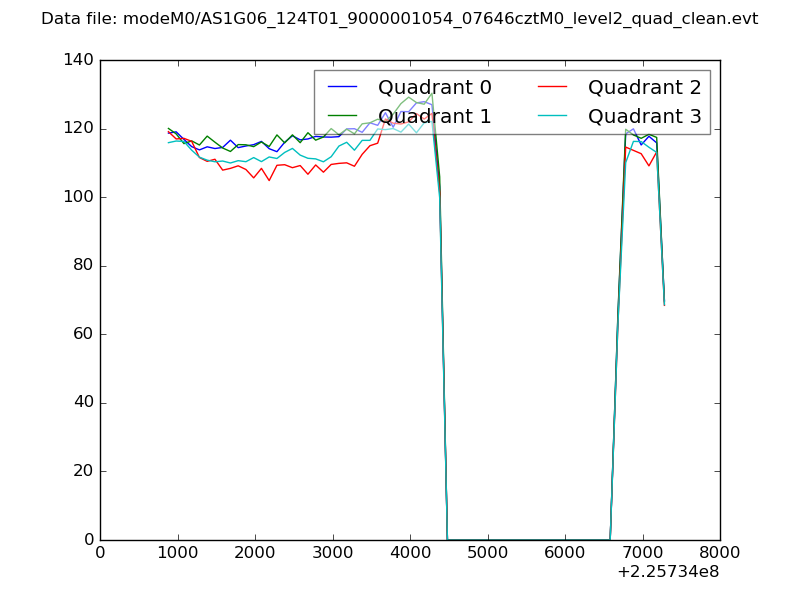 |
|
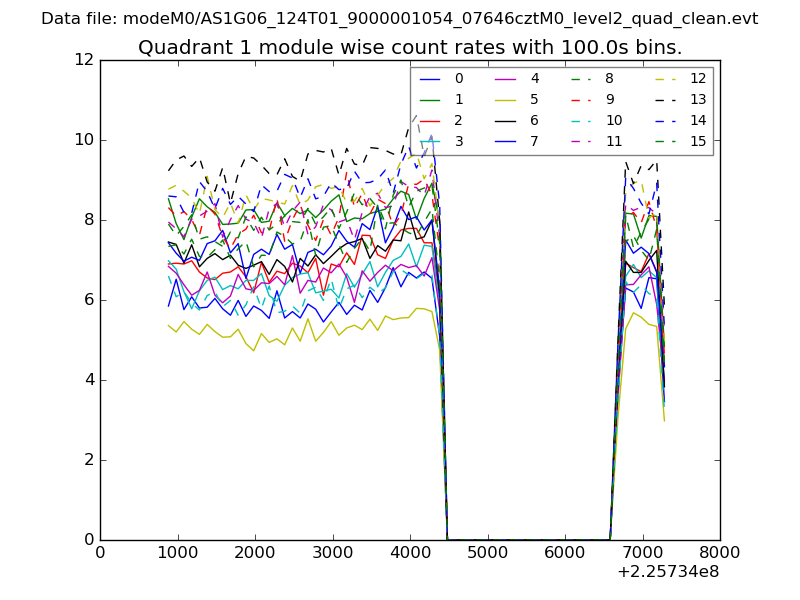
| Module-wise count rates for Quadrant A Data is divided into 100 sec bins |
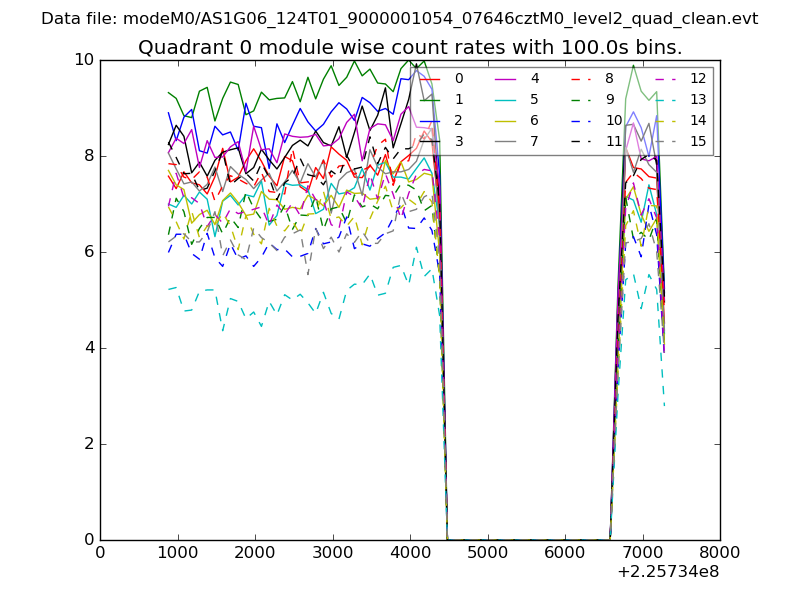 |
 |
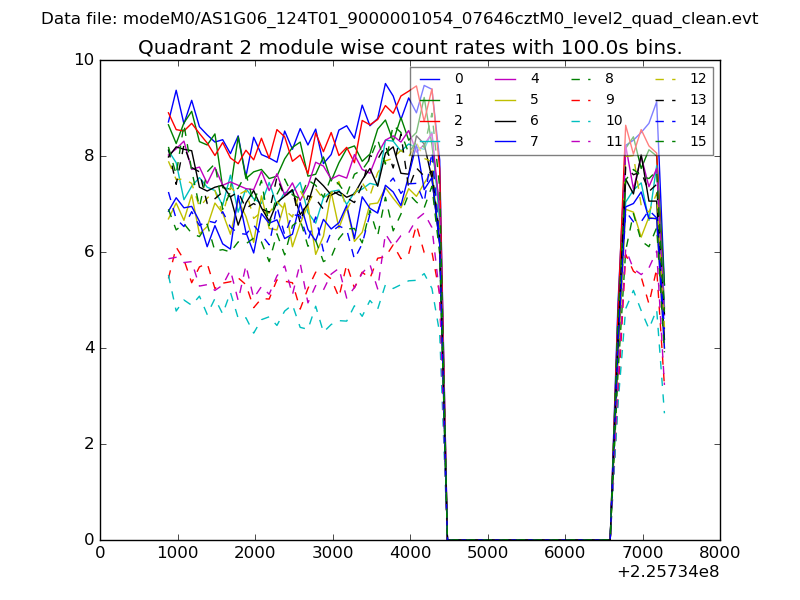
| Module-wise count rates for Quadrant B Data is divided into 100 sec bins |
 |
 |
| Module-wise count rates for Quadrant C Data is divided into 100 sec bins |
 |
 |
| Module-wise count rates for Quadrant D Data is divided into 100 sec bins |
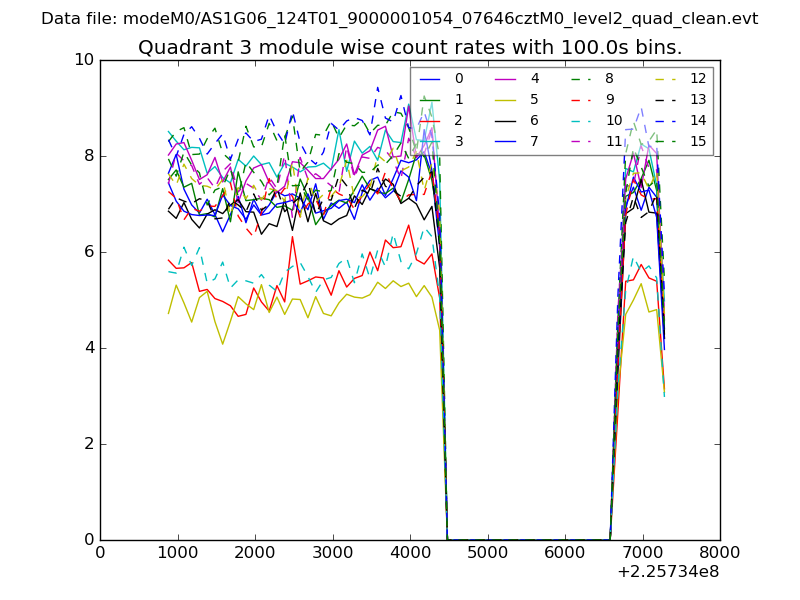 |
 |
| Parameter | Plot |
|---|---|
| CZT HV Monitor | 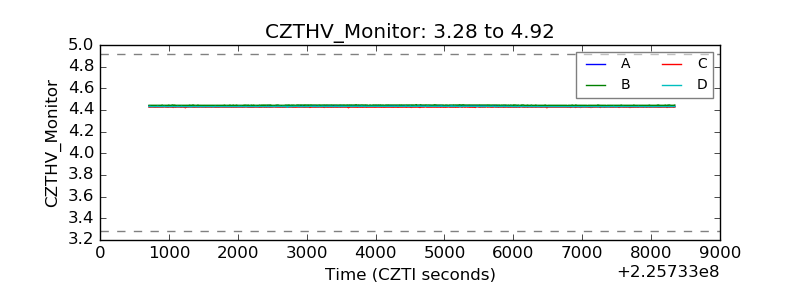 |
| D_VDD | 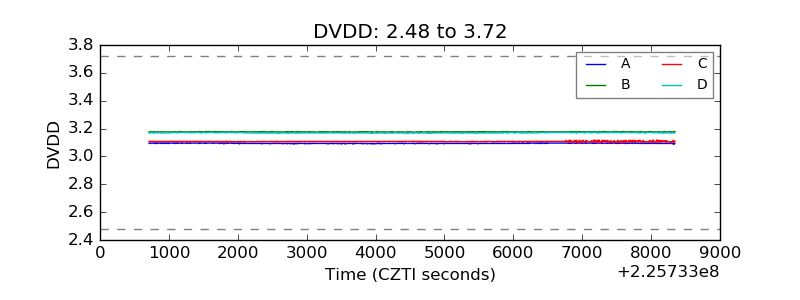 |
| Temperature 1 | 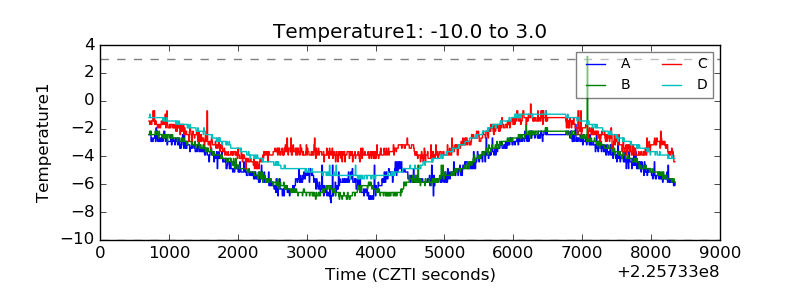 |
| Veto HV Monitor | 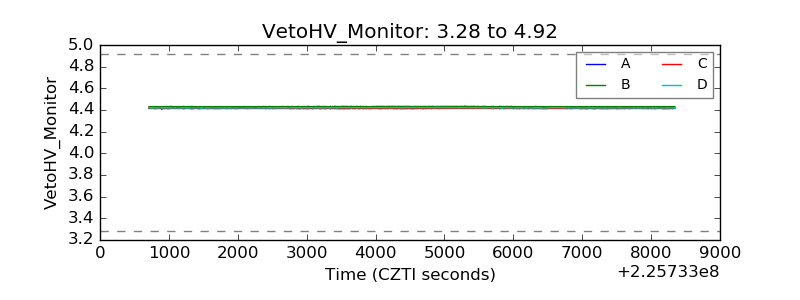 |
| Veto LLD | 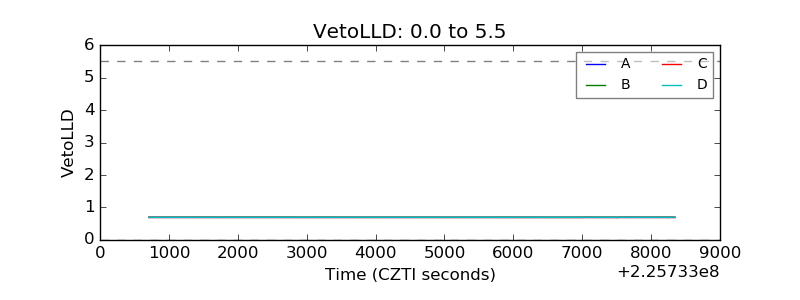 |
| Alpha Counter | 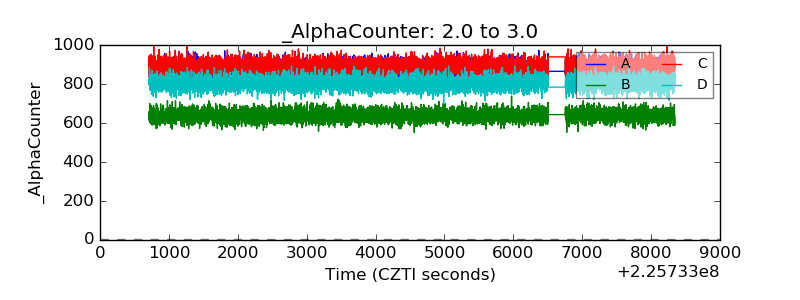 |
| _CPM_Rate | 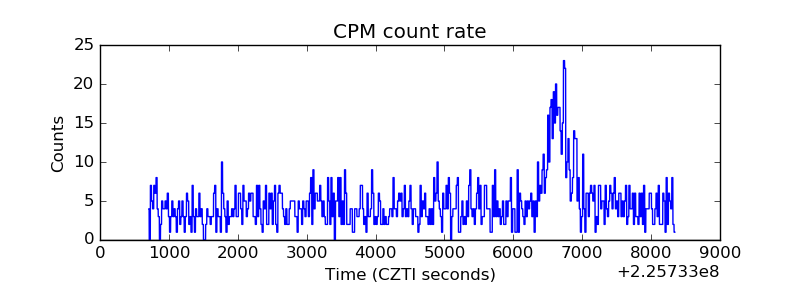 |
| CZT Counter | 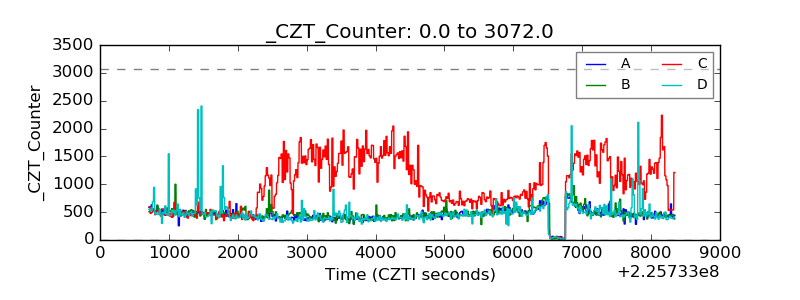 |
| +2.5 Volts monitor | 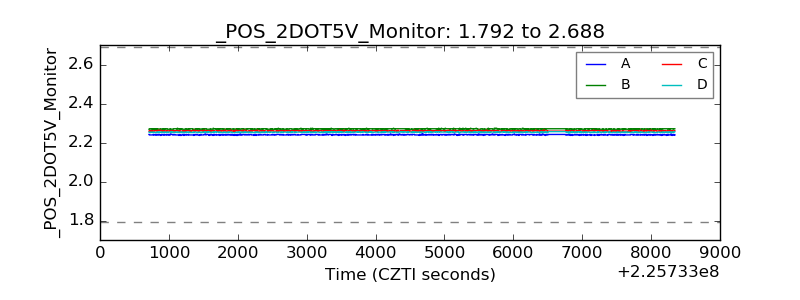 |
| +5 Volts monitor | 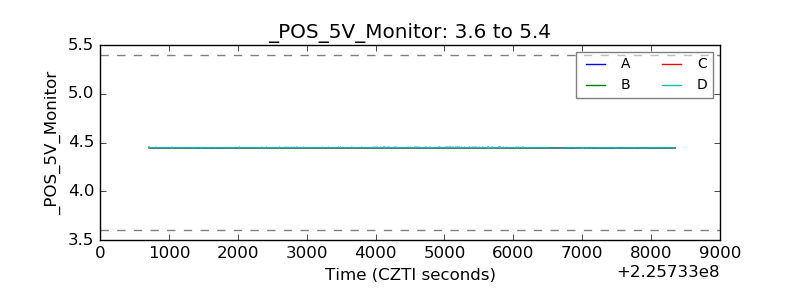 |
| _ROLL_ROT |  |
| _Roll_DEC | 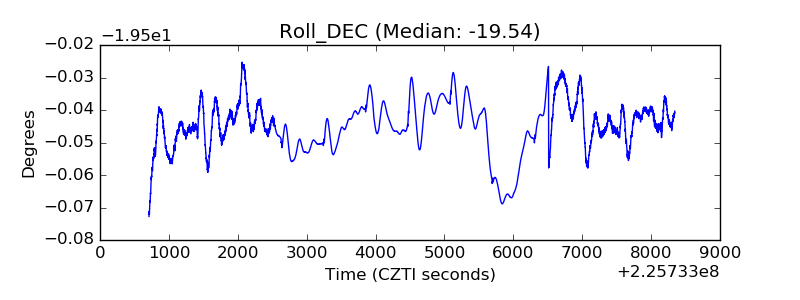 |
| _Roll_RA | 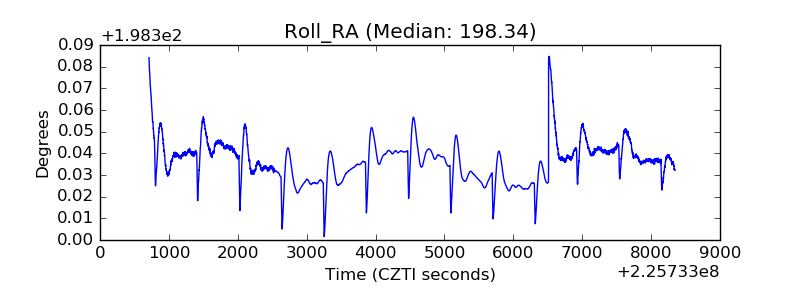 |
| Veto Counter | 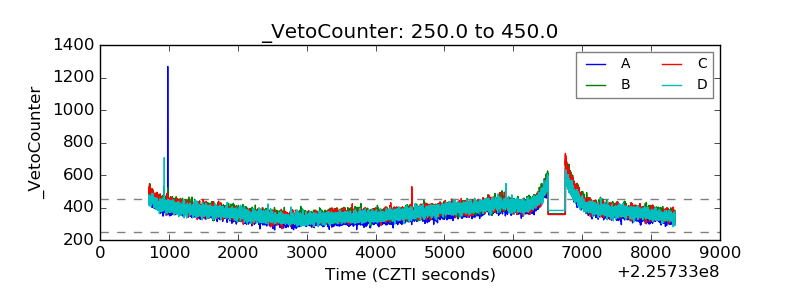 |