| Param | Original file | Final file |
|---|---|---|
| Filename | modeM0/AS1G06_124T01_9000001054_07651cztM0_level2.evt | modeM0/AS1G06_124T01_9000001054_07651cztM0_level2_quad_clean.evt |
| Size (bytes) | 1,825,620,480 | 270,636,480 |
| Size | 1.7 GB | 258.1 MB |
| Events in quadrant A | 11,354,314 | 1,646,582 |
| Events in quadrant B | 11,780,185 | 1,666,500 |
| Events in quadrant C | 18,717,378 | 1,610,067 |
| Events in quadrant D | 11,775,797 | 1,579,513 |
| Mode SS | |||
|---|---|---|---|
| Quadrant | BADHDUFLAG | Total packets | Discarded packets |
| A | 0 | 504 | 0 |
| B | 0 | 504 | 0 |
| C | 0 | 504 | 0 |
| D | 0 | 504 | 0 |
| Mode M9 | |||
|---|---|---|---|
| Quadrant | BADHDUFLAG | Total packets | Discarded packets |
| A | 0 | 20 | 0 |
| B | 0 | 20 | 0 |
| C | 0 | 20 | 0 |
| D | 0 | 20 | 0 |
| Mode M0 | |||
|---|---|---|---|
| Quadrant | BADHDUFLAG | Total packets | Discarded packets |
| A | 0 | 50709 | 7 |
| B | 0 | 51700 | 6 |
| C | 0 | 72716 | 6 |
| D | 0 | 52783 | 6 |
| Quadrant | Total seconds | Saturated seconds | Saturation percentage |
|---|---|---|---|
| A | 24624 | 206 | 0.836582% |
| B | 24624 | 287 | 1.165530% |
| C | 24624 | 828 | 3.362573% |
| D | 24624 | 217 | 0.881254% |
Noise dominated data is calculated using 1-second bins in cleaned event files. If a bin has >2000 counts, and if more than 50% of those come from <1% of pixels, then it is considered to be noise-dominated and hence unusable.
| Quadrant | # 1 sec bins | Bins with >0 counts | Bins with >2000 counts | High rate bins dominated by noise | Noise dominated (total time) | Noise dominated (detector-on time) | Marked lightcurve |
|---|---|---|---|---|---|---|---|
| A | 26659 | 24631 | 1 | 1 | 0.00% | 0.00% | 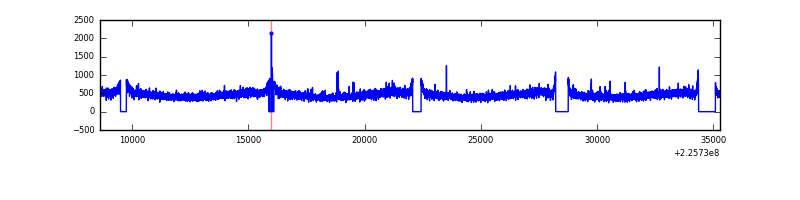 |
| B | 26659 | 24631 | 4 | 4 | 0.02% | 0.02% | 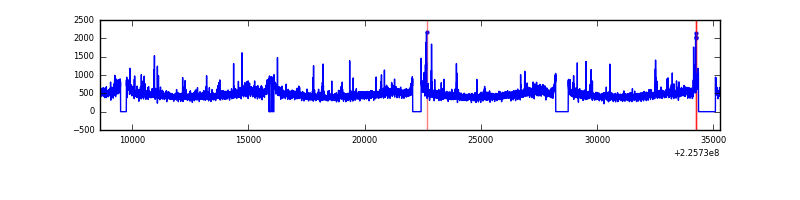 |
| C | 26659 | 24631 | 471 | 471 | 1.77% | 1.91% | 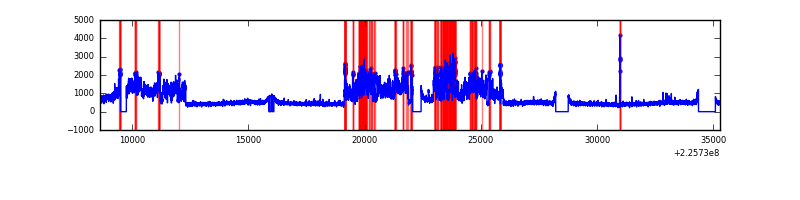 |
| D | 26659 | 24631 | 94 | 94 | 0.35% | 0.38% | 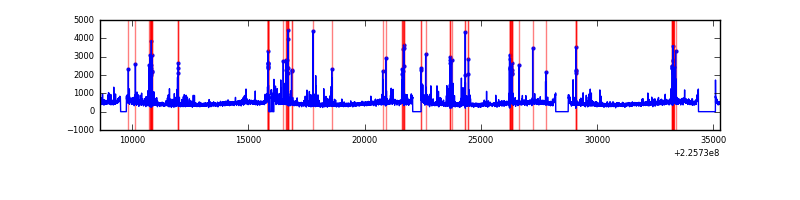 |
Top three noisy pixels from each quadrant. If the there are fewer than three noisy pixels in the level2.evt file, extra rows are filled as -1
| Pixel properties | Quadrant properties | ||||||
|---|---|---|---|---|---|---|---|
| Quadrant | DetID | PixID | Counts | Sigma | Mean | Median | Sigma |
| A | 0 | 226 | 27777 | 42.05 | 2931 | 2870 | 592.3 |
| A | 13 | 248 | 27133 | 40.96 | 2931 | 2870 | 592.3 |
| A | 12 | 194 | 26449 | 39.81 | 2931 | 2870 | 592.3 |
| B | 4 | 81 | 130382 | 226.75 | 2945 | 2878 | 562.3 |
| B | 4 | 173 | 83409 | 143.21 | 2945 | 2878 | 562.3 |
| B | 0 | 214 | 75889 | 129.84 | 2945 | 2878 | 562.3 |
| C | 9 | 68 | 7612216 | 11575.14 | 2829 | 2843 | 657.4 |
| C | 5 | 37 | 31100 | 42.98 | 2829 | 2843 | 657.4 |
| C | 13 | 61 | 21542 | 28.44 | 2829 | 2843 | 657.4 |
| D | 13 | 104 | 487116 | 699.14 | 2848 | 2759 | 692.8 |
| D | 2 | 14 | 181892 | 258.57 | 2848 | 2759 | 692.8 |
| D | 5 | 81 | 87005 | 121.6 | 2848 | 2759 | 692.8 |
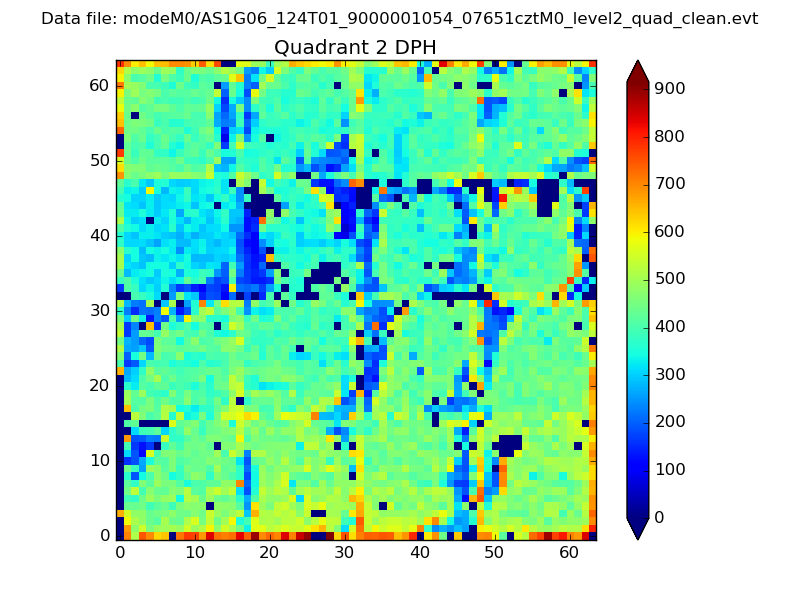
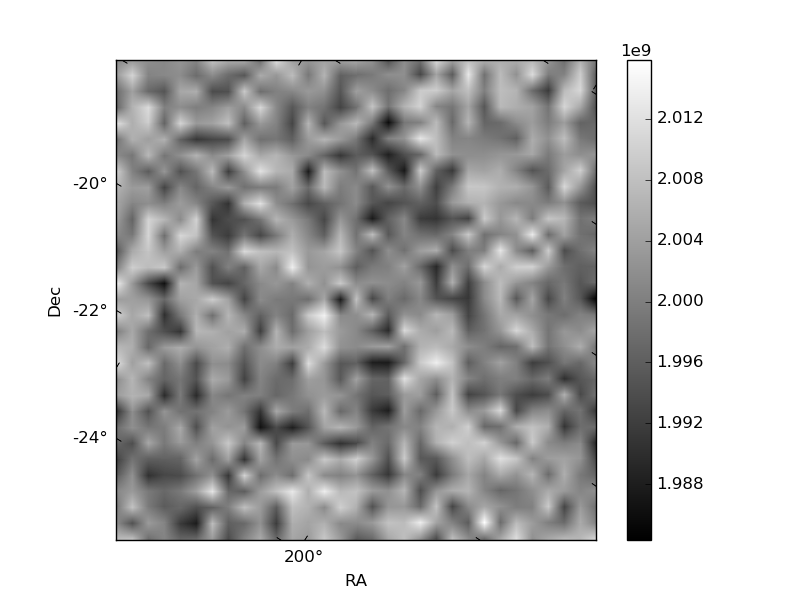
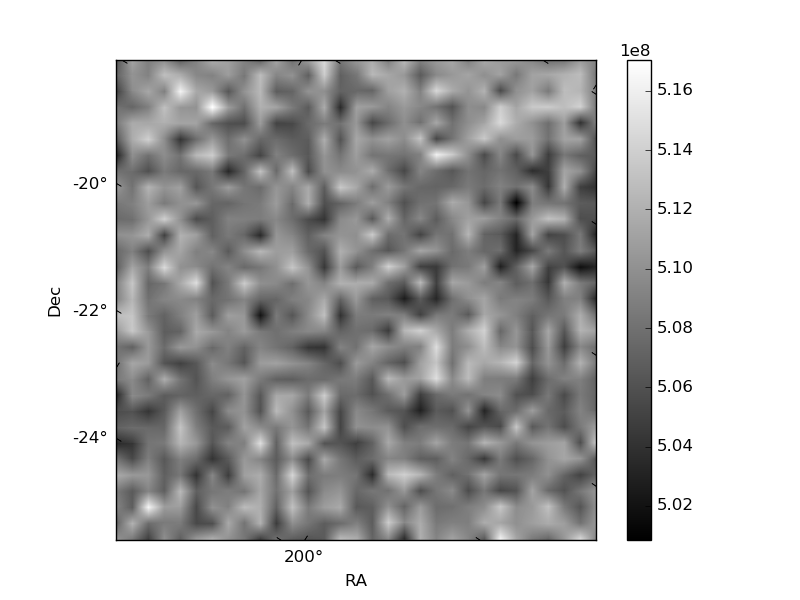
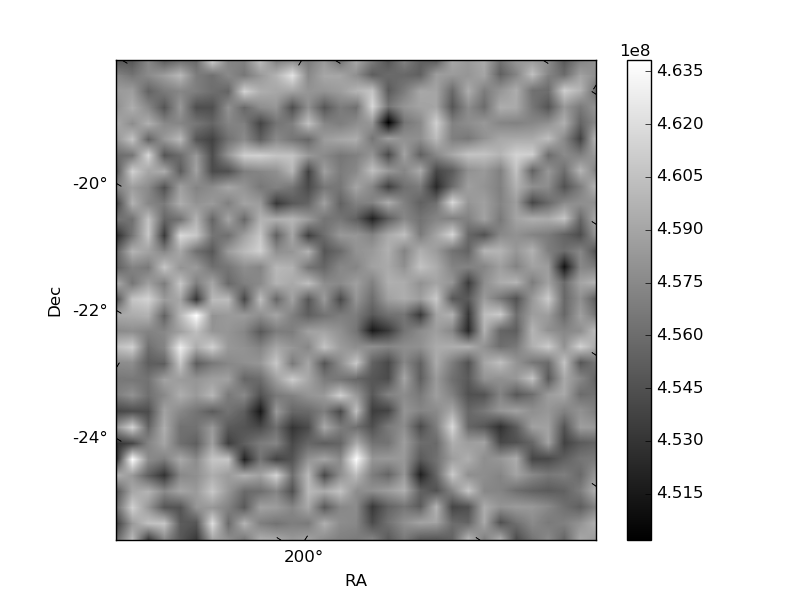
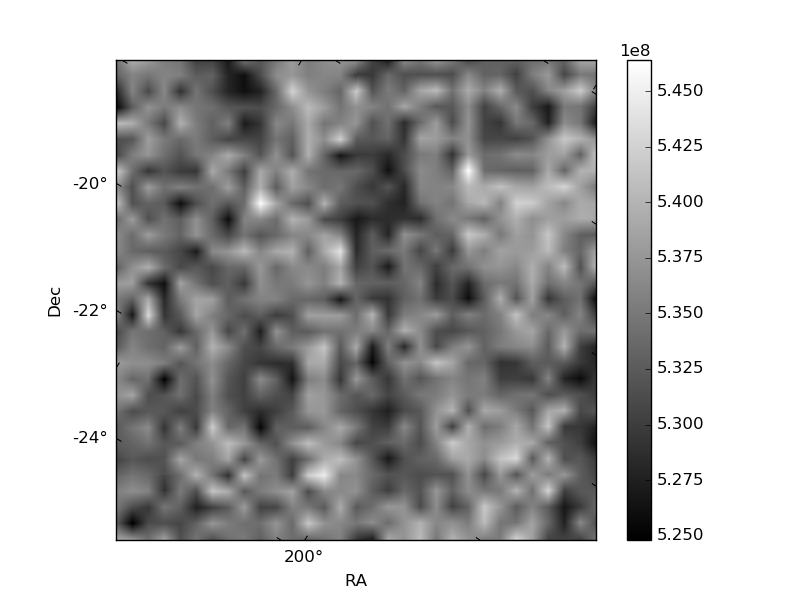
Histogram calculated using DETX and DETY for each event in the final _common_clean file
| Quadrant A | 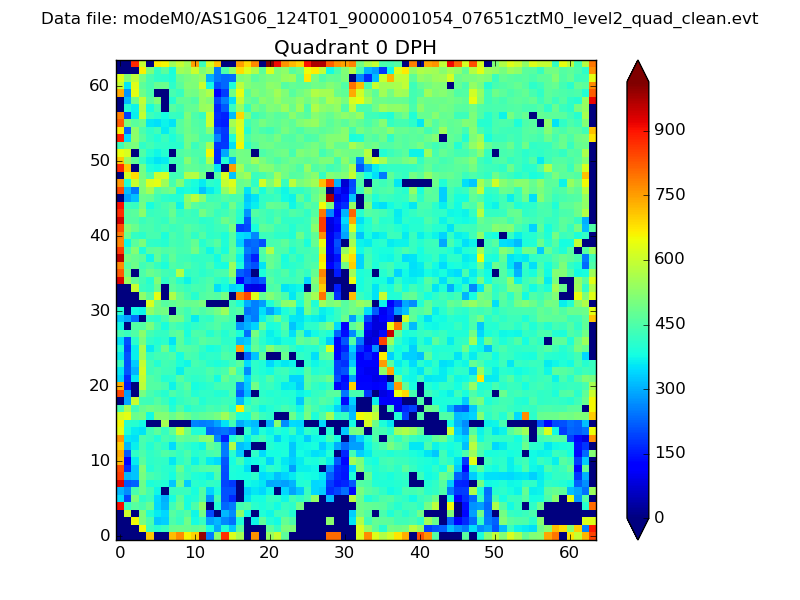 |
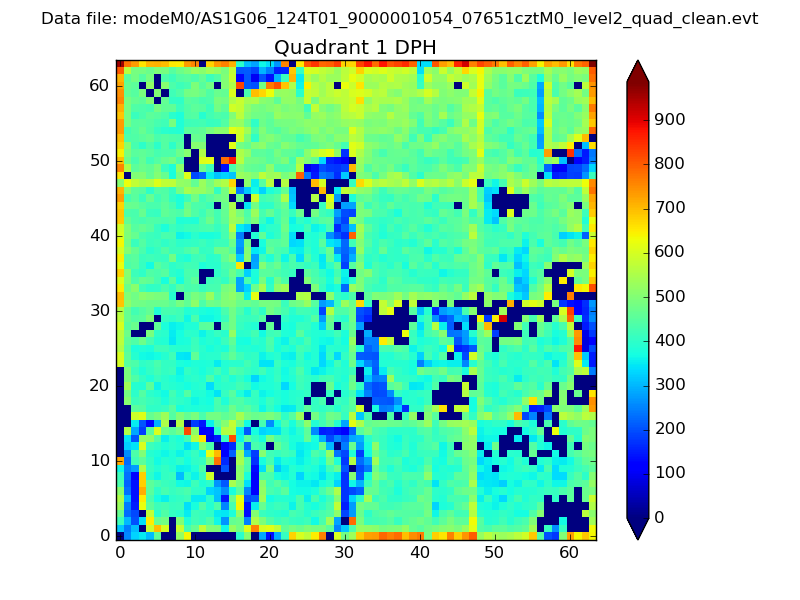 |
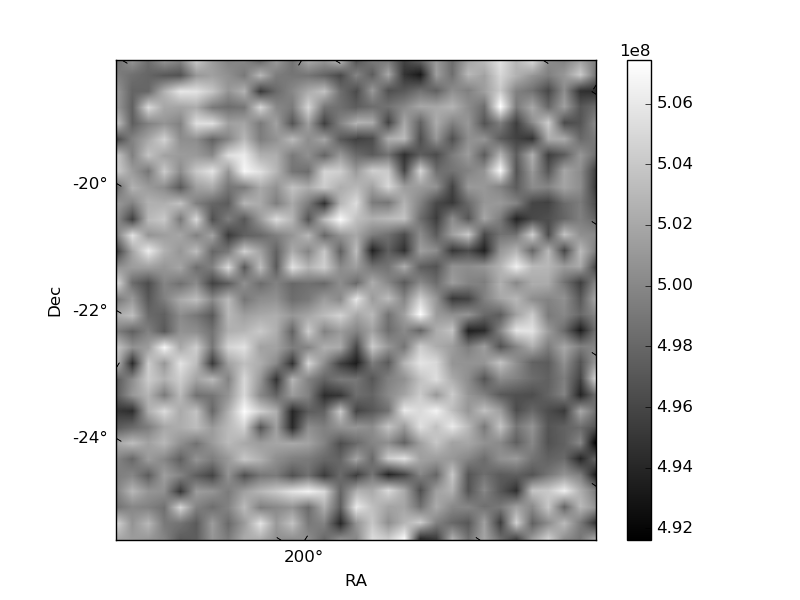
Quadrant B |
|---|---|---|---|
| Quadrant D | 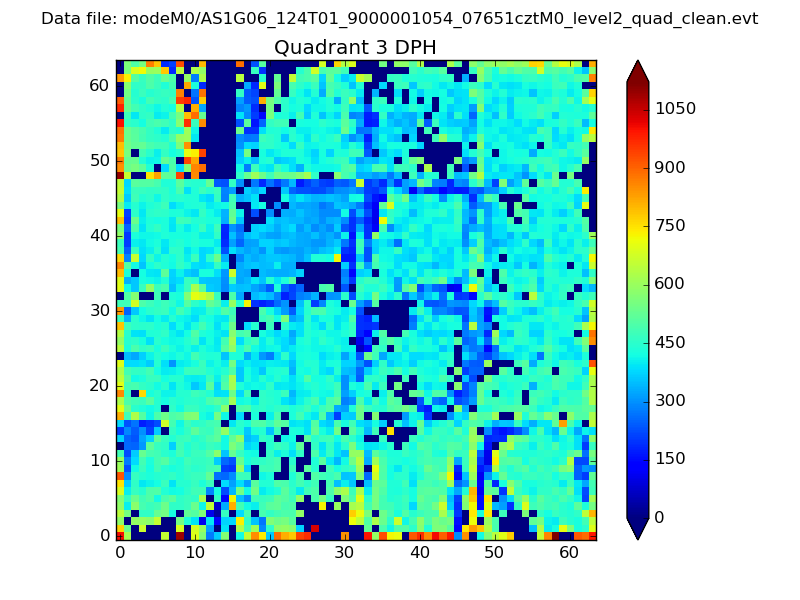 |
 |
Quadrant C |
| Plot type | Count rate plots | Images |
|---|---|---|
| Comparison with Poisson distribution Blue bars denote a histogram of data divided into 1 sec bins. Red curve is a Poisson curve with rate = median count rate of data. |
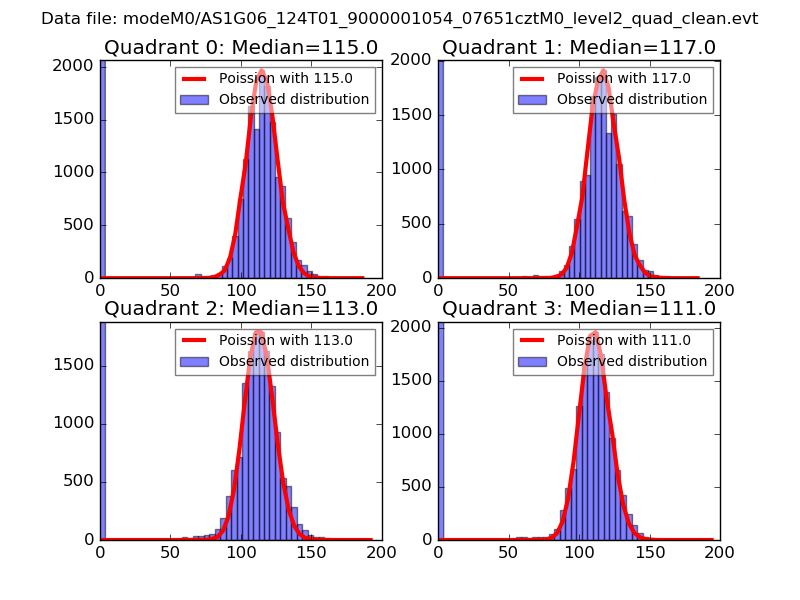 |
 |
| Quadrant-wise count rates Data is divided into 100 sec bins |
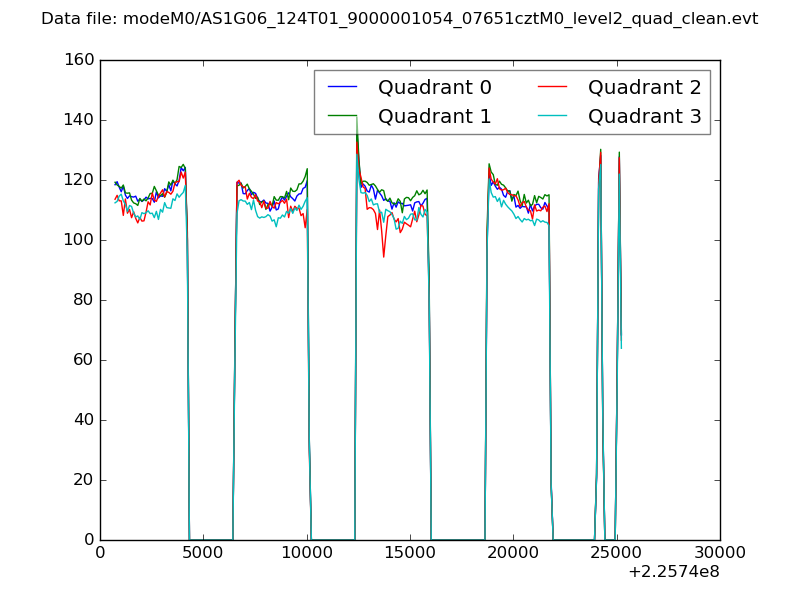 |
|
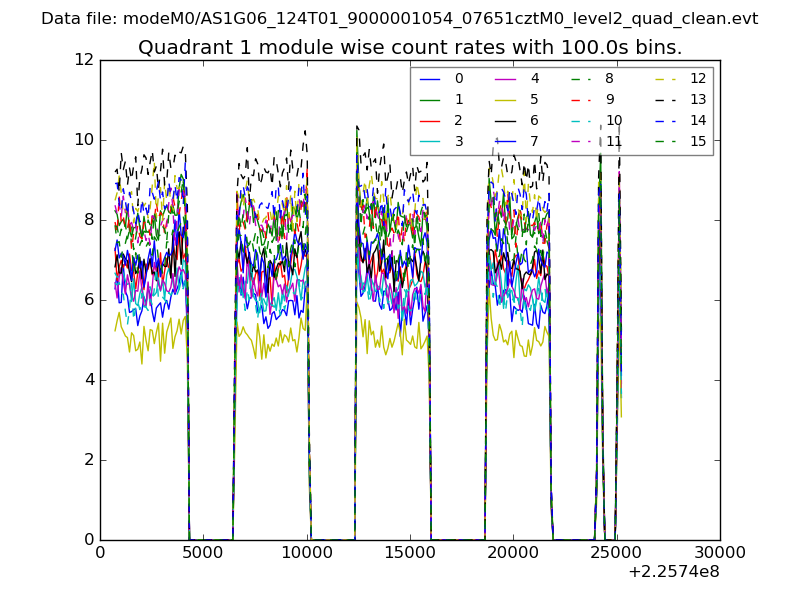
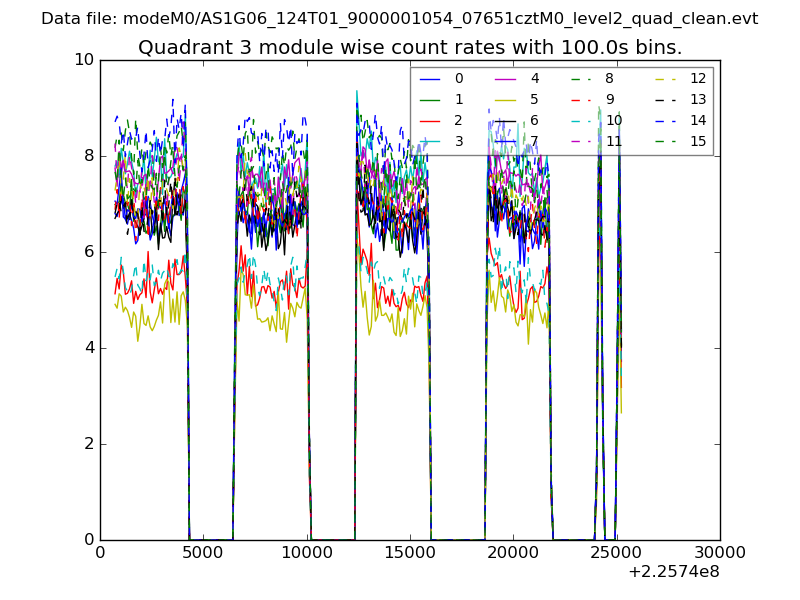
| Module-wise count rates for Quadrant A Data is divided into 100 sec bins |
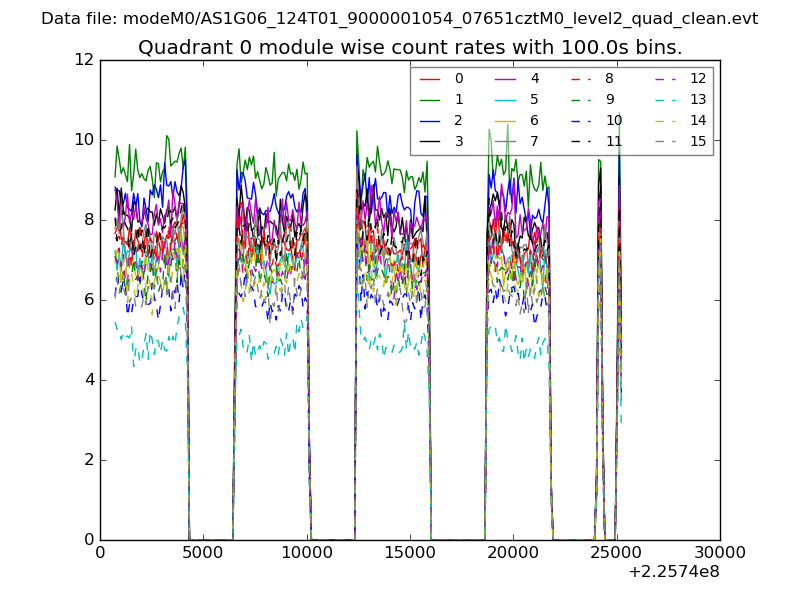 |
 |
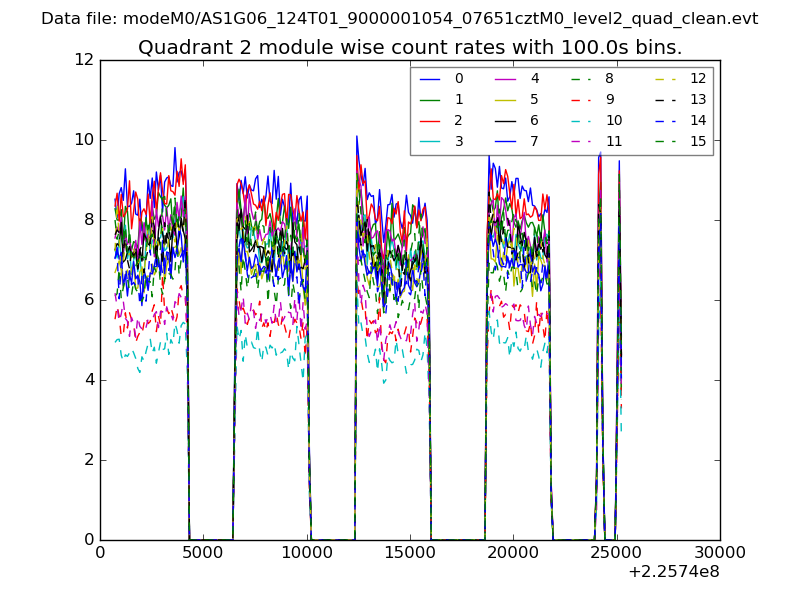
| Module-wise count rates for Quadrant B Data is divided into 100 sec bins |
 |
 |
| Module-wise count rates for Quadrant C Data is divided into 100 sec bins |
 |
 |
| Module-wise count rates for Quadrant D Data is divided into 100 sec bins |
 |
 |
| Parameter | Plot |
|---|---|
| CZT HV Monitor | 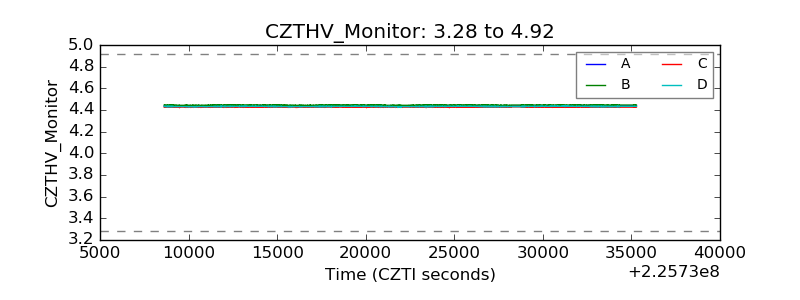 |
| D_VDD | 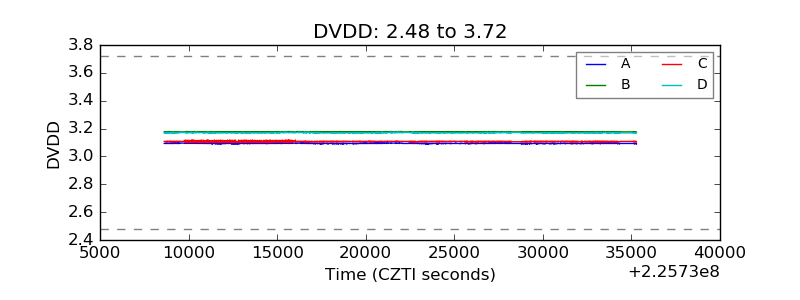 |
| Temperature 1 | 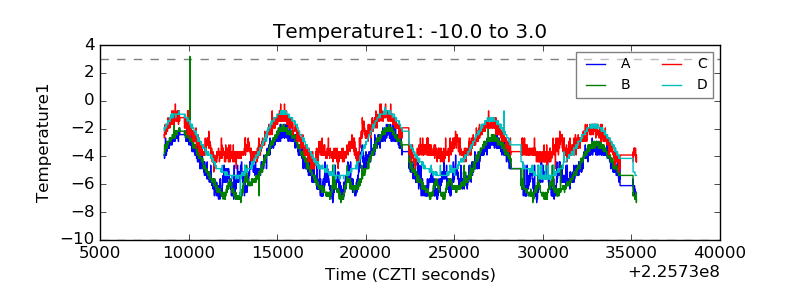 |
| Veto HV Monitor | 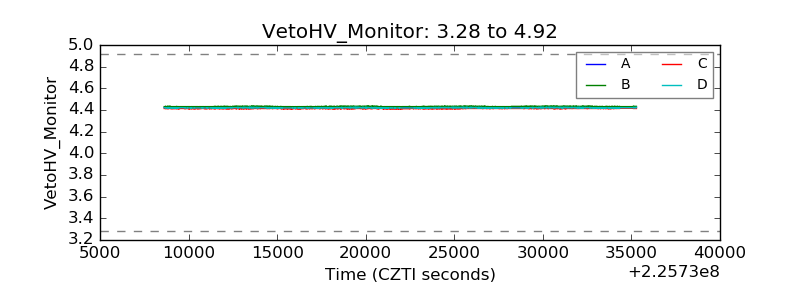 |
| Veto LLD | 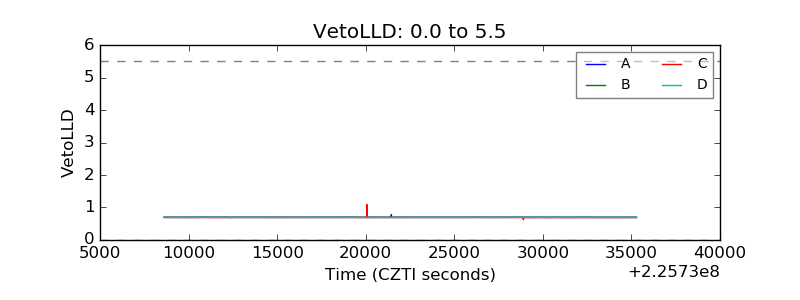 |
| Alpha Counter | 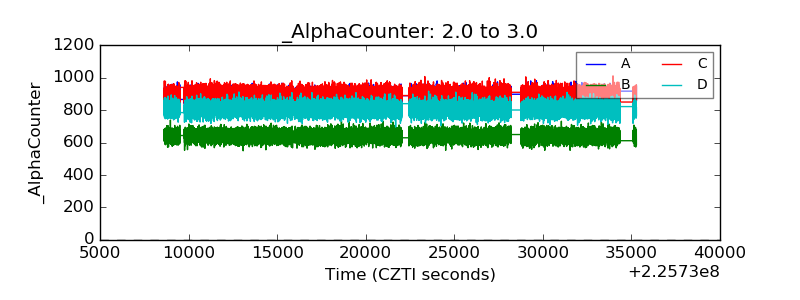 |
| _CPM_Rate | 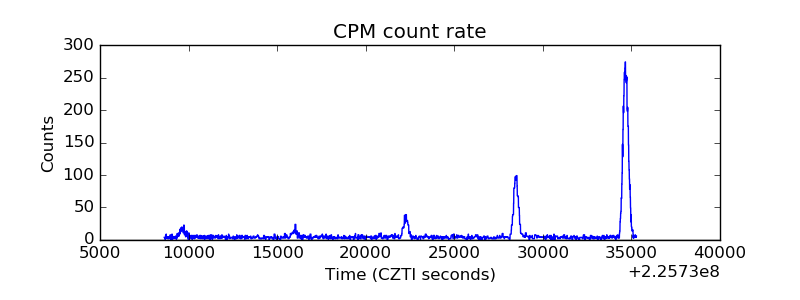 |
| CZT Counter | 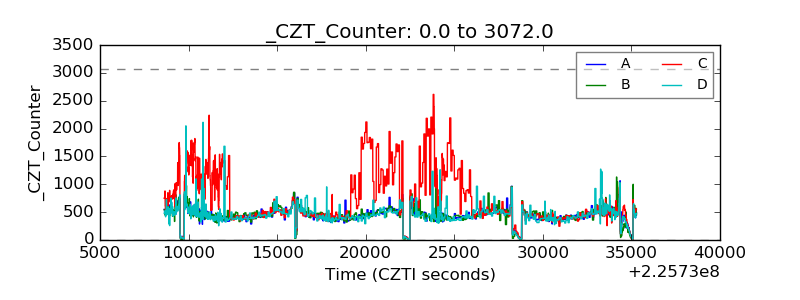 |
| +2.5 Volts monitor | 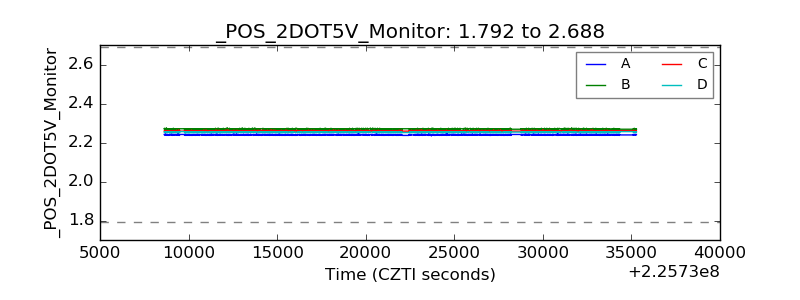 |
| +5 Volts monitor |  |
| _ROLL_ROT | 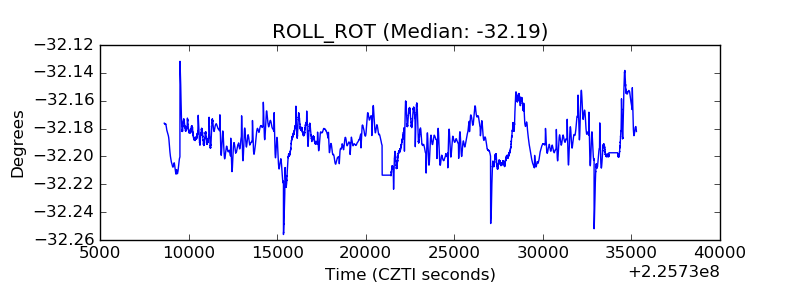 |
| _Roll_DEC | 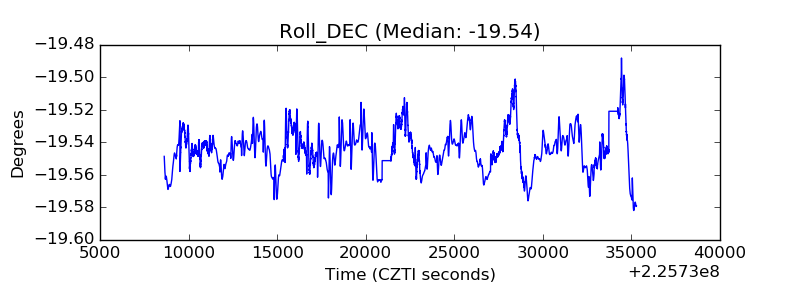 |
| _Roll_RA | 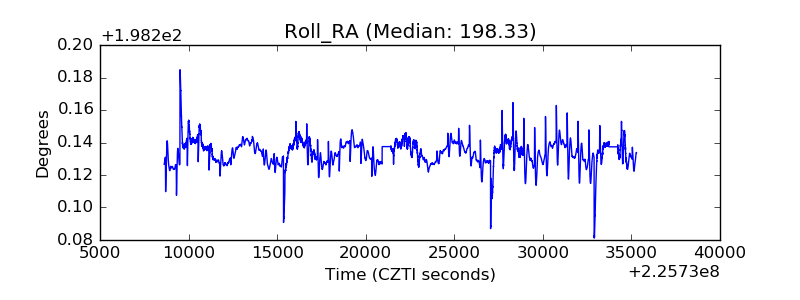 |
| Veto Counter | 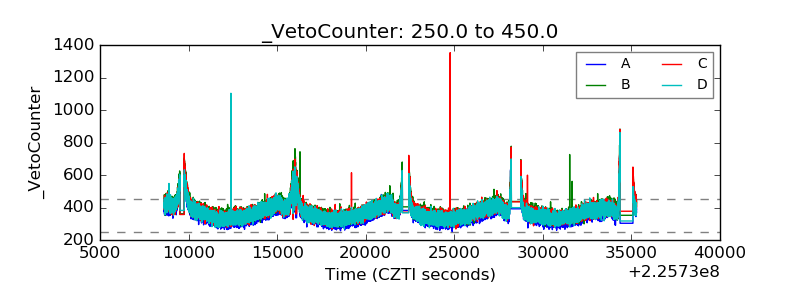 |