| Param | Original file | Final file |
|---|---|---|
| Filename | modeM0/AS1G06_124T01_9000001054_07652cztM0_level2.evt | modeM0/AS1G06_124T01_9000001054_07652cztM0_level2_quad_clean.evt |
| Size (bytes) | 801,694,080 | 150,039,360 |
| Size | 764.6 MB | 143.1 MB |
| Events in quadrant A | 5,570,222 | 930,266 |
| Events in quadrant B | 5,818,751 | 948,276 |
| Events in quadrant C | 6,543,174 | 931,262 |
| Events in quadrant D | 5,527,916 | 898,175 |
| Mode SS | |||
|---|---|---|---|
| Quadrant | BADHDUFLAG | Total packets | Discarded packets |
| A | 0 | 246 | 0 |
| B | 0 | 246 | 0 |
| C | 0 | 246 | 0 |
| D | 0 | 246 | 0 |
| Mode M9 | |||
|---|---|---|---|
| Quadrant | BADHDUFLAG | Total packets | Discarded packets |
| A | 0 | 22 | 0 |
| B | 0 | 22 | 0 |
| C | 0 | 22 | 0 |
| D | 0 | 23 | 0 |
| Mode M0 | |||
|---|---|---|---|
| Quadrant | BADHDUFLAG | Total packets | Discarded packets |
| A | 0 | 24743 | 4 |
| B | 0 | 25226 | 3 |
| C | 0 | 27325 | 3 |
| D | 0 | 25058 | 3 |
| Quadrant | Total seconds | Saturated seconds | Saturation percentage |
|---|---|---|---|
| A | 12091 | 76 | 0.628567% |
| B | 12091 | 124 | 1.025556% |
| C | 12091 | 154 | 1.273675% |
| D | 12091 | 84 | 0.694732% |
Noise dominated data is calculated using 1-second bins in cleaned event files. If a bin has >2000 counts, and if more than 50% of those come from <1% of pixels, then it is considered to be noise-dominated and hence unusable.
| Quadrant | # 1 sec bins | Bins with >0 counts | Bins with >2000 counts | High rate bins dominated by noise | Noise dominated (total time) | Noise dominated (detector-on time) | Marked lightcurve |
|---|---|---|---|---|---|---|---|
| A | 13996 | 12093 | 0 | 0 | 0.00% | 0.00% | 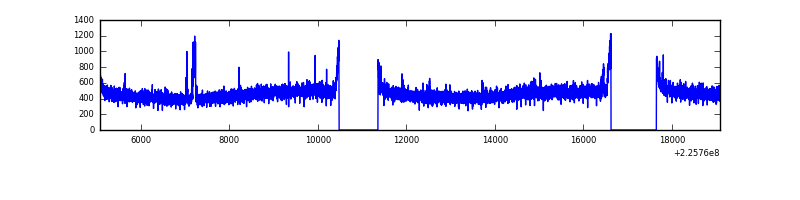 |
| B | 13996 | 12093 | 33 | 33 | 0.24% | 0.27% | 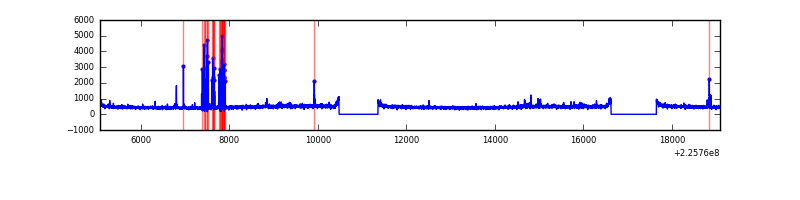 |
| C | 13996 | 12093 | 78 | 78 | 0.56% | 0.65% | 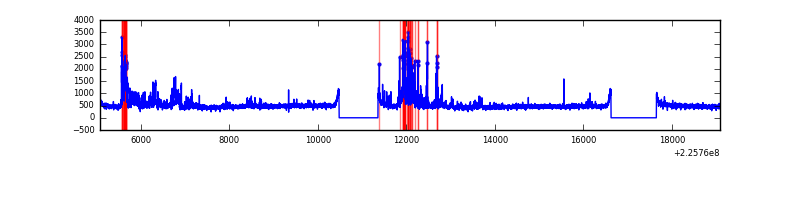 |
| D | 13996 | 12093 | 23 | 23 | 0.16% | 0.19% | 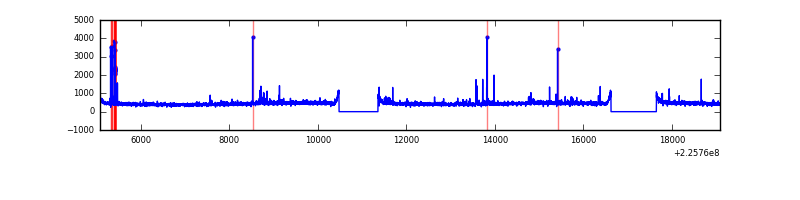 |
Top three noisy pixels from each quadrant. If the there are fewer than three noisy pixels in the level2.evt file, extra rows are filled as -1
| Pixel properties | Quadrant properties | ||||||
|---|---|---|---|---|---|---|---|
| Quadrant | DetID | PixID | Counts | Sigma | Mean | Median | Sigma |
| A | 13 | 248 | 71176 | 239.36 | 1427 | 1393 | 291.5 |
| A | 0 | 226 | 13293 | 40.82 | 1427 | 1393 | 291.5 |
| A | 12 | 194 | 12849 | 39.29 | 1427 | 1393 | 291.5 |
| B | 4 | 81 | 208248 | 749.63 | 1433 | 1397 | 275.9 |
| B | 12 | 111 | 30079 | 103.94 | 1433 | 1397 | 275.9 |
| B | 0 | 214 | 25826 | 88.53 | 1433 | 1397 | 275.9 |
| C | 9 | 68 | 1036668 | 3194.23 | 1396 | 1404 | 324.1 |
| C | 8 | 208 | 45400 | 135.75 | 1396 | 1404 | 324.1 |
| C | 13 | 61 | 10630 | 28.47 | 1396 | 1404 | 324.1 |
| D | 2 | 14 | 81364 | 234.18 | 1397 | 1356 | 341.7 |
| D | 2 | 152 | 49607 | 141.23 | 1397 | 1356 | 341.7 |
| D | 13 | 238 | 31596 | 88.51 | 1397 | 1356 | 341.7 |
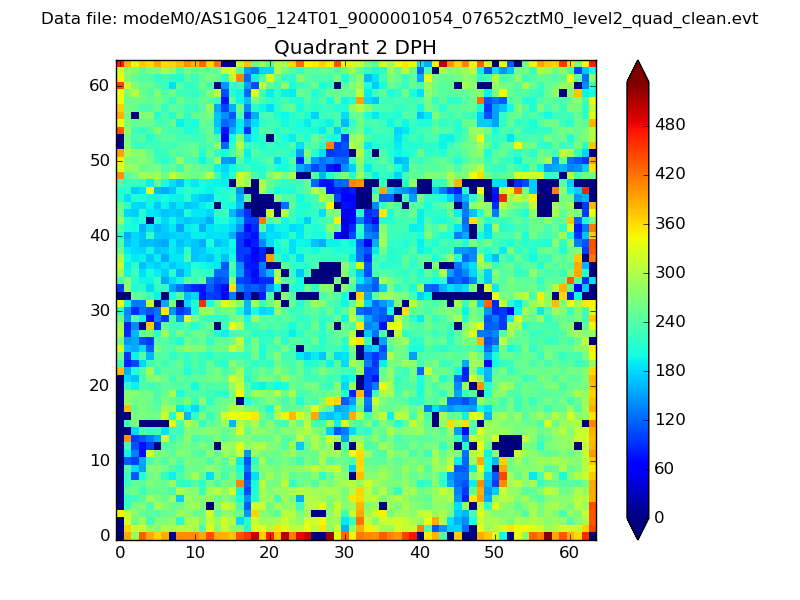
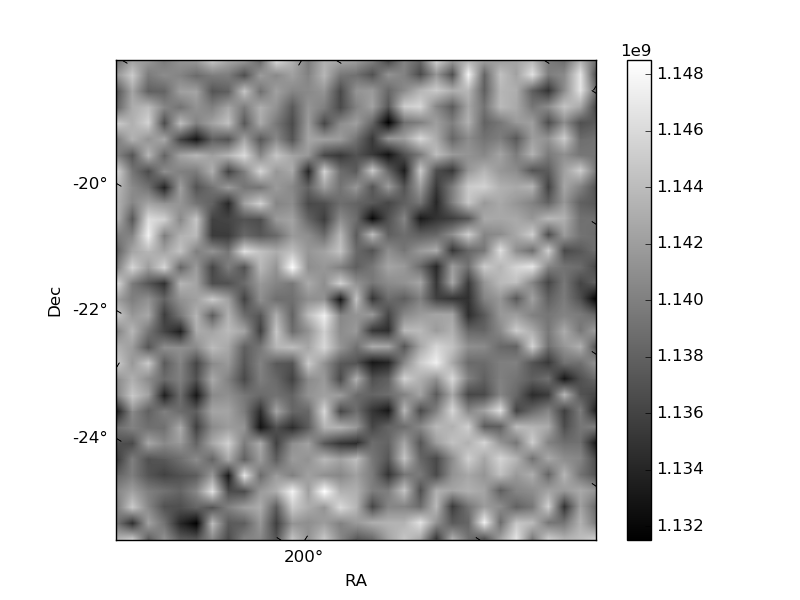
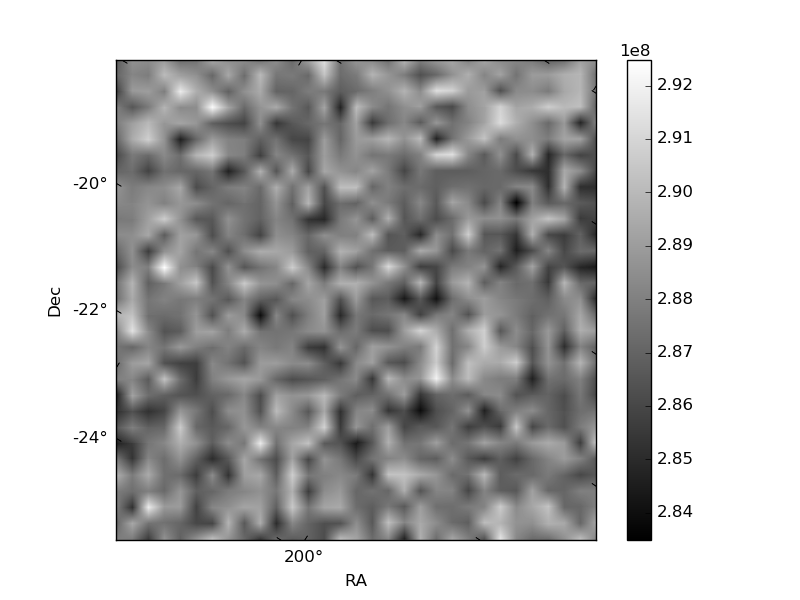
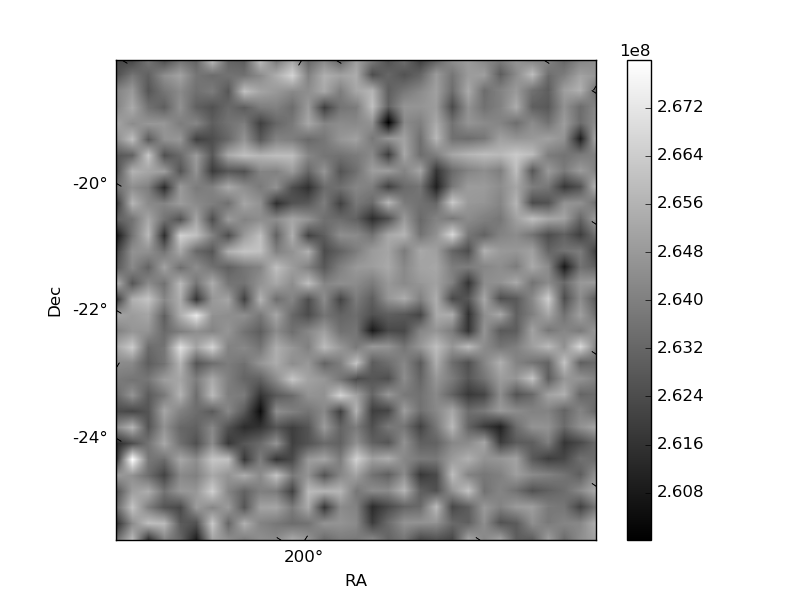
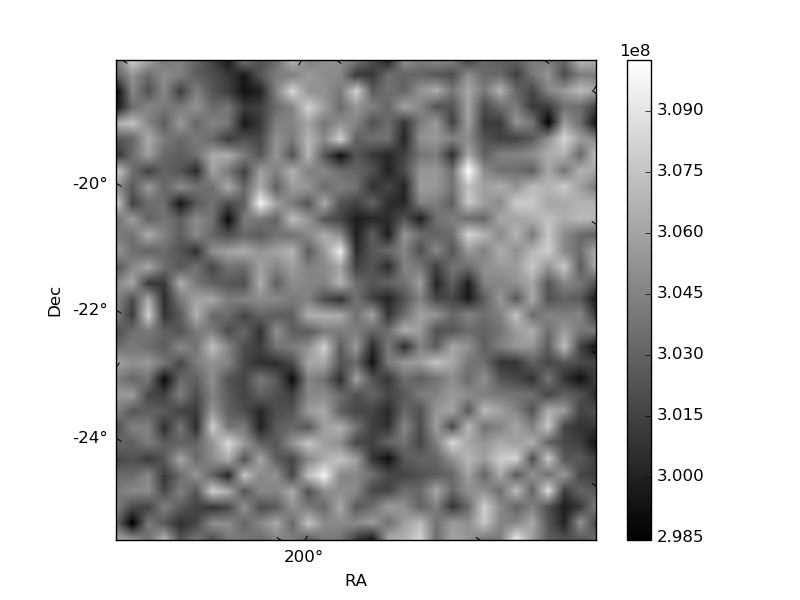
Histogram calculated using DETX and DETY for each event in the final _common_clean file
| Quadrant A | 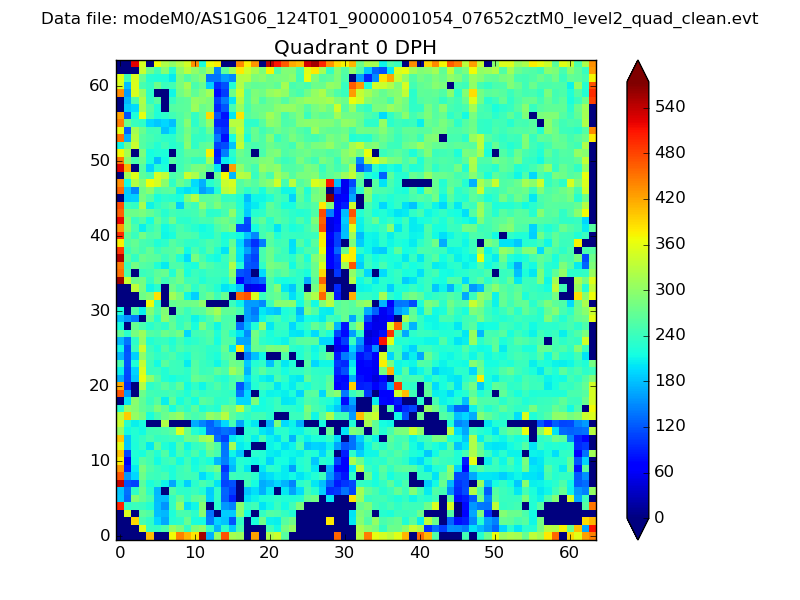 |
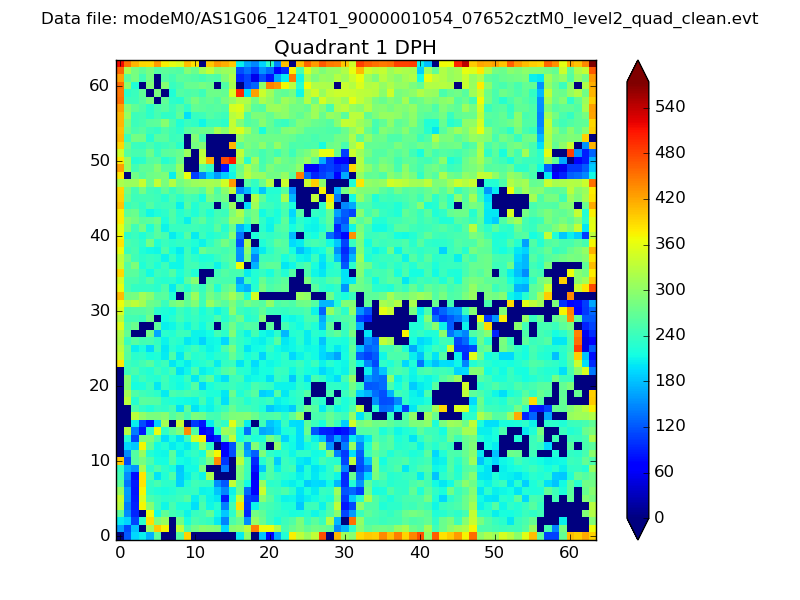 |
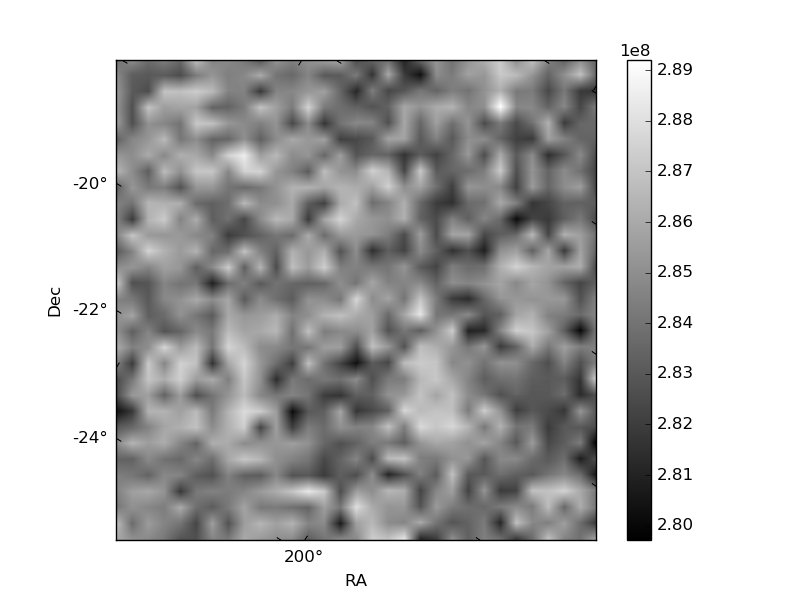
Quadrant B |
|---|---|---|---|
| Quadrant D | 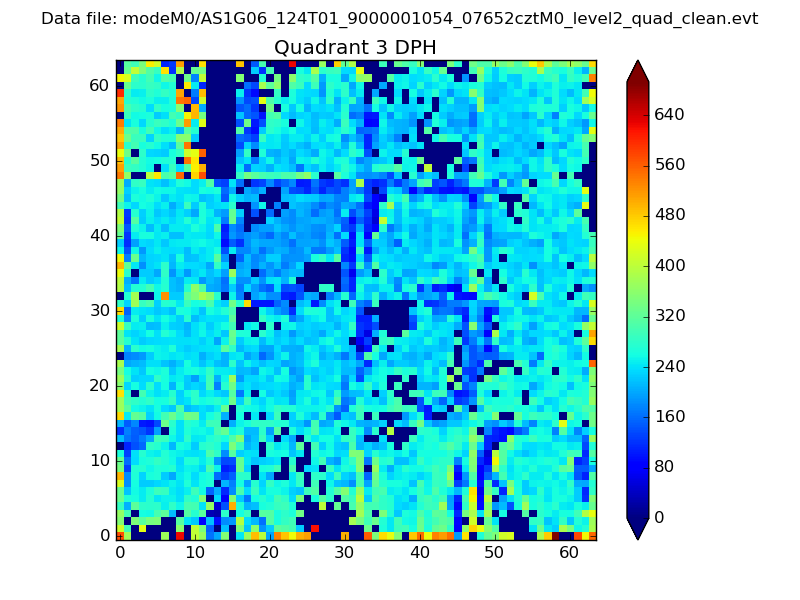 |
 |
Quadrant C |
| Plot type | Count rate plots | Images |
|---|---|---|
| Comparison with Poisson distribution Blue bars denote a histogram of data divided into 1 sec bins. Red curve is a Poisson curve with rate = median count rate of data. |
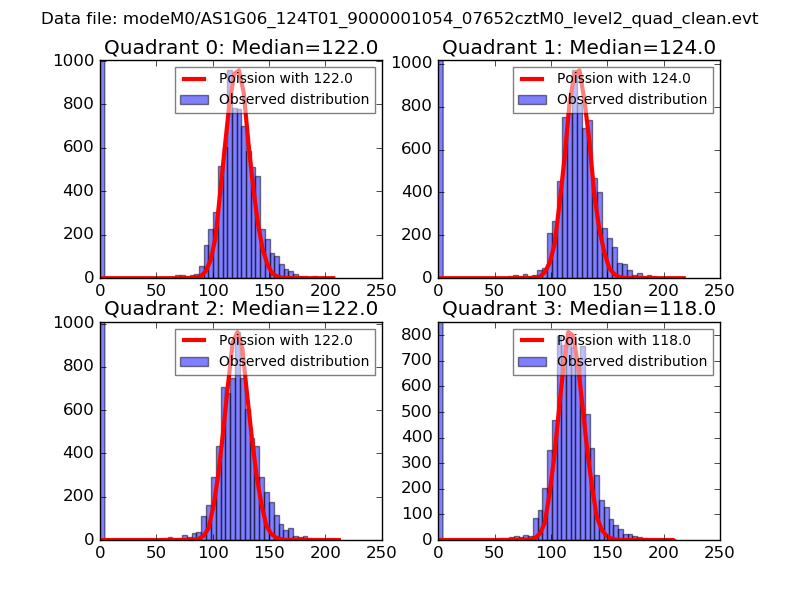 |
 |
| Quadrant-wise count rates Data is divided into 100 sec bins |
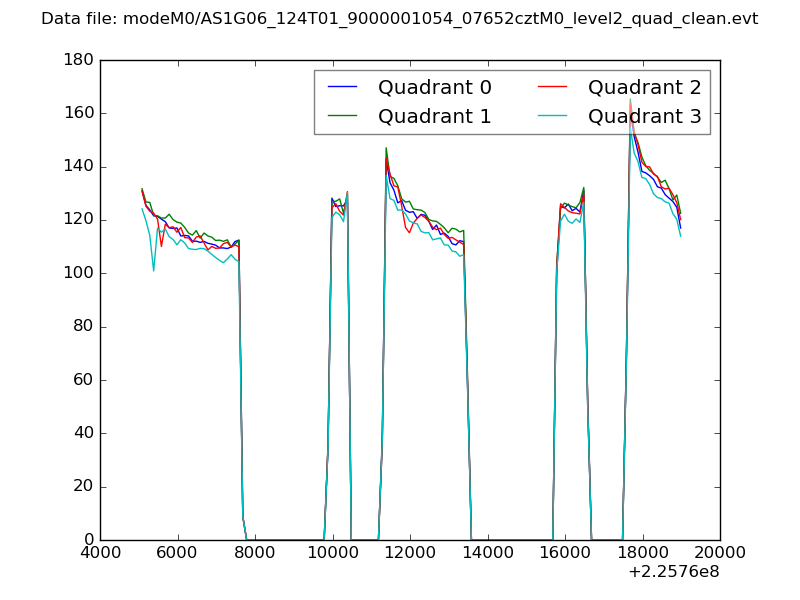 |
|
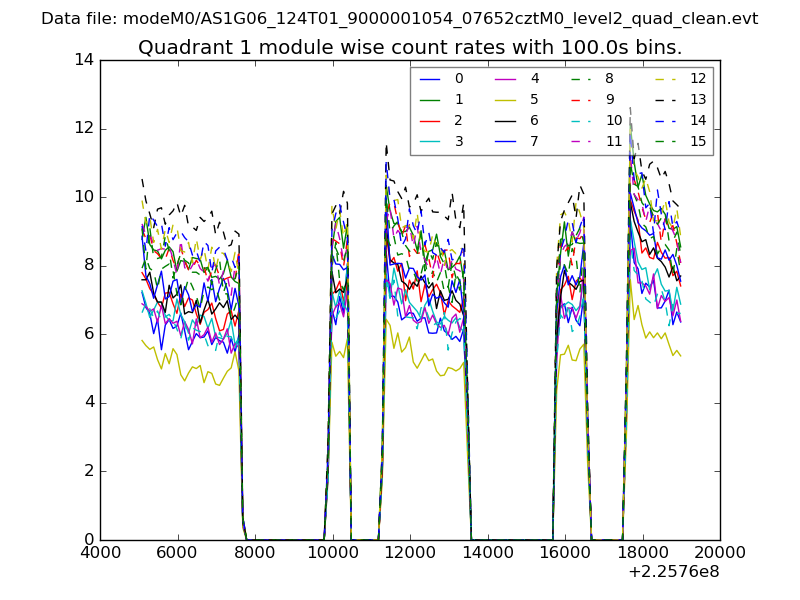
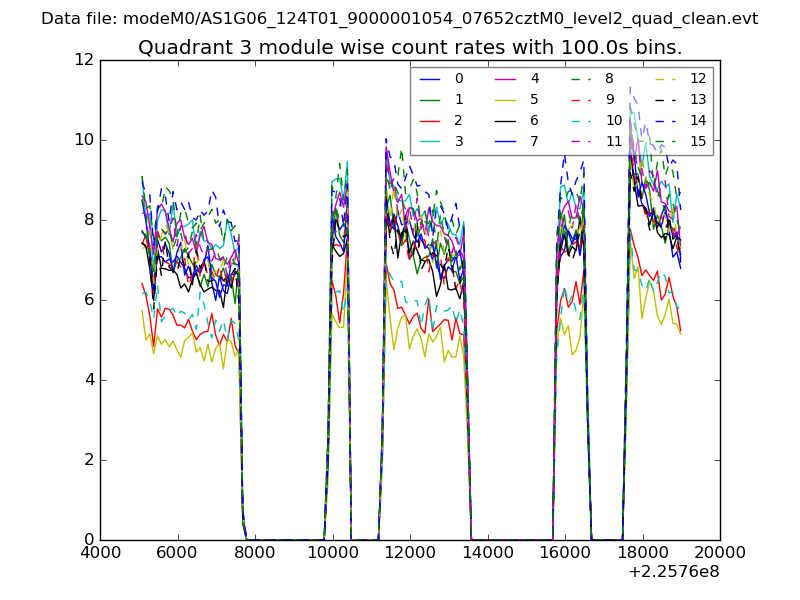
| Module-wise count rates for Quadrant A Data is divided into 100 sec bins |
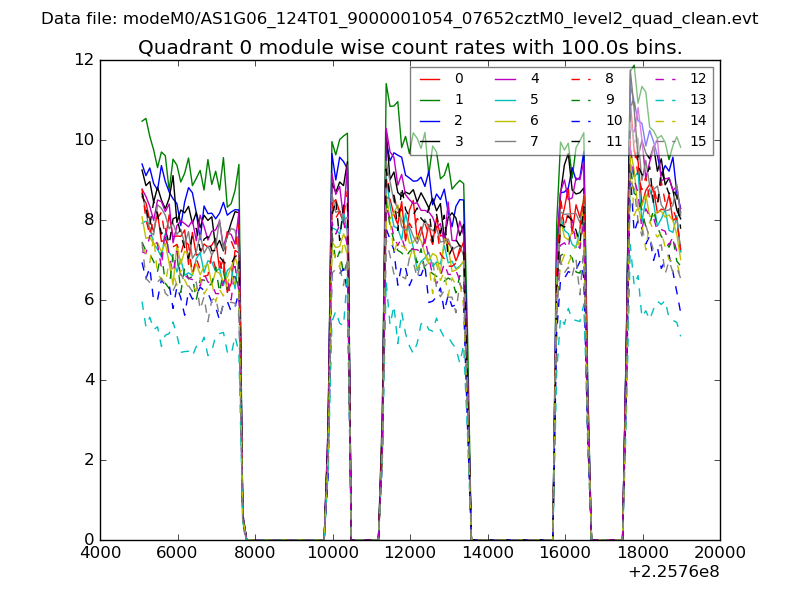 |
 |
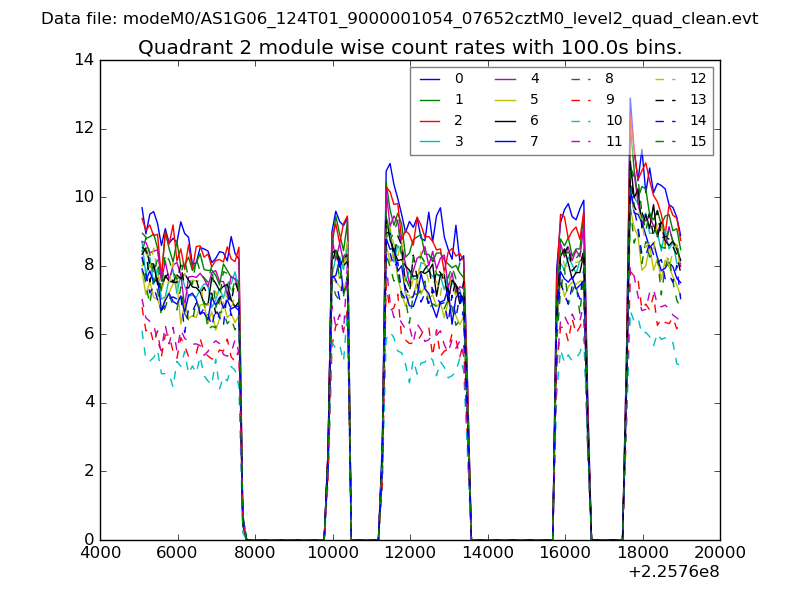
| Module-wise count rates for Quadrant B Data is divided into 100 sec bins |
 |
 |
| Module-wise count rates for Quadrant C Data is divided into 100 sec bins |
 |
 |
| Module-wise count rates for Quadrant D Data is divided into 100 sec bins |
 |
 |
| Parameter | Plot |
|---|---|
| CZT HV Monitor | 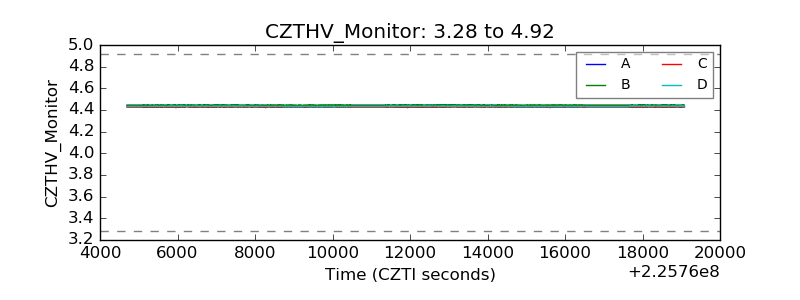 |
| D_VDD | 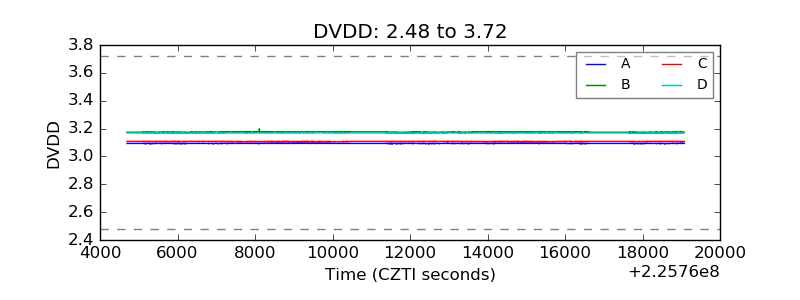 |
| Temperature 1 | 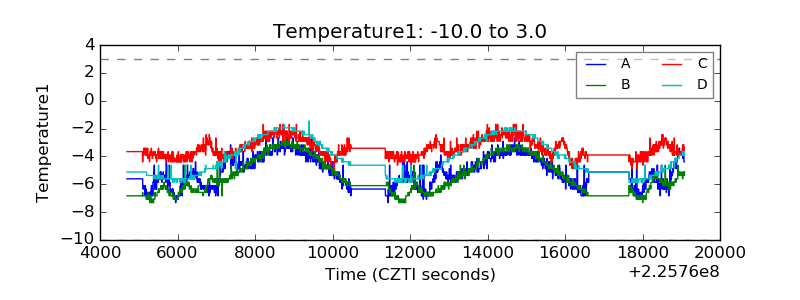 |
| Veto HV Monitor | 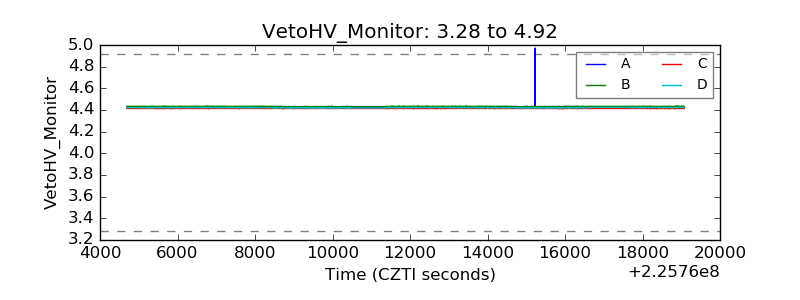 |
| Veto LLD |  |
| Alpha Counter | 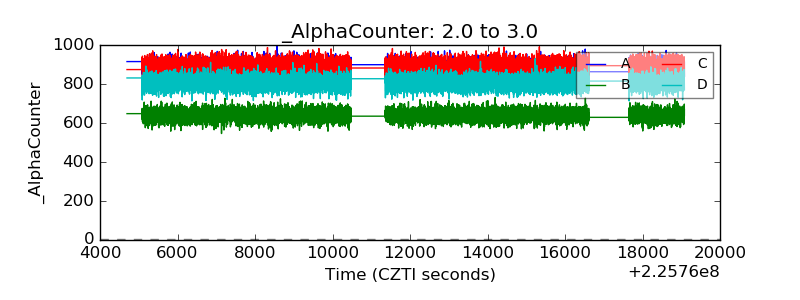 |
| _CPM_Rate | 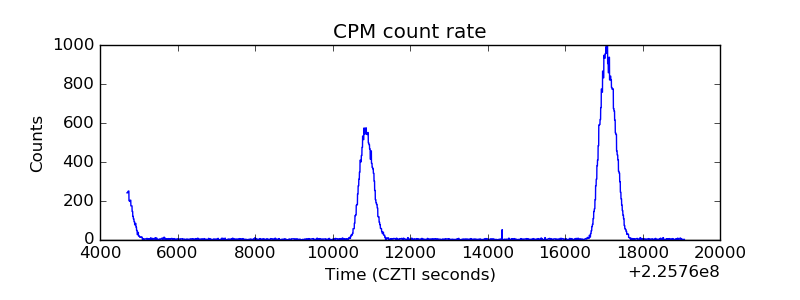 |
| CZT Counter | 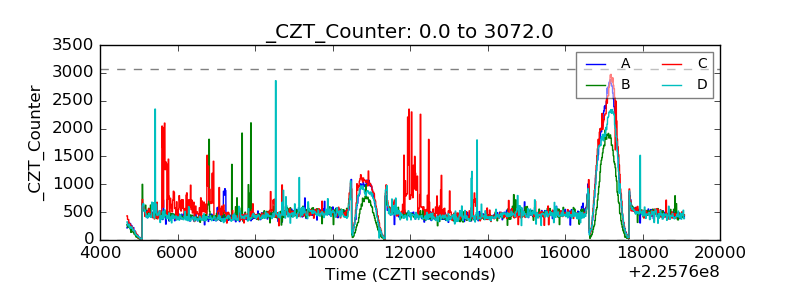 |
| +2.5 Volts monitor |  |
| +5 Volts monitor |  |
| _ROLL_ROT | 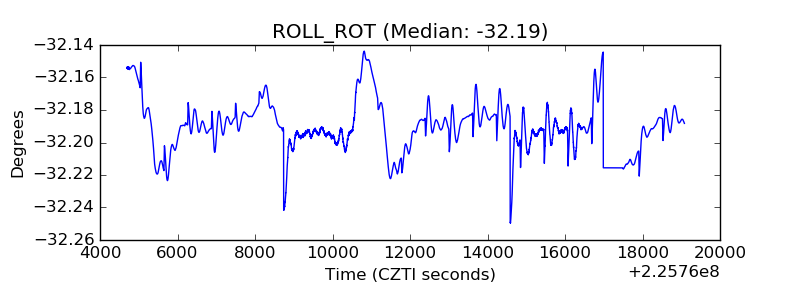 |
| _Roll_DEC | 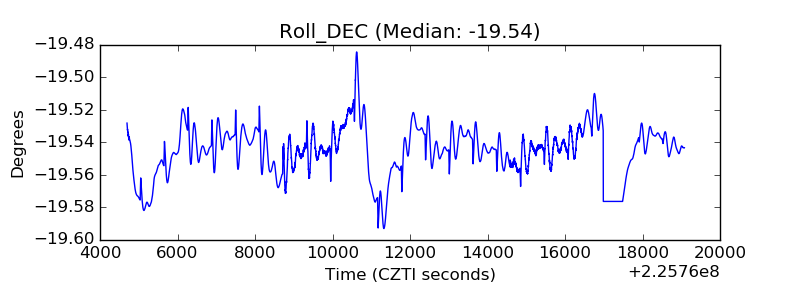 |
| _Roll_RA | 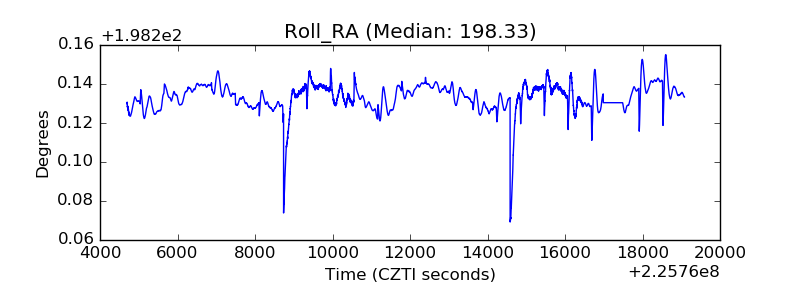 |
| Veto Counter | 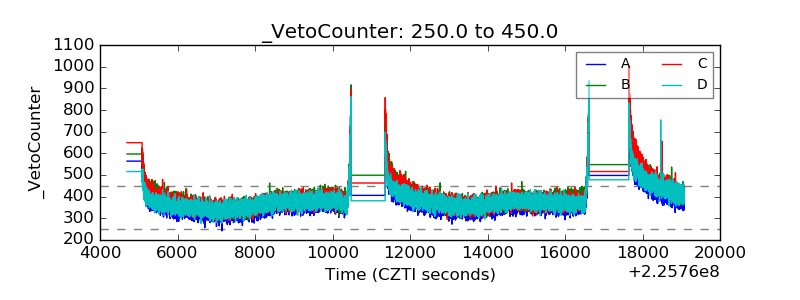 |