| Param | Original file | Final file |
|---|---|---|
| Filename | modeM0/AS1G06_124T01_9000001054_07654cztM0_level2.evt | modeM0/AS1G06_124T01_9000001054_07654cztM0_level2_quad_clean.evt |
| Size (bytes) | 427,184,640 | 90,440,640 |
| Size | 407.4 MB | 86.3 MB |
| Events in quadrant A | 3,093,130 | 573,551 |
| Events in quadrant B | 3,152,498 | 584,226 |
| Events in quadrant C | 3,088,732 | 580,889 |
| Events in quadrant D | 3,166,649 | 552,559 |
| Mode SS | |||
|---|---|---|---|
| Quadrant | BADHDUFLAG | Total packets | Discarded packets |
| A | 0 | 130 | 0 |
| B | 0 | 130 | 0 |
| C | 0 | 130 | 0 |
| D | 0 | 130 | 0 |
| Mode M9 | |||
|---|---|---|---|
| Quadrant | BADHDUFLAG | Total packets | Discarded packets |
| A | 0 | 14 | 0 |
| B | 0 | 14 | 0 |
| C | 0 | 14 | 0 |
| D | 0 | 15 | 0 |
| Mode M0 | |||
|---|---|---|---|
| Quadrant | BADHDUFLAG | Total packets | Discarded packets |
| A | 0 | 13218 | 3 |
| B | 0 | 13290 | 2 |
| C | 0 | 13226 | 2 |
| D | 0 | 13675 | 2 |
| Quadrant | Total seconds | Saturated seconds | Saturation percentage |
|---|---|---|---|
| A | 6417 | 55 | 0.857098% |
| B | 6417 | 49 | 0.763597% |
| C | 6417 | 38 | 0.592177% |
| D | 6417 | 58 | 0.903849% |
Noise dominated data is calculated using 1-second bins in cleaned event files. If a bin has >2000 counts, and if more than 50% of those come from <1% of pixels, then it is considered to be noise-dominated and hence unusable.
| Quadrant | # 1 sec bins | Bins with >0 counts | Bins with >2000 counts | High rate bins dominated by noise | Noise dominated (total time) | Noise dominated (detector-on time) | Marked lightcurve |
|---|---|---|---|---|---|---|---|
| A | 7582 | 6418 | 2 | 2 | 0.03% | 0.03% | 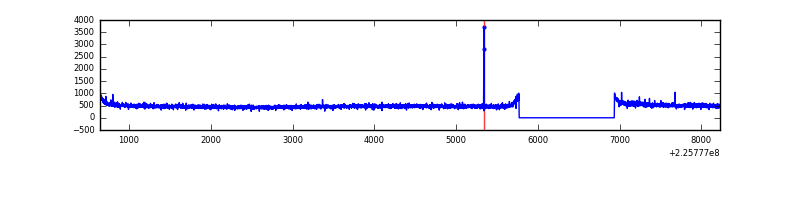 |
| B | 7582 | 6418 | 1 | 1 | 0.01% | 0.02% | 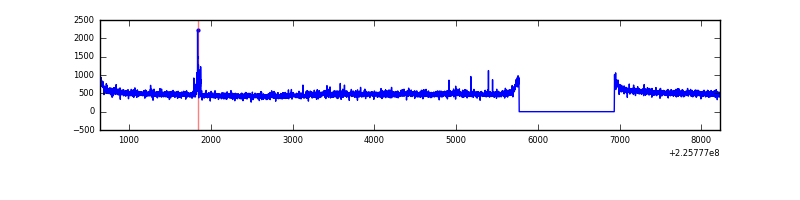 |
| C | 7582 | 6418 | 0 | 0 | 0.00% | 0.00% | 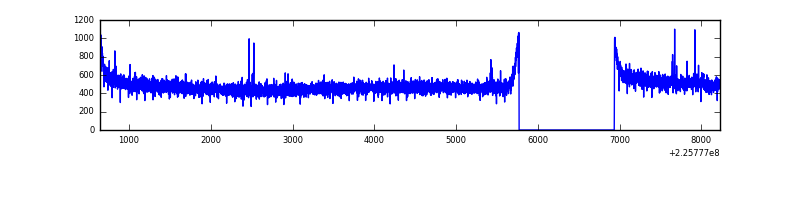 |
| D | 7582 | 6418 | 15 | 15 | 0.20% | 0.23% | 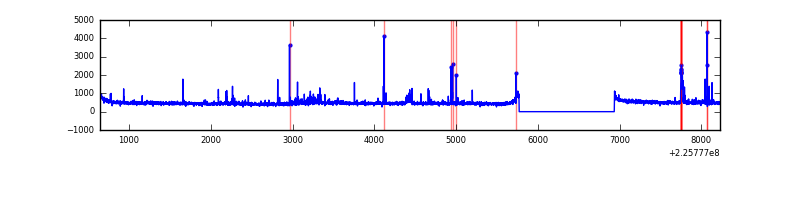 |
Top three noisy pixels from each quadrant. If the there are fewer than three noisy pixels in the level2.evt file, extra rows are filled as -1
| Pixel properties | Quadrant properties | ||||||
|---|---|---|---|---|---|---|---|
| Quadrant | DetID | PixID | Counts | Sigma | Mean | Median | Sigma |
| A | 13 | 248 | 13950 | 80.85 | 800 | 783 | 162.9 |
| A | 0 | 226 | 7469 | 41.05 | 800 | 783 | 162.9 |
| A | 12 | 194 | 7222 | 39.54 | 800 | 783 | 162.9 |
| B | 4 | 81 | 35058 | 225.65 | 799 | 778 | 151.9 |
| B | 12 | 111 | 16086 | 100.76 | 799 | 778 | 151.9 |
| B | 11 | 111 | 12794 | 79.09 | 799 | 778 | 151.9 |
| C | 9 | 68 | 11273 | 57.05 | 787 | 793 | 183.7 |
| C | 10 | 22 | 6672 | 32.0 | 787 | 793 | 183.7 |
| C | 13 | 61 | 5902 | 27.81 | 787 | 793 | 183.7 |
| D | 2 | 152 | 55241 | 288.86 | 783 | 761 | 188.6 |
| D | 2 | 14 | 29478 | 152.26 | 783 | 761 | 188.6 |
| D | 13 | 238 | 29179 | 150.67 | 783 | 761 | 188.6 |
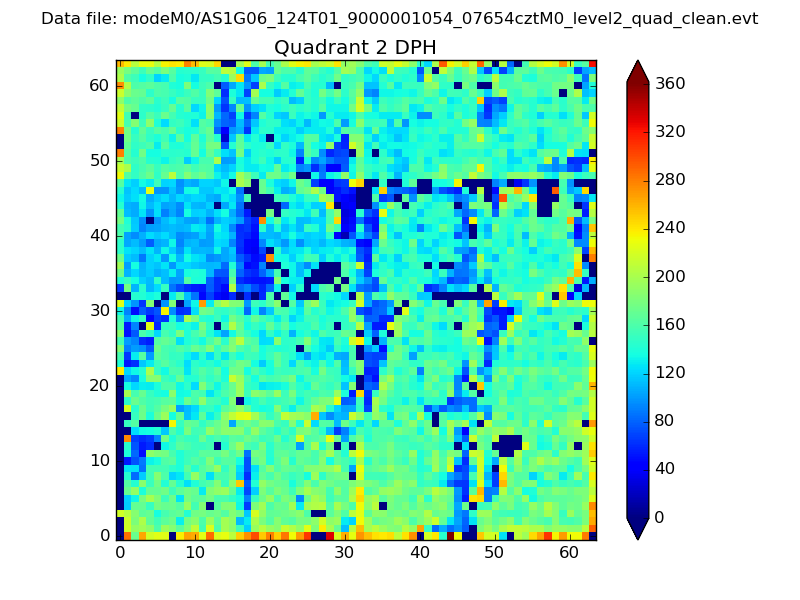
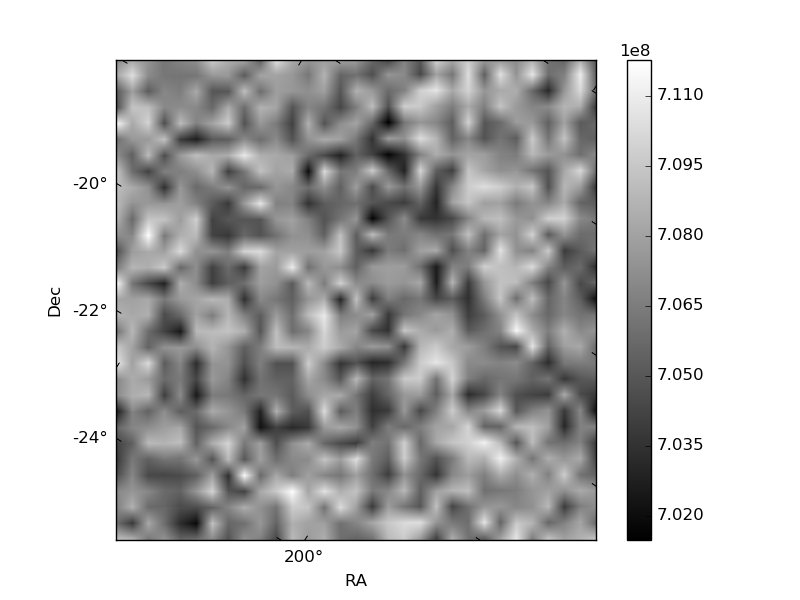
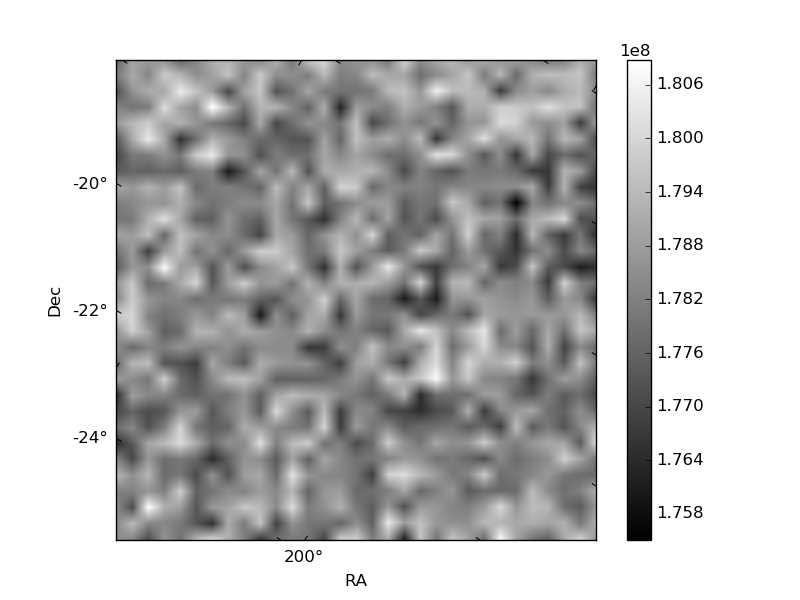
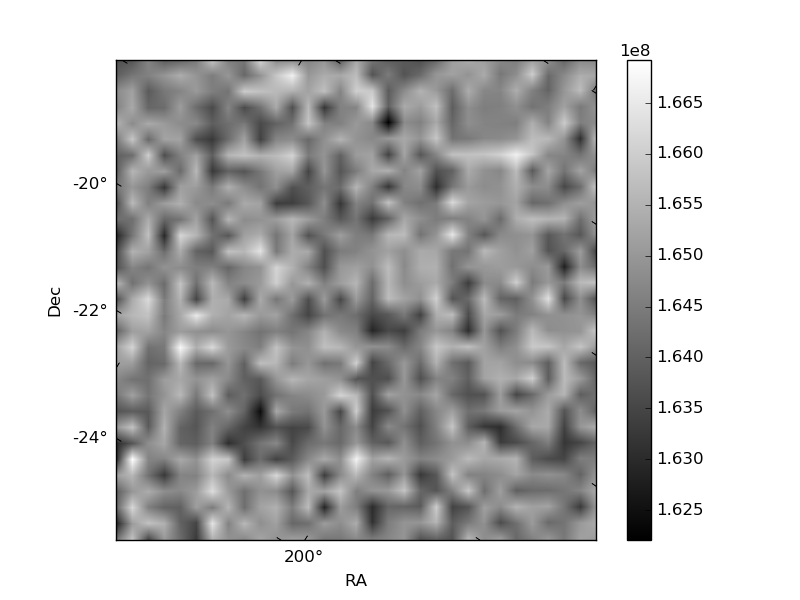
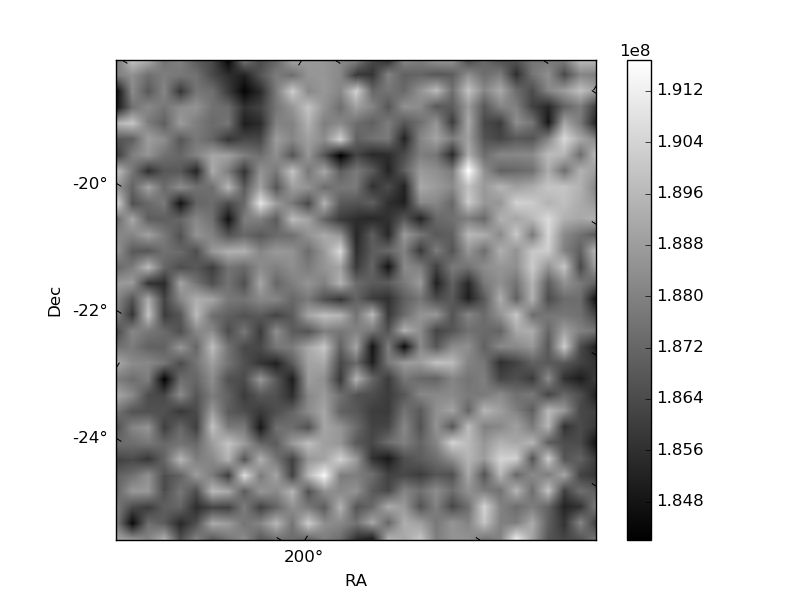
Histogram calculated using DETX and DETY for each event in the final _common_clean file
| Quadrant A | 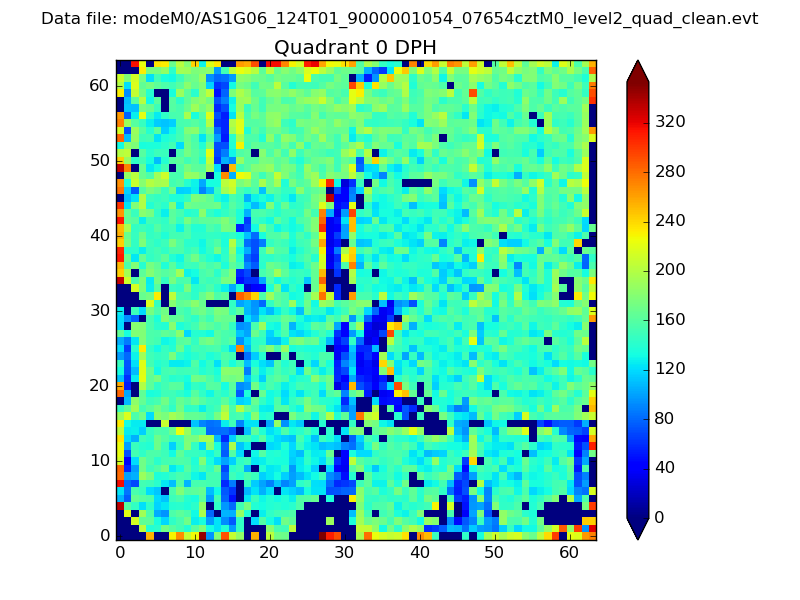 |
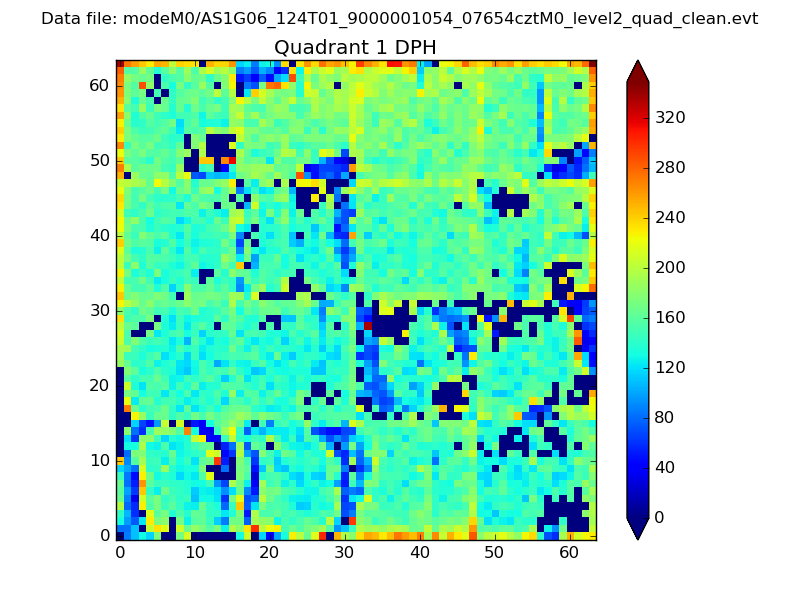 |
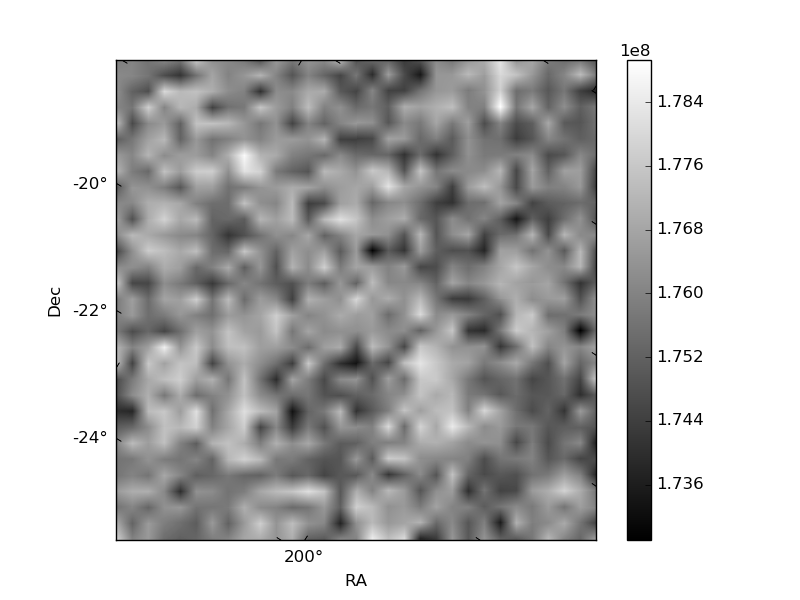
Quadrant B |
|---|---|---|---|
| Quadrant D | 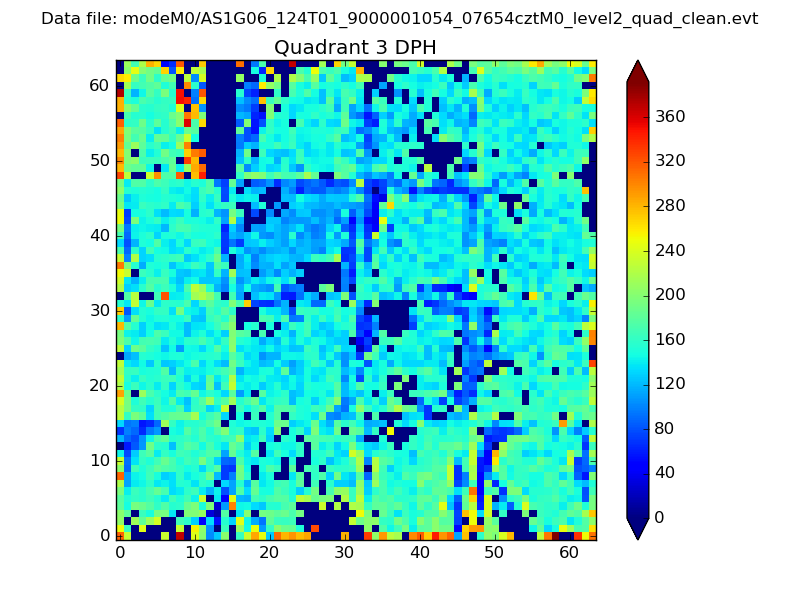 |
 |
Quadrant C |
| Plot type | Count rate plots | Images |
|---|---|---|
| Comparison with Poisson distribution Blue bars denote a histogram of data divided into 1 sec bins. Red curve is a Poisson curve with rate = median count rate of data. |
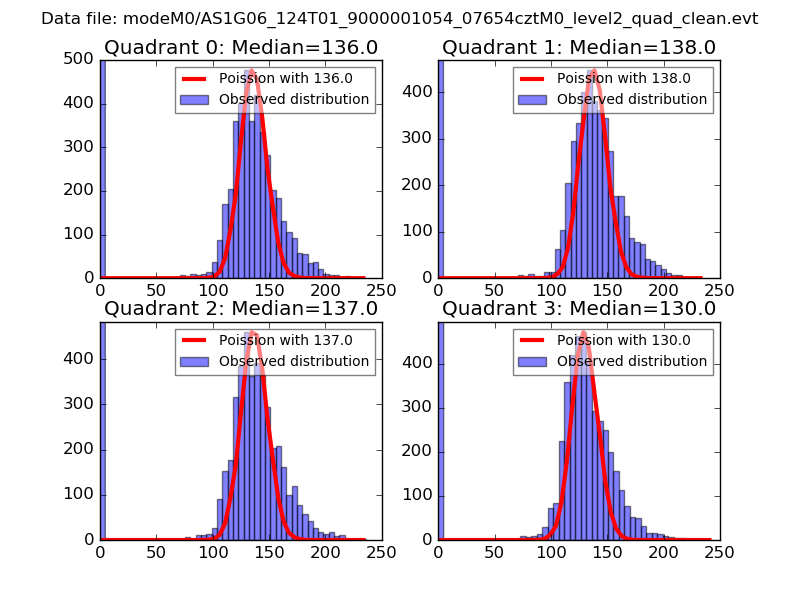 |
 |
| Quadrant-wise count rates Data is divided into 100 sec bins |
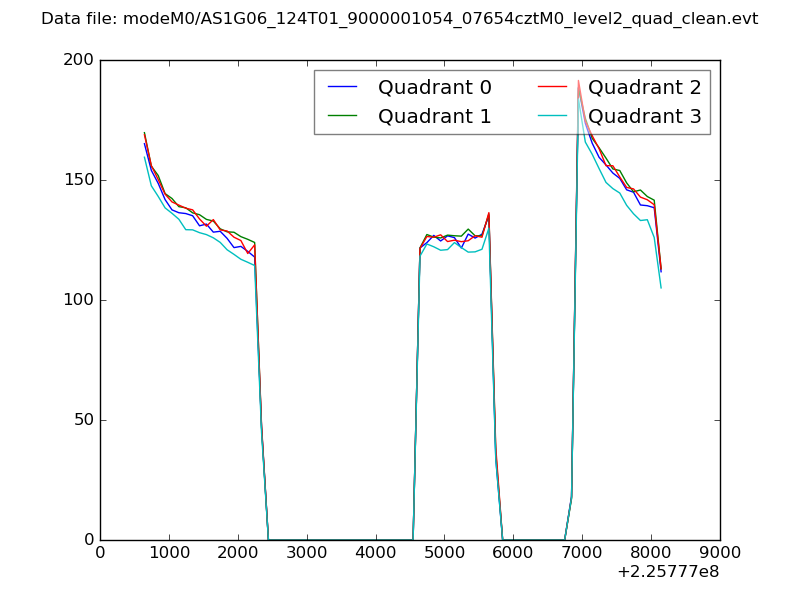 |
|
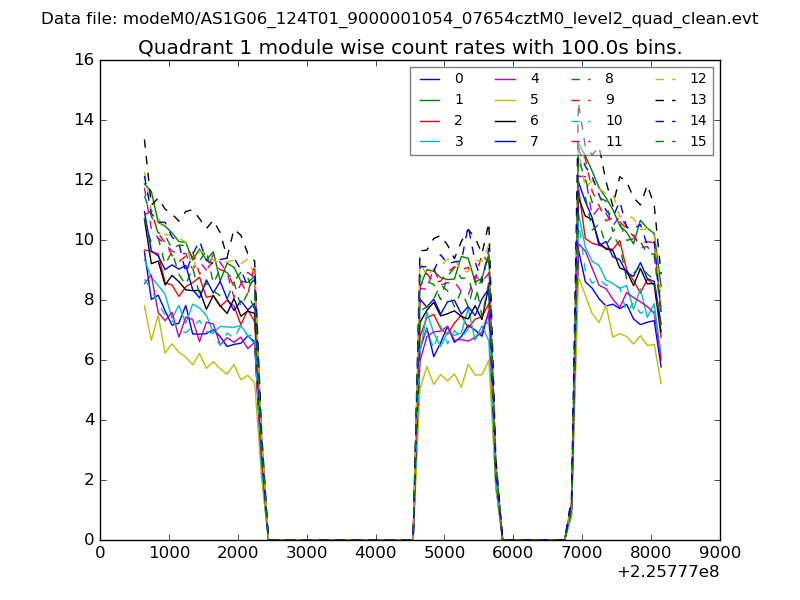
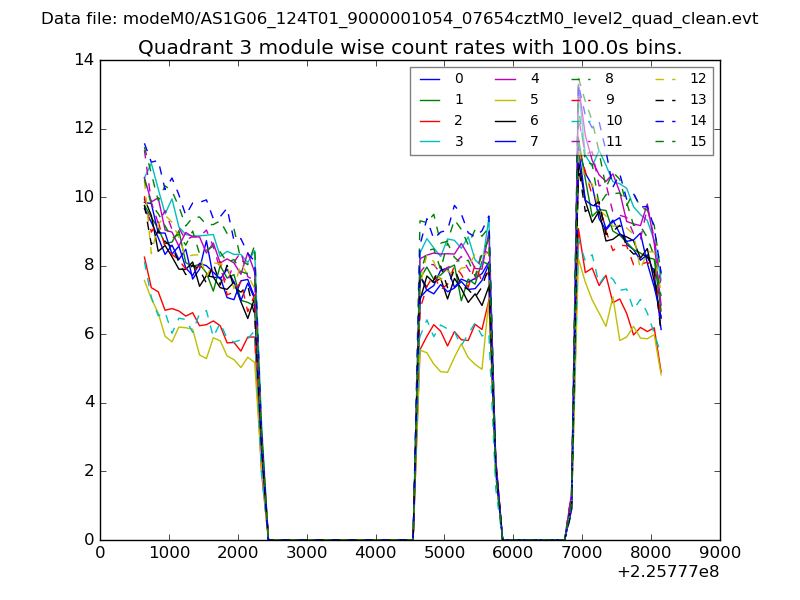
| Module-wise count rates for Quadrant A Data is divided into 100 sec bins |
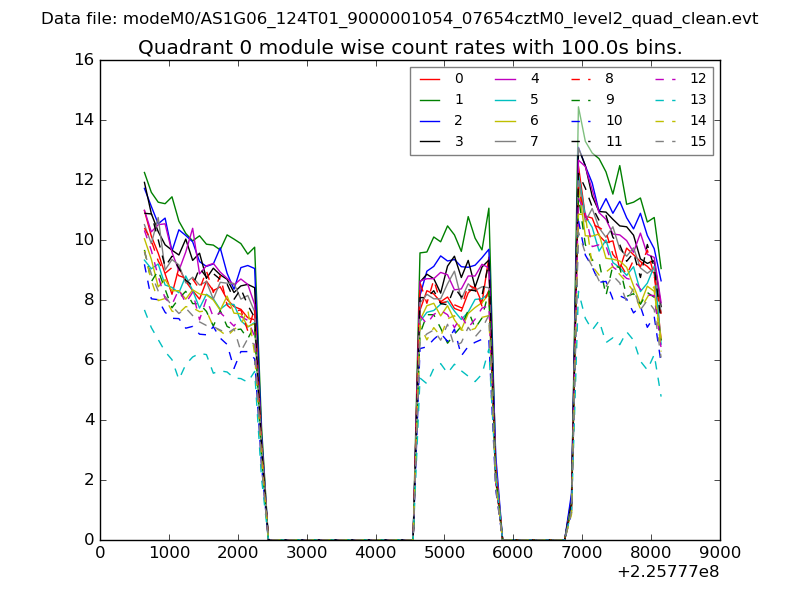 |
 |
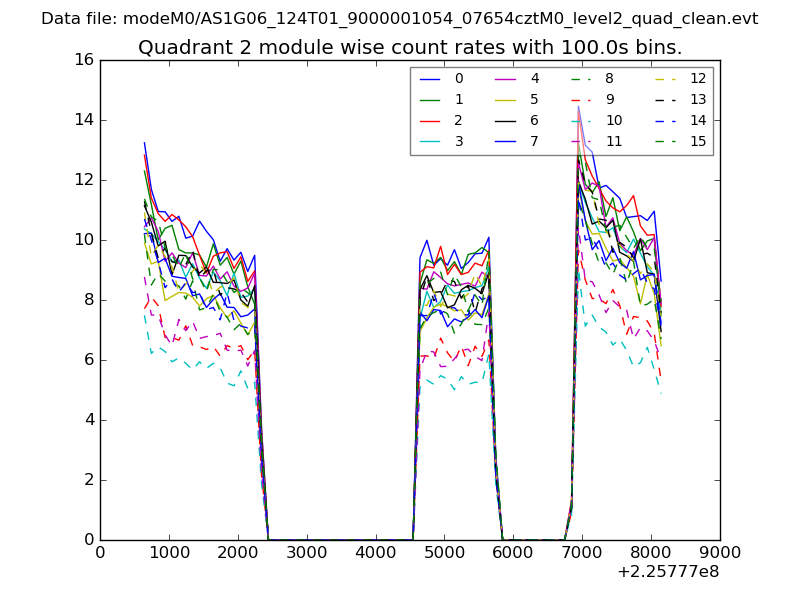
| Module-wise count rates for Quadrant B Data is divided into 100 sec bins |
 |
 |
| Module-wise count rates for Quadrant C Data is divided into 100 sec bins |
 |
 |
| Module-wise count rates for Quadrant D Data is divided into 100 sec bins |
 |
 |
| Parameter | Plot |
|---|---|
| CZT HV Monitor | 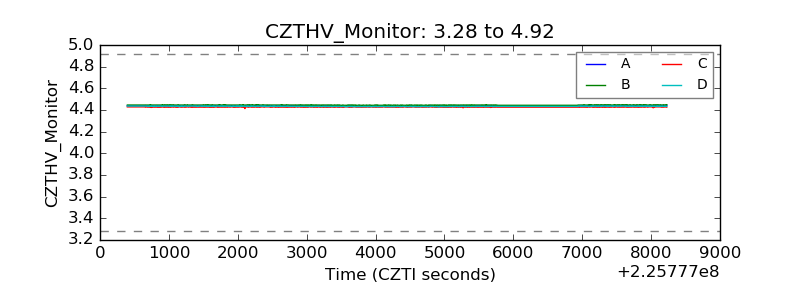 |
| D_VDD | 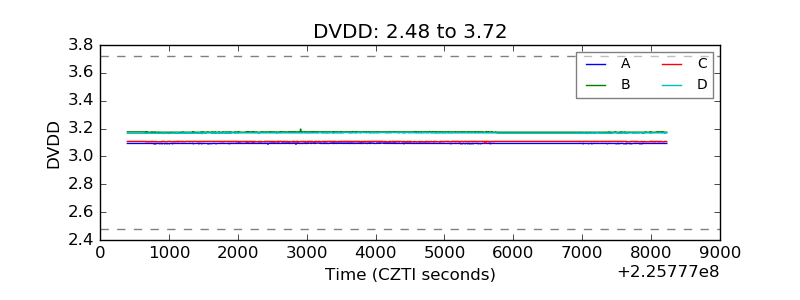 |
| Temperature 1 | 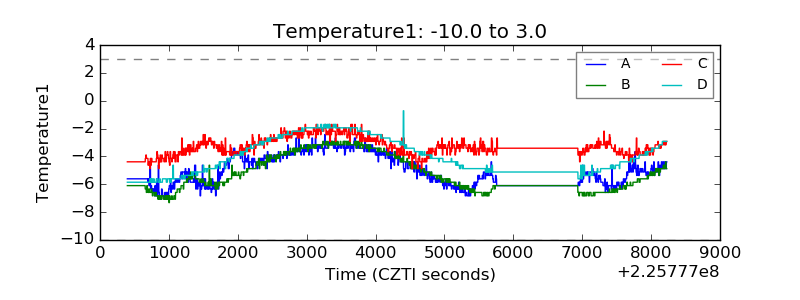 |
| Veto HV Monitor | 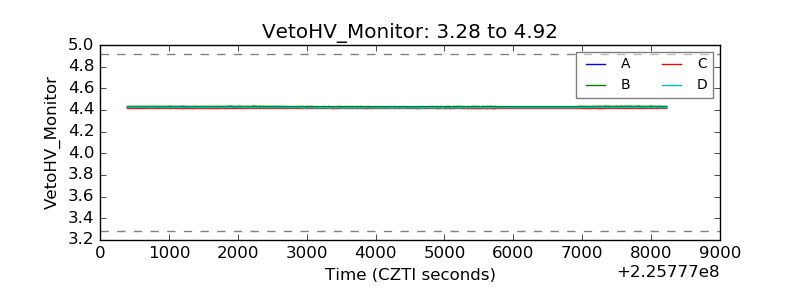 |
| Veto LLD | 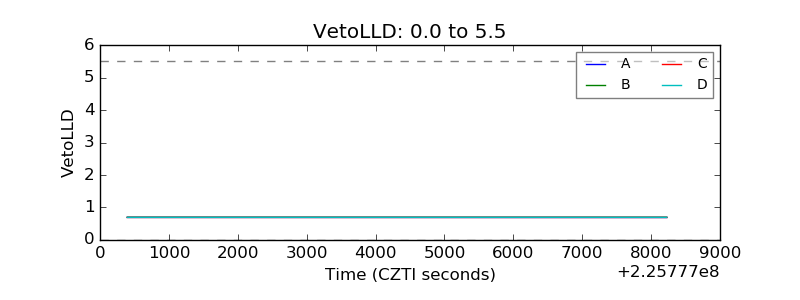 |
| Alpha Counter | 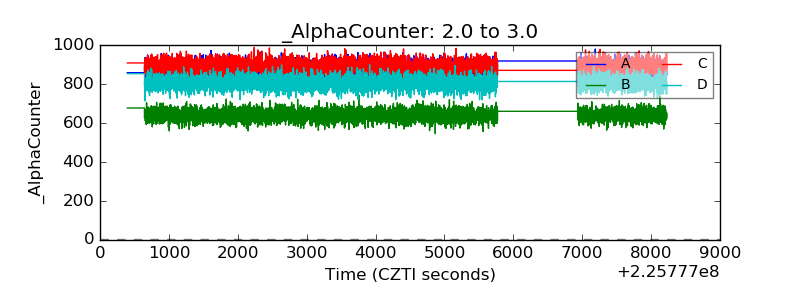 |
| _CPM_Rate | 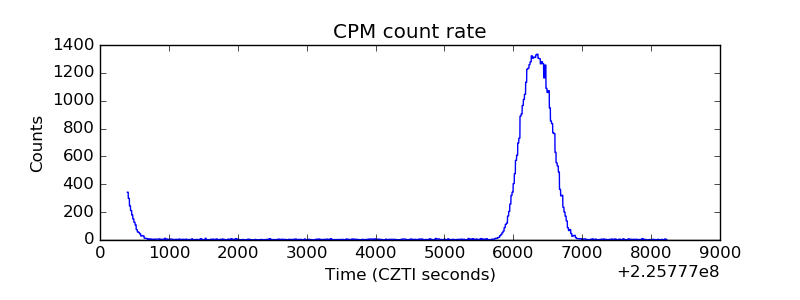 |
| CZT Counter | 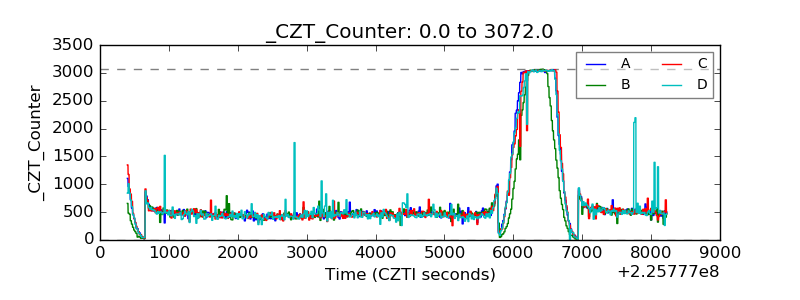 |
| +2.5 Volts monitor |  |
| +5 Volts monitor |  |
| _ROLL_ROT | 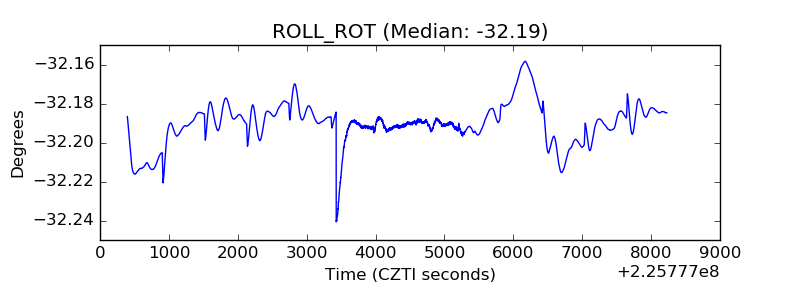 |
| _Roll_DEC | 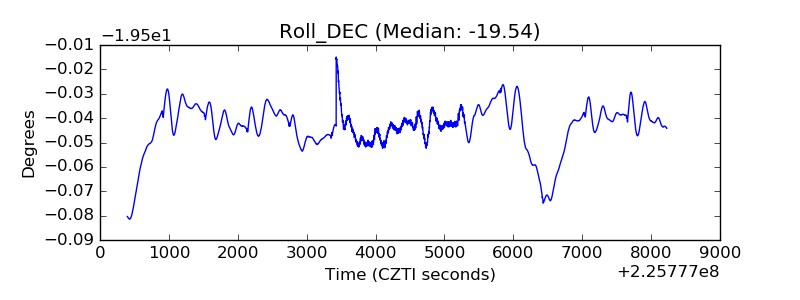 |
| _Roll_RA | 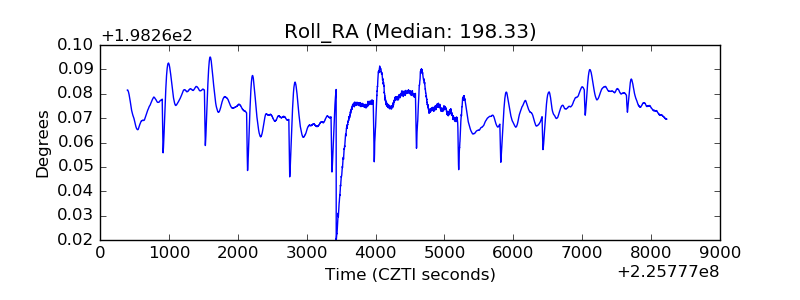 |
| Veto Counter | 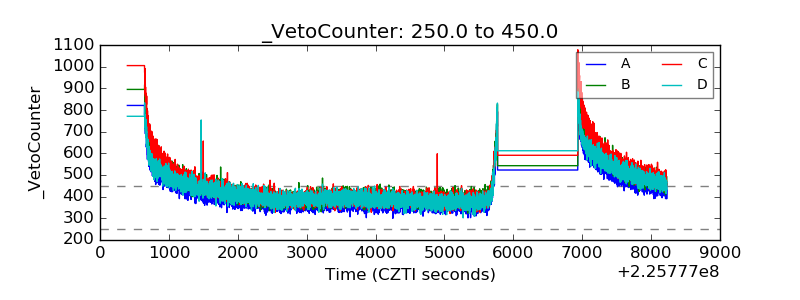 |