| Param | Original file | Final file |
|---|---|---|
| Filename | modeM0/AS1G06_124T01_9000001054_07655cztM0_level2.evt | modeM0/AS1G06_124T01_9000001054_07655cztM0_level2_quad_clean.evt |
| Size (bytes) | 404,951,040 | 74,943,360 |
| Size | 386.2 MB | 71.5 MB |
| Events in quadrant A | 2,902,522 | 467,706 |
| Events in quadrant B | 2,932,229 | 475,390 |
| Events in quadrant C | 2,901,818 | 471,474 |
| Events in quadrant D | 3,130,854 | 447,190 |
| Mode SS | |||
|---|---|---|---|
| Quadrant | BADHDUFLAG | Total packets | Discarded packets |
| A | 0 | 120 | 0 |
| B | 0 | 120 | 0 |
| C | 0 | 120 | 0 |
| D | 0 | 120 | 0 |
| Mode M9 | |||
|---|---|---|---|
| Quadrant | BADHDUFLAG | Total packets | Discarded packets |
| A | 0 | 12 | 0 |
| B | 0 | 12 | 0 |
| C | 0 | 12 | 0 |
| D | 0 | 12 | 0 |
| Mode M0 | |||
|---|---|---|---|
| Quadrant | BADHDUFLAG | Total packets | Discarded packets |
| A | 0 | 12131 | 2 |
| B | 0 | 12190 | 1 |
| C | 0 | 12167 | 1 |
| D | 0 | 13013 | 1 |
| Quadrant | Total seconds | Saturated seconds | Saturation percentage |
|---|---|---|---|
| A | 5824 | 75 | 1.287775% |
| B | 5824 | 71 | 1.219093% |
| C | 5824 | 60 | 1.030220% |
| D | 5824 | 88 | 1.510989% |
Noise dominated data is calculated using 1-second bins in cleaned event files. If a bin has >2000 counts, and if more than 50% of those come from <1% of pixels, then it is considered to be noise-dominated and hence unusable.
| Quadrant | # 1 sec bins | Bins with >0 counts | Bins with >2000 counts | High rate bins dominated by noise | Noise dominated (total time) | Noise dominated (detector-on time) | Marked lightcurve |
|---|---|---|---|---|---|---|---|
| A | 7054 | 5825 | 0 | 0 | 0.00% | 0.00% | 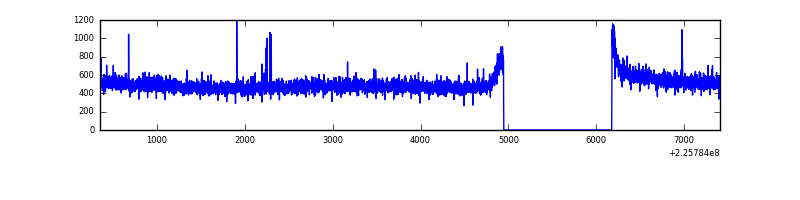 |
| B | 7054 | 5825 | 2 | 2 | 0.03% | 0.03% | 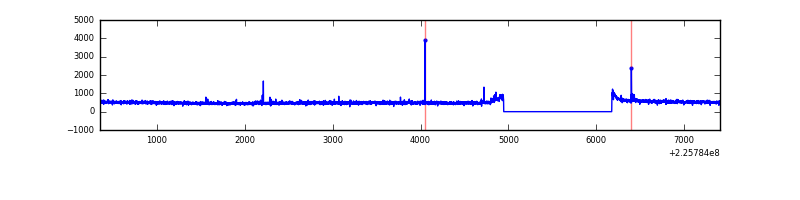 |
| C | 7054 | 5825 | 0 | 0 | 0.00% | 0.00% | 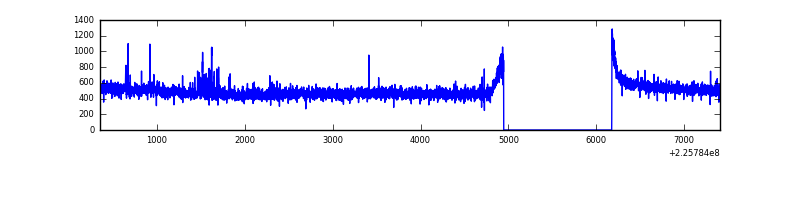 |
| D | 7054 | 5824 | 27 | 27 | 0.38% | 0.46% | 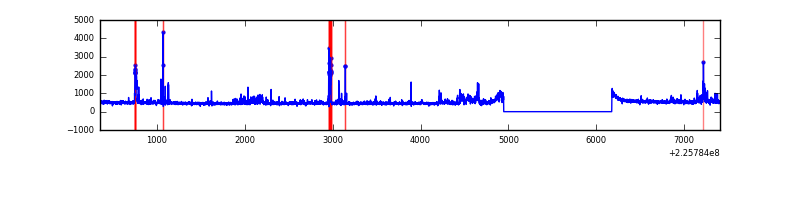 |
Top three noisy pixels from each quadrant. If the there are fewer than three noisy pixels in the level2.evt file, extra rows are filled as -1
| Pixel properties | Quadrant properties | ||||||
|---|---|---|---|---|---|---|---|
| Quadrant | DetID | PixID | Counts | Sigma | Mean | Median | Sigma |
| A | 2 | 79 | 7585 | 44.95 | 751 | 736 | 152.4 |
| A | 0 | 226 | 7085 | 41.67 | 751 | 736 | 152.4 |
| A | 12 | 194 | 6934 | 40.68 | 751 | 736 | 152.4 |
| B | 4 | 81 | 16286 | 110.45 | 747 | 731 | 140.8 |
| B | 12 | 111 | 14821 | 100.05 | 747 | 731 | 140.8 |
| B | 11 | 111 | 11843 | 78.9 | 747 | 731 | 140.8 |
| C | 8 | 208 | 24228 | 138.05 | 734 | 738 | 170.2 |
| C | 9 | 68 | 11592 | 63.79 | 734 | 738 | 170.2 |
| C | 13 | 61 | 5581 | 28.46 | 734 | 738 | 170.2 |
| D | 5 | 239 | 90731 | 501.15 | 735 | 713 | 179.6 |
| D | 14 | 34 | 66499 | 366.24 | 735 | 713 | 179.6 |
| D | 2 | 152 | 65853 | 362.65 | 735 | 713 | 179.6 |
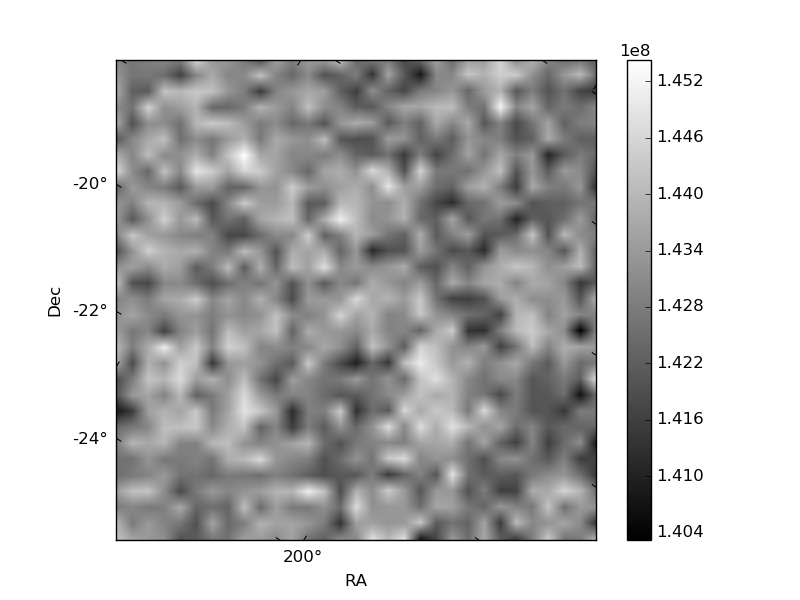
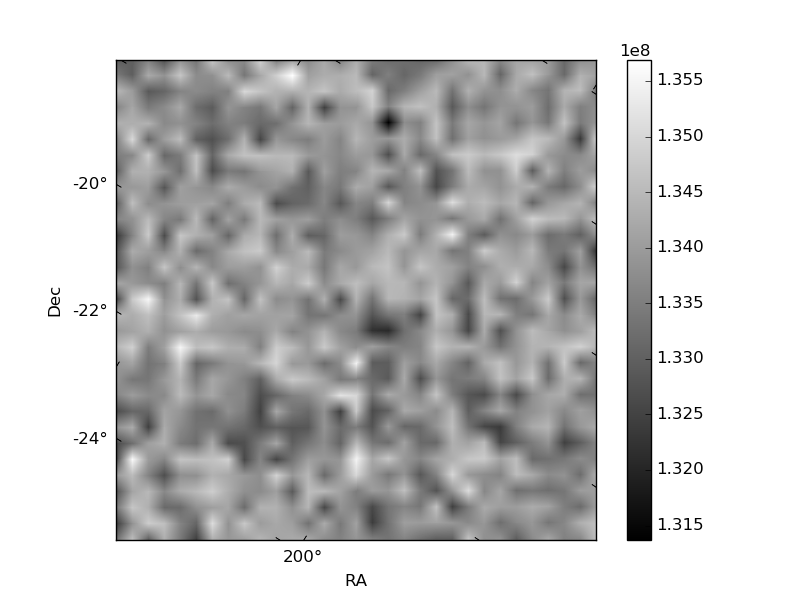
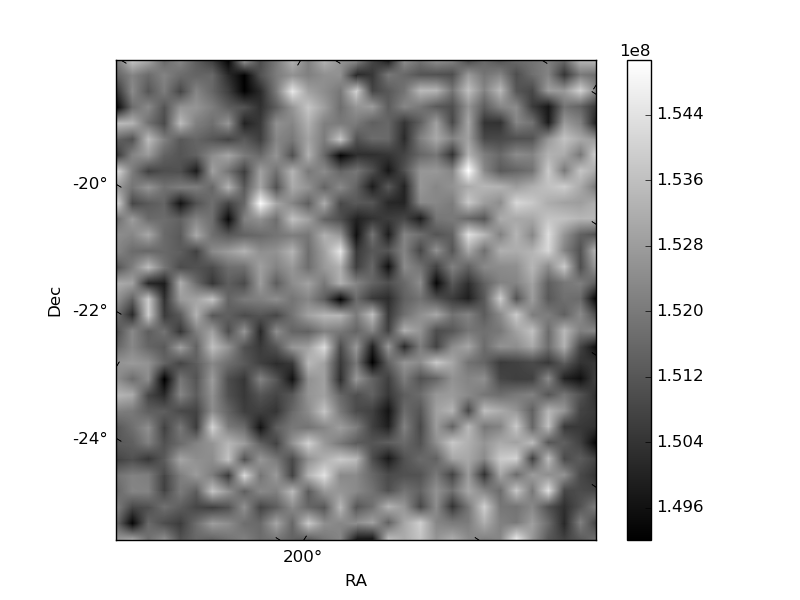
Histogram calculated using DETX and DETY for each event in the final _common_clean file
| Quadrant A | 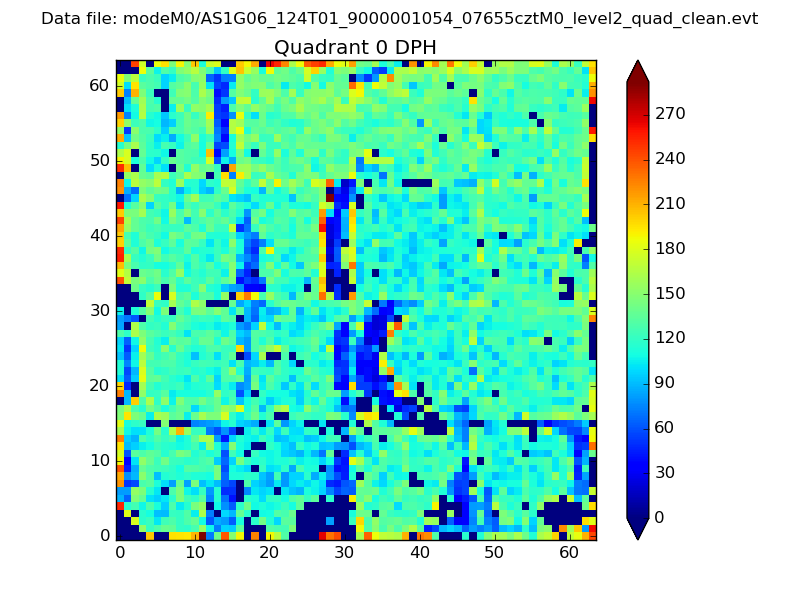 |
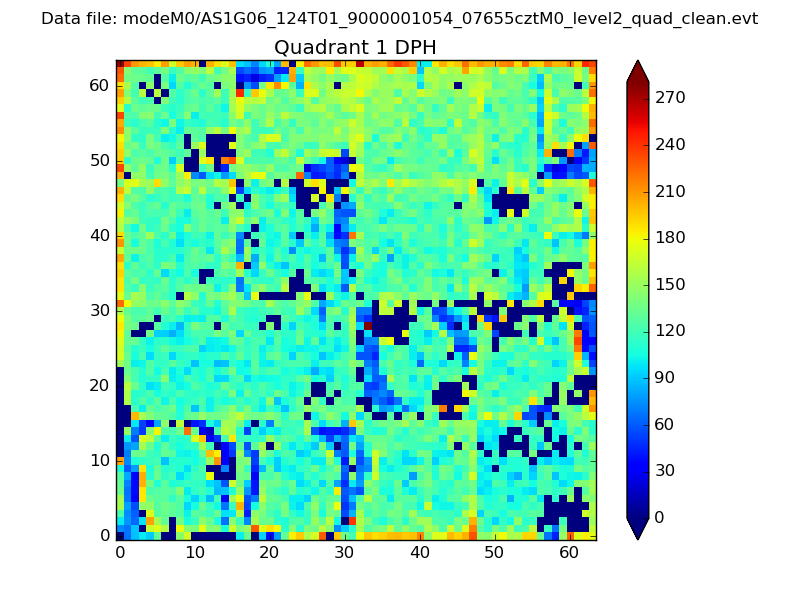 |
Quadrant B |
|---|---|---|---|
| Quadrant D |  |
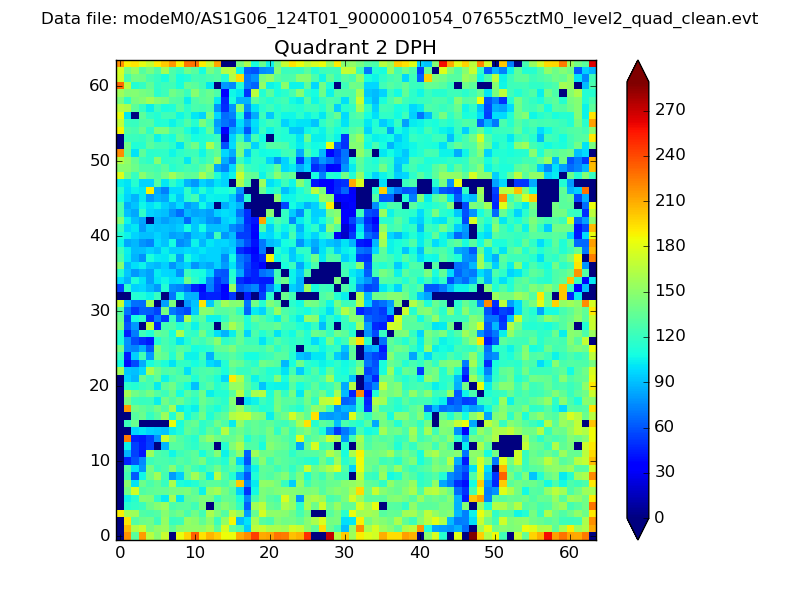 |
Quadrant C |
| Plot type | Count rate plots | Images |
|---|---|---|
| Comparison with Poisson distribution Blue bars denote a histogram of data divided into 1 sec bins. Red curve is a Poisson curve with rate = median count rate of data. |
 |
 |
| Quadrant-wise count rates Data is divided into 100 sec bins |
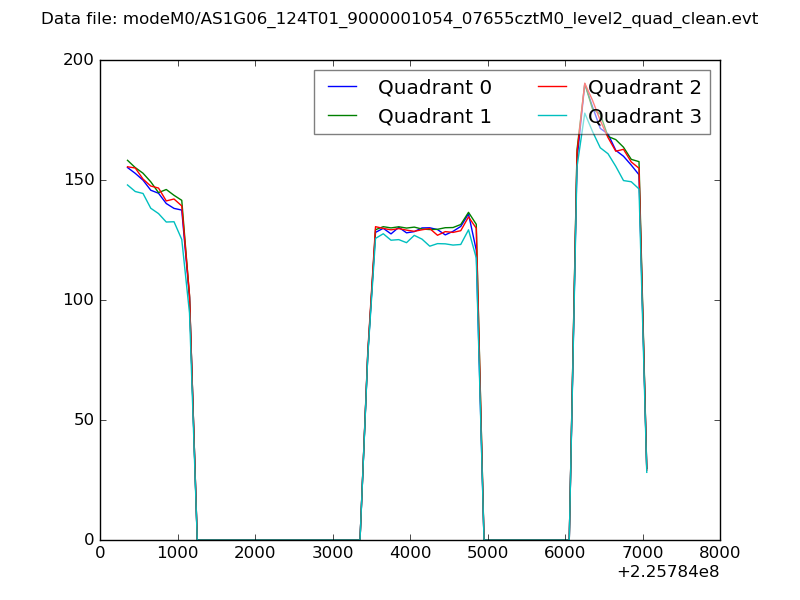 |
|
| Module-wise count rates for Quadrant A Data is divided into 100 sec bins |
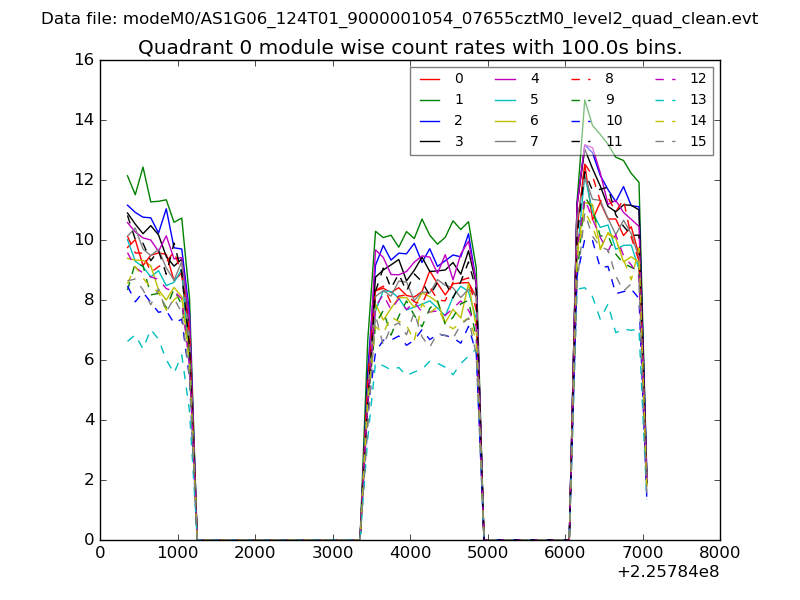 |
 |
| Module-wise count rates for Quadrant B Data is divided into 100 sec bins |
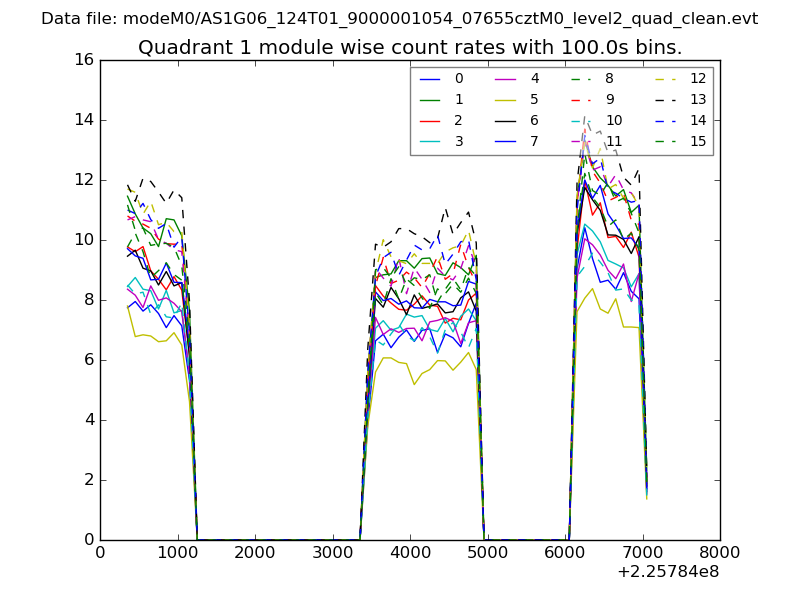 |
 |
| Module-wise count rates for Quadrant C Data is divided into 100 sec bins |
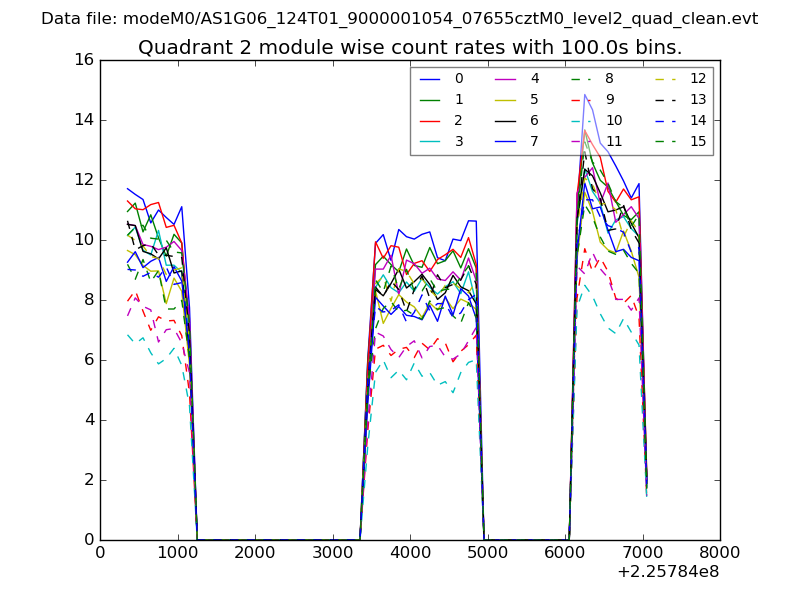 |
 |
| Module-wise count rates for Quadrant D Data is divided into 100 sec bins |
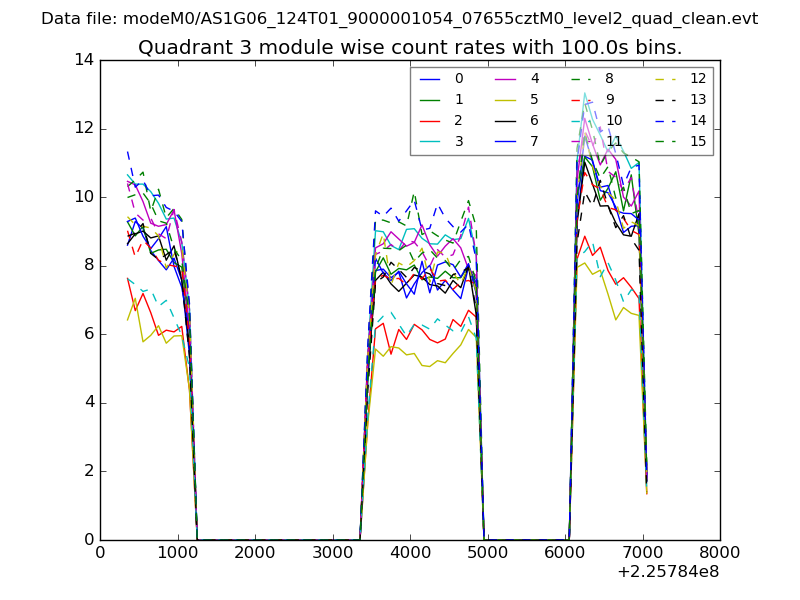 |
 |
| Parameter | Plot |
|---|---|
| CZT HV Monitor |  |
| D_VDD | 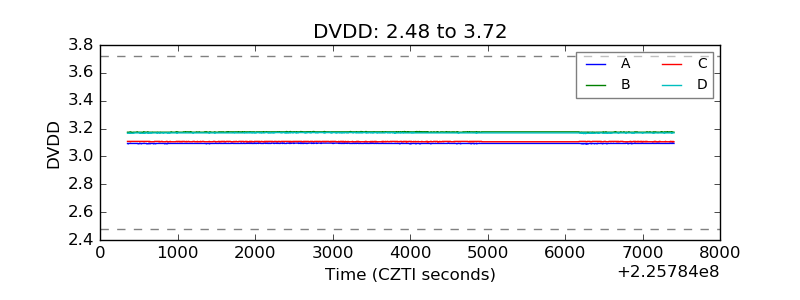 |
| Temperature 1 | 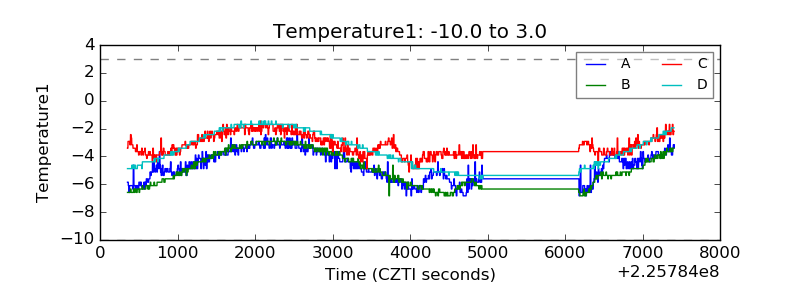 |
| Veto HV Monitor | 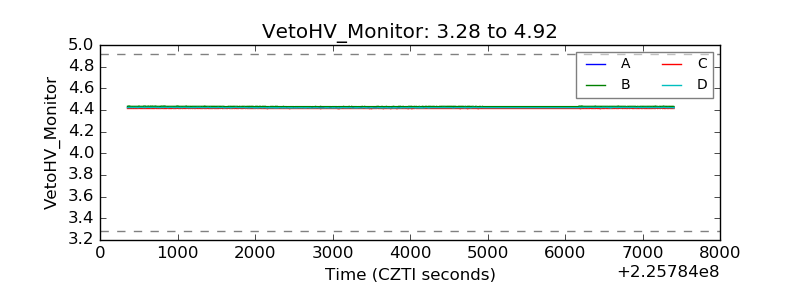 |
| Veto LLD | 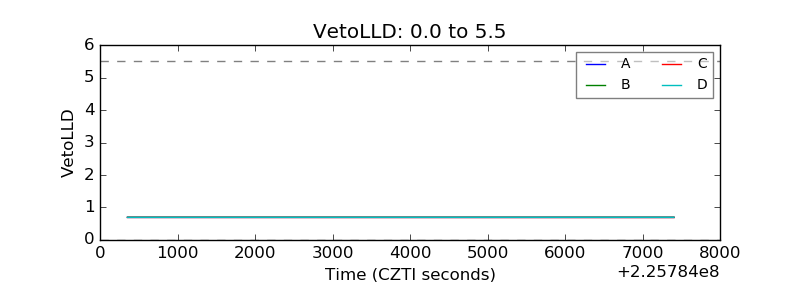 |
| Alpha Counter | 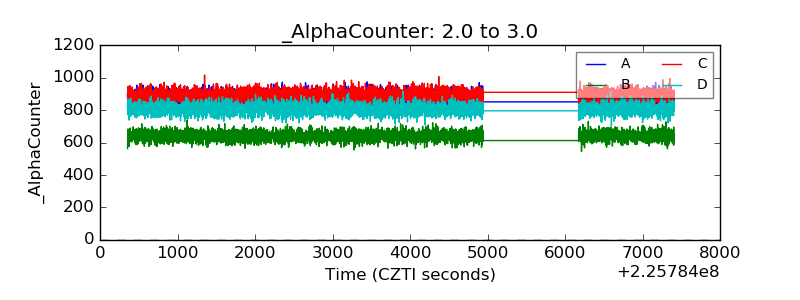 |
| _CPM_Rate | 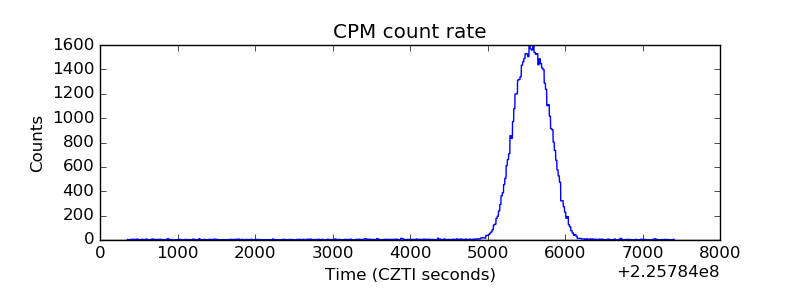 |
| CZT Counter | 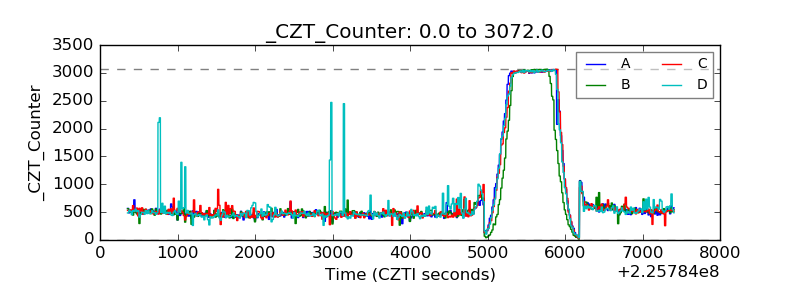 |
| +2.5 Volts monitor |  |
| +5 Volts monitor | 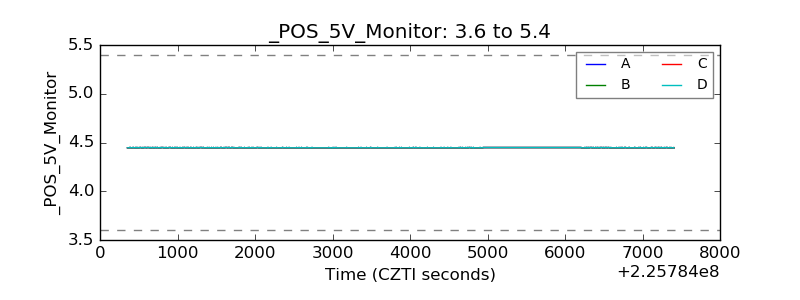 |
| _ROLL_ROT | 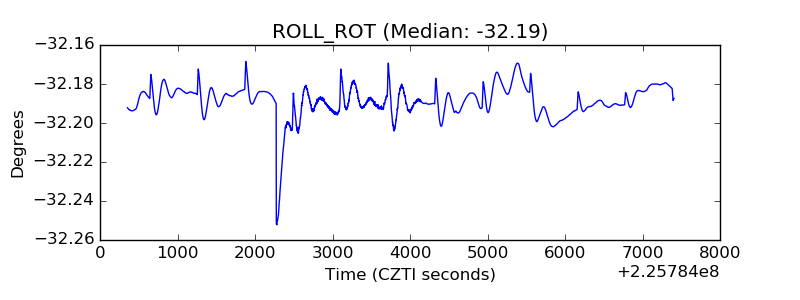 |
| _Roll_DEC | 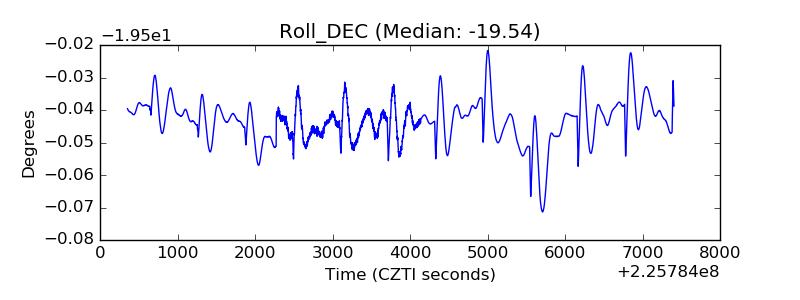 |
| _Roll_RA | 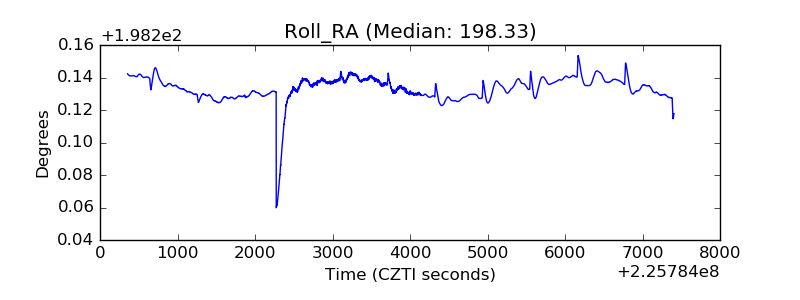 |
| Veto Counter | 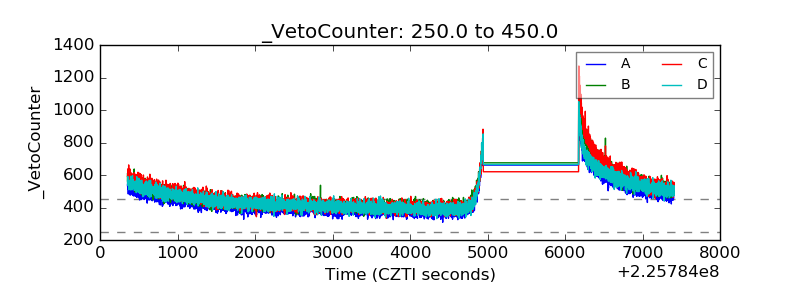 |