| Param | Original file | Final file |
|---|---|---|
| Filename | modeM0/AS1G06_124T01_9000001054_07658cztM0_level2.evt | modeM0/AS1G06_124T01_9000001054_07658cztM0_level2_quad_clean.evt |
| Size (bytes) | 438,698,880 | 63,400,320 |
| Size | 418.4 MB | 60.5 MB |
| Events in quadrant A | 3,184,392 | 371,455 |
| Events in quadrant B | 3,233,432 | 373,945 |
| Events in quadrant C | 3,133,707 | 372,331 |
| Events in quadrant D | 3,301,999 | 357,937 |
| Mode SS | |||
|---|---|---|---|
| Quadrant | BADHDUFLAG | Total packets | Discarded packets |
| A | 0 | 128 | 0 |
| B | 0 | 128 | 0 |
| C | 0 | 128 | 0 |
| D | 0 | 128 | 0 |
| Mode M9 | |||
|---|---|---|---|
| Quadrant | BADHDUFLAG | Total packets | Discarded packets |
| A | 0 | 17 | 0 |
| B | 0 | 17 | 0 |
| C | 0 | 17 | 0 |
| D | 0 | 18 | 0 |
| Mode M0 | |||
|---|---|---|---|
| Quadrant | BADHDUFLAG | Total packets | Discarded packets |
| A | 0 | 13358 | 2 |
| B | 0 | 13442 | 1 |
| C | 0 | 13330 | 1 |
| D | 0 | 13964 | 1 |
| Quadrant | Total seconds | Saturated seconds | Saturation percentage |
|---|---|---|---|
| A | 6363 | 143 | 2.247368% |
| B | 6363 | 140 | 2.200220% |
| C | 6363 | 94 | 1.477291% |
| D | 6363 | 106 | 1.665881% |
Noise dominated data is calculated using 1-second bins in cleaned event files. If a bin has >2000 counts, and if more than 50% of those come from <1% of pixels, then it is considered to be noise-dominated and hence unusable.
| Quadrant | # 1 sec bins | Bins with >0 counts | Bins with >2000 counts | High rate bins dominated by noise | Noise dominated (total time) | Noise dominated (detector-on time) | Marked lightcurve |
|---|---|---|---|---|---|---|---|
| A | 7513 | 6363 | 0 | 0 | 0.00% | 0.00% | 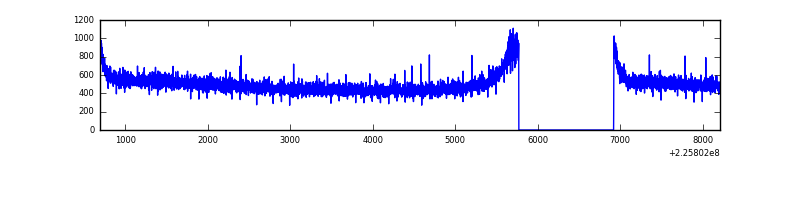 |
| B | 7513 | 6364 | 1 | 1 | 0.01% | 0.02% | 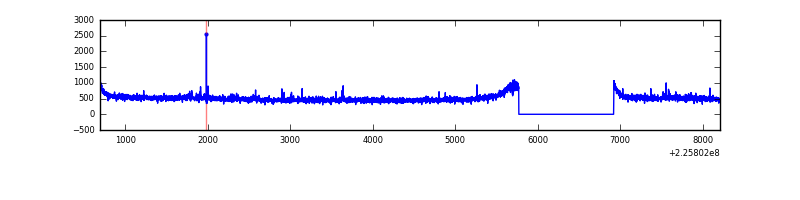 |
| C | 7513 | 6364 | 0 | 0 | 0.00% | 0.00% | 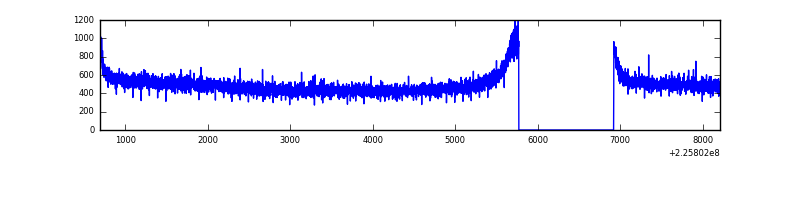 |
| D | 7513 | 6364 | 11 | 11 | 0.15% | 0.17% | 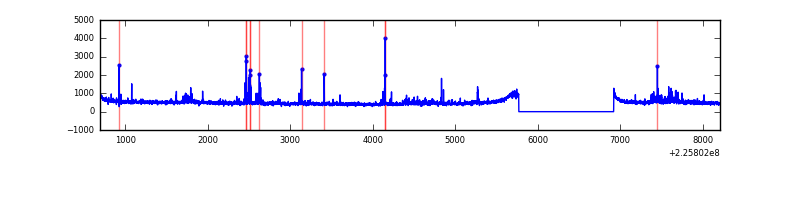 |
Top three noisy pixels from each quadrant. If the there are fewer than three noisy pixels in the level2.evt file, extra rows are filled as -1
| Pixel properties | Quadrant properties | ||||||
|---|---|---|---|---|---|---|---|
| Quadrant | DetID | PixID | Counts | Sigma | Mean | Median | Sigma |
| A | 0 | 226 | 7872 | 41.8 | 827 | 808 | 169.0 |
| A | 12 | 194 | 7409 | 39.06 | 827 | 808 | 169.0 |
| A | 3 | 1 | 3672 | 16.95 | 827 | 808 | 169.0 |
| B | 0 | 214 | 31958 | 197.62 | 824 | 805 | 157.6 |
| B | 12 | 111 | 16470 | 99.37 | 824 | 805 | 157.6 |
| B | 11 | 111 | 13627 | 81.34 | 824 | 805 | 157.6 |
| C | 13 | 61 | 6127 | 28.33 | 803 | 807 | 187.8 |
| C | 1 | 16 | 2600 | 9.55 | 803 | 807 | 187.8 |
| C | 3 | 202 | 1993 | 6.32 | 803 | 807 | 187.8 |
| D | 2 | 152 | 111569 | 561.86 | 806 | 783 | 197.2 |
| D | 14 | 34 | 65012 | 325.74 | 806 | 783 | 197.2 |
| D | 13 | 104 | 35003 | 173.55 | 806 | 783 | 197.2 |
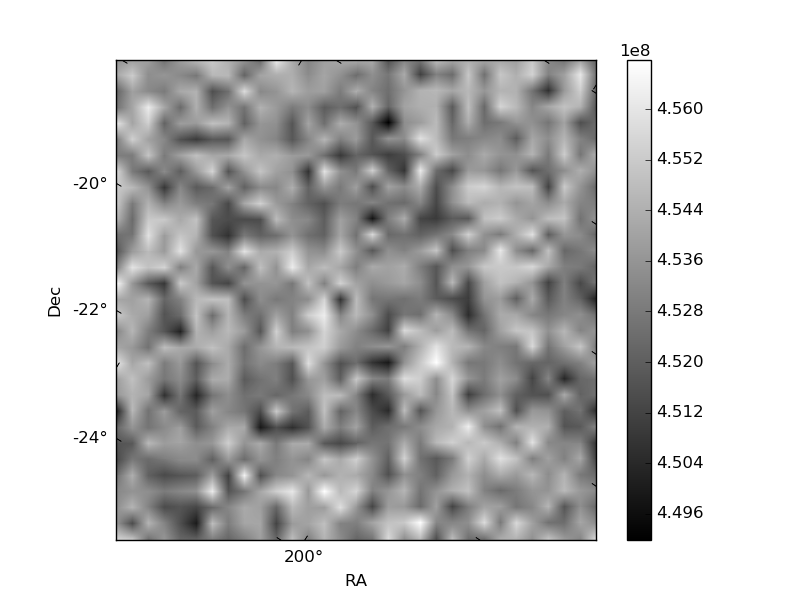
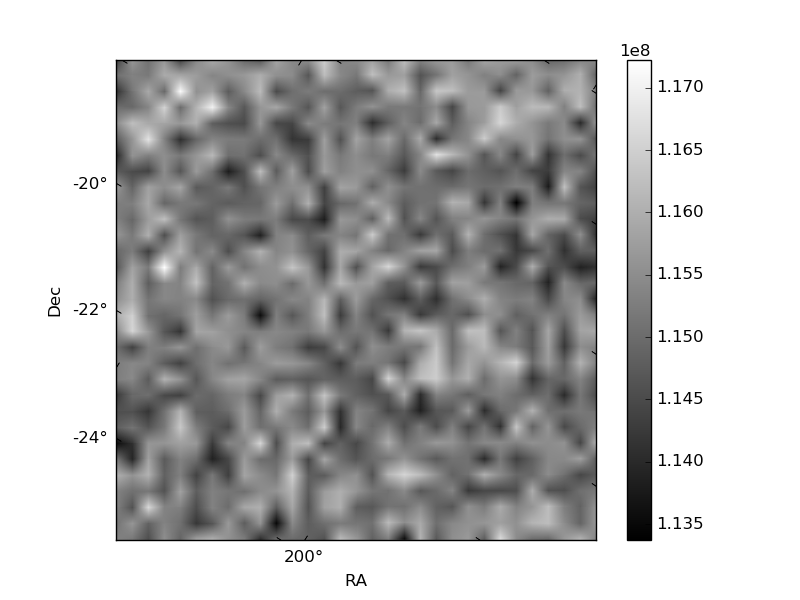
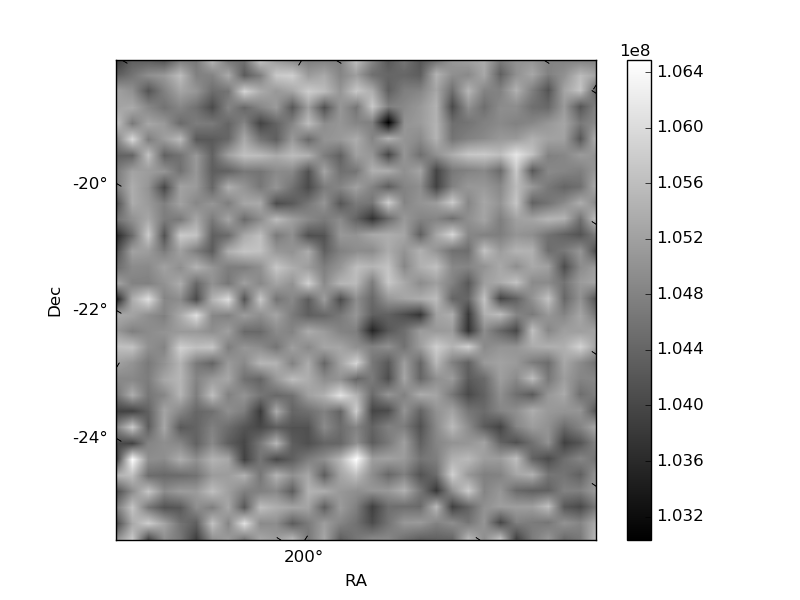
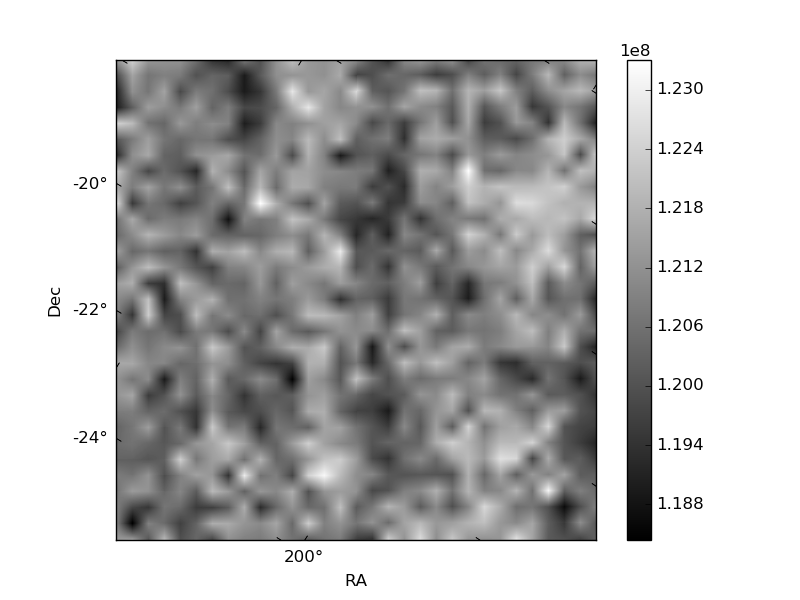
Histogram calculated using DETX and DETY for each event in the final _common_clean file
| Quadrant A | 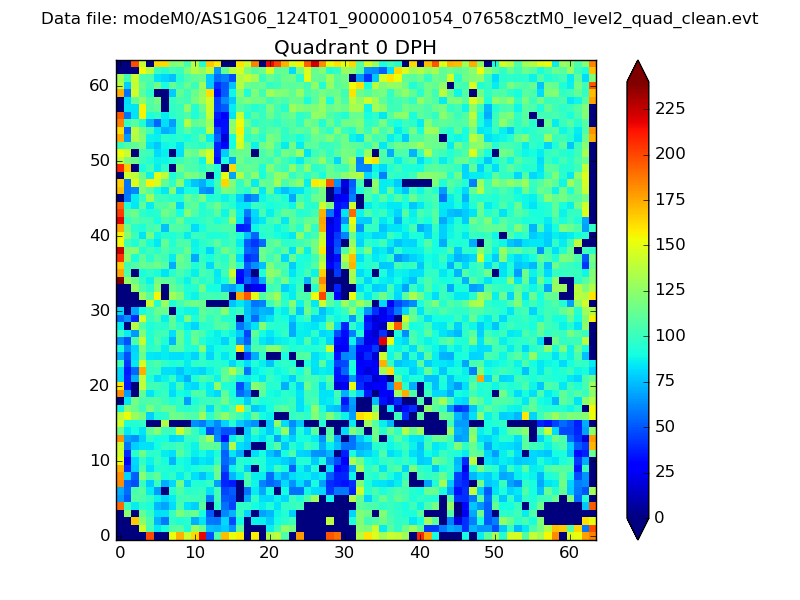 |
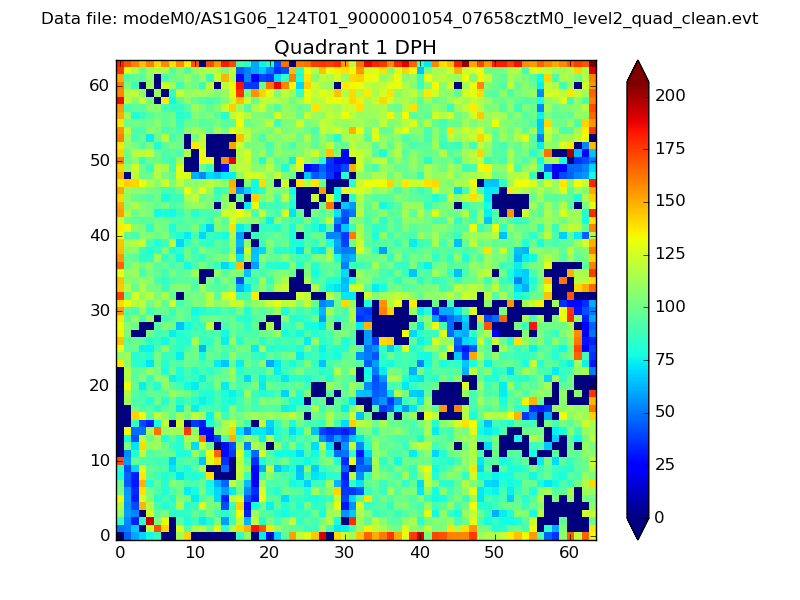 |
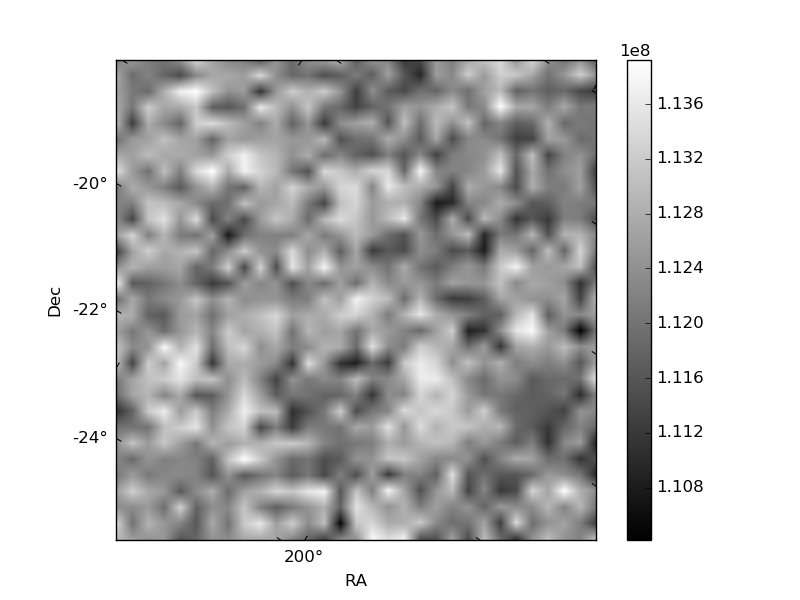
Quadrant B |
|---|---|---|---|
| Quadrant D | 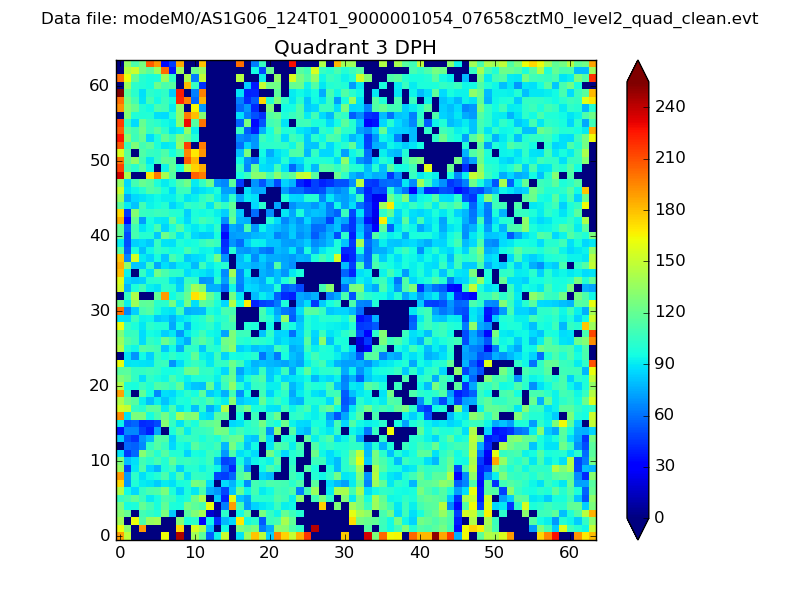 |
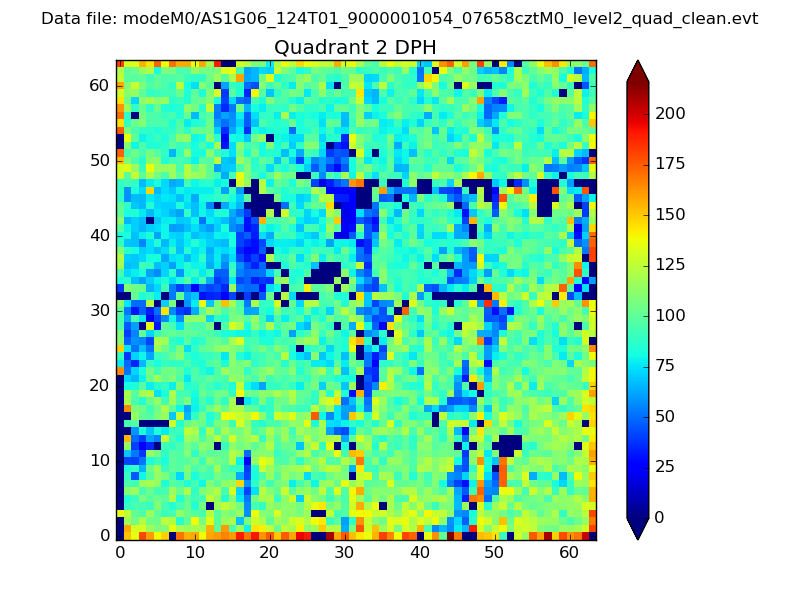 |
Quadrant C |
| Plot type | Count rate plots | Images |
|---|---|---|
| Comparison with Poisson distribution Blue bars denote a histogram of data divided into 1 sec bins. Red curve is a Poisson curve with rate = median count rate of data. |
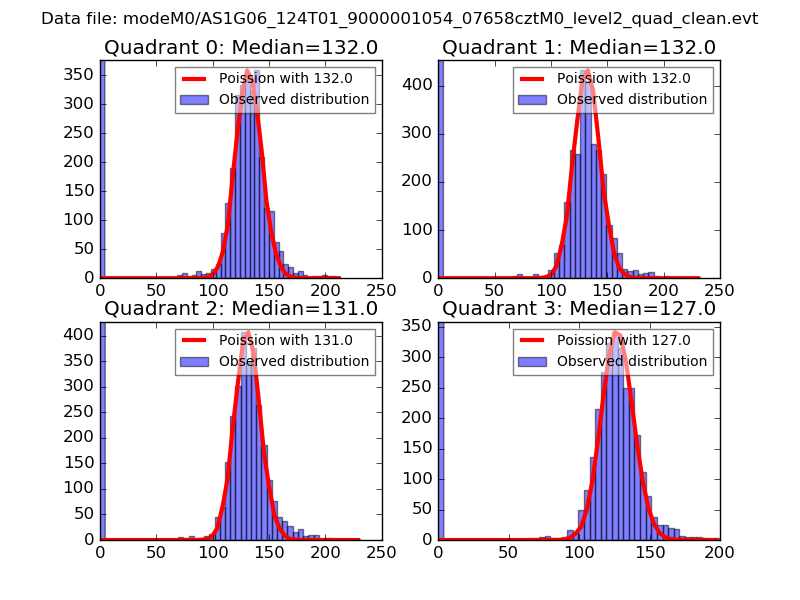 |
 |
| Quadrant-wise count rates Data is divided into 100 sec bins |
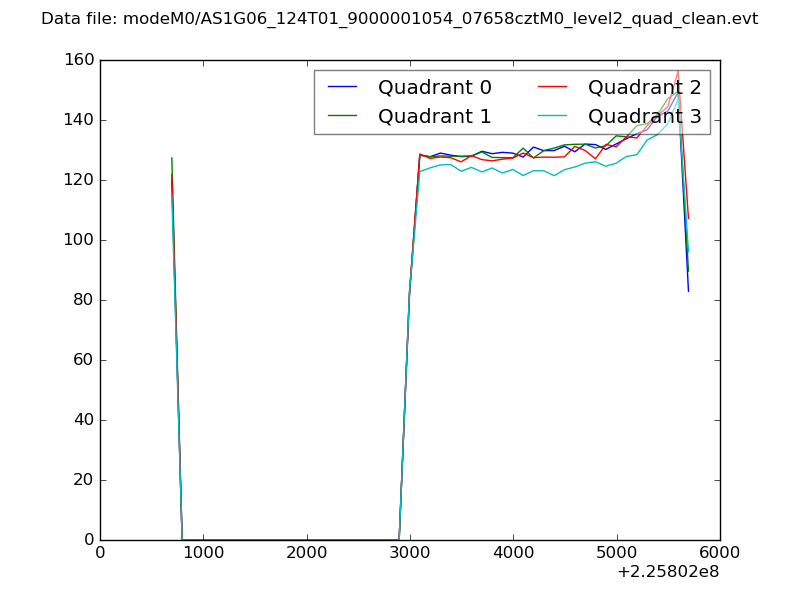 |
|
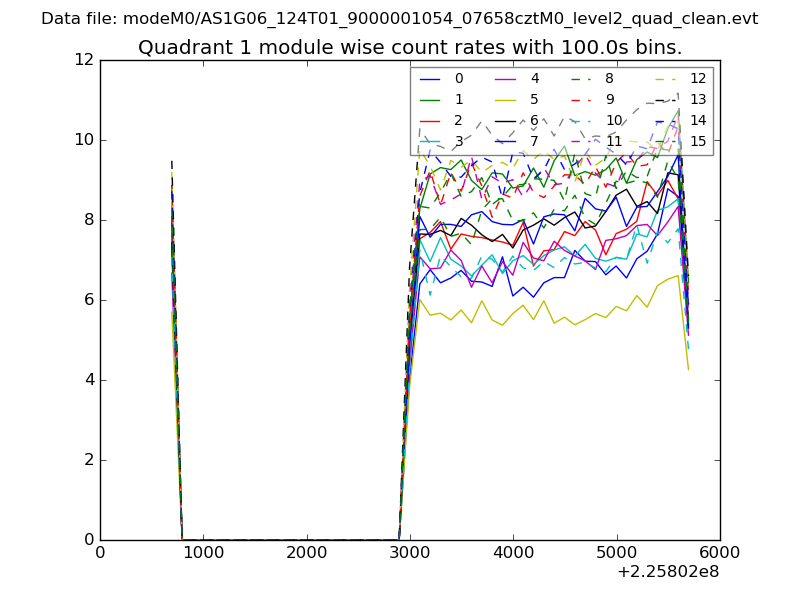
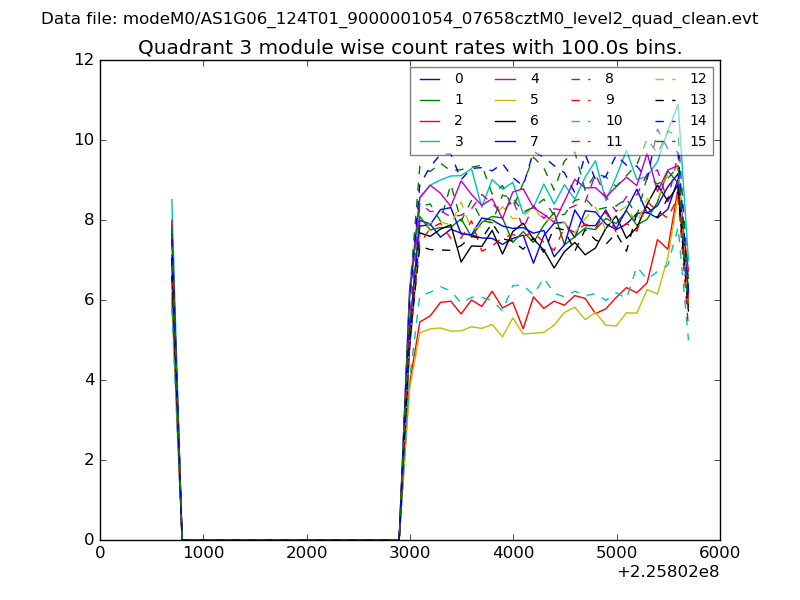
| Module-wise count rates for Quadrant A Data is divided into 100 sec bins |
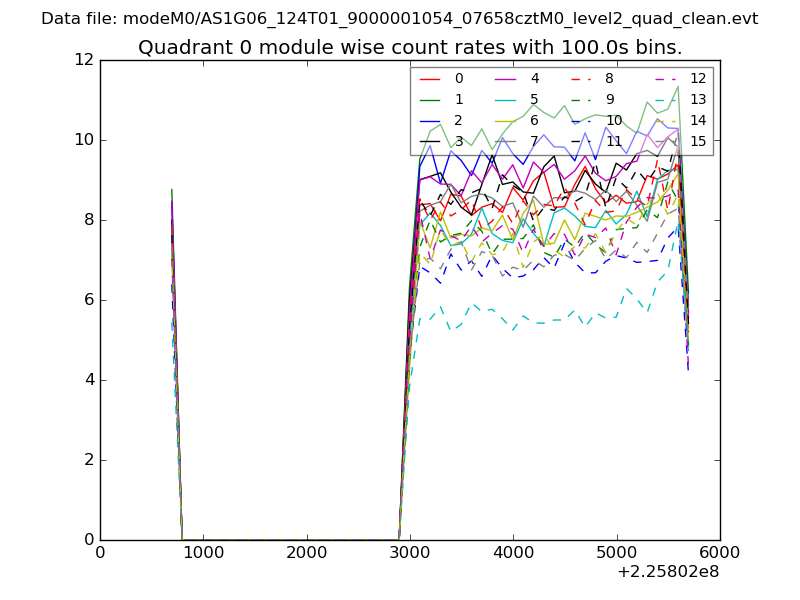 |
 |
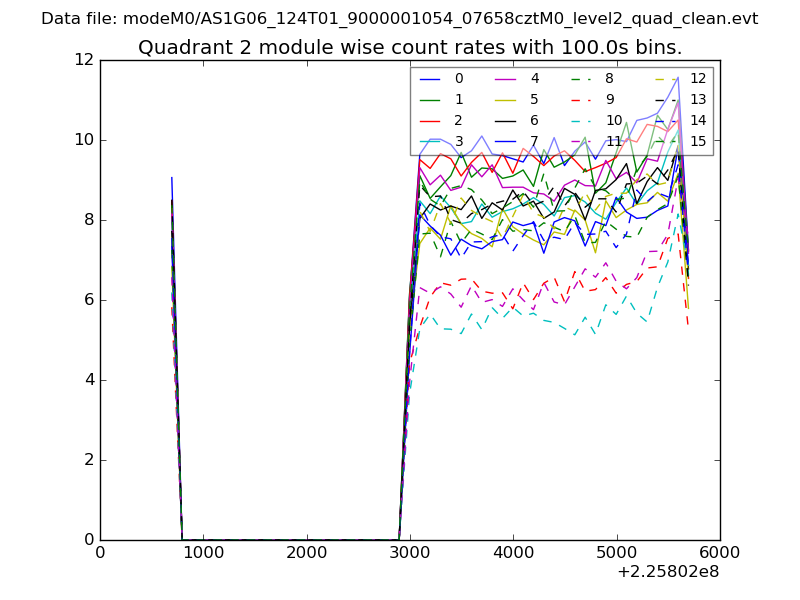
| Module-wise count rates for Quadrant B Data is divided into 100 sec bins |
 |
 |
| Module-wise count rates for Quadrant C Data is divided into 100 sec bins |
 |
 |
| Module-wise count rates for Quadrant D Data is divided into 100 sec bins |
 |
 |
| Parameter | Plot |
|---|---|
| CZT HV Monitor | 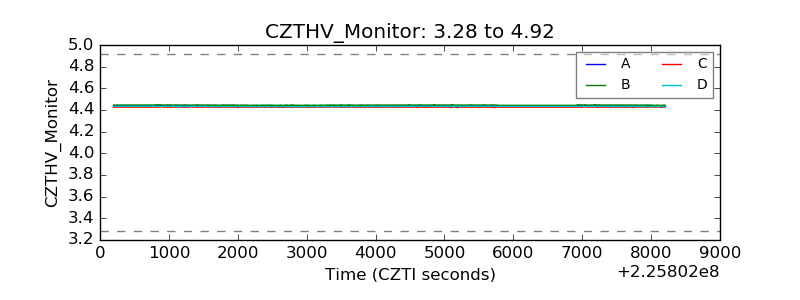 |
| D_VDD | 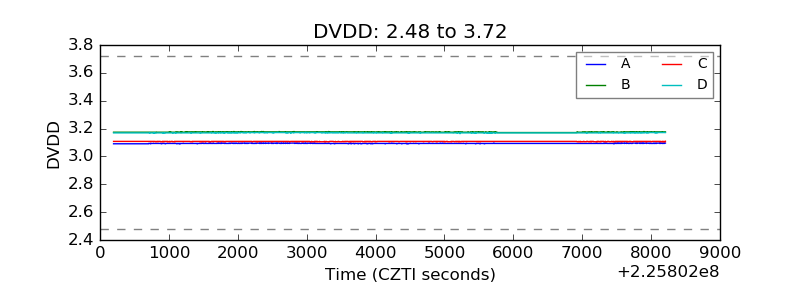 |
| Temperature 1 | 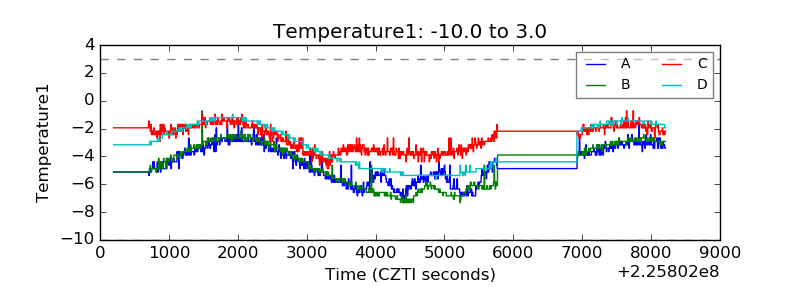 |
| Veto HV Monitor | 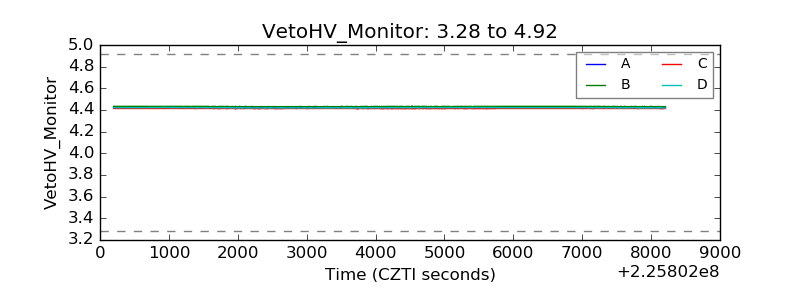 |
| Veto LLD | 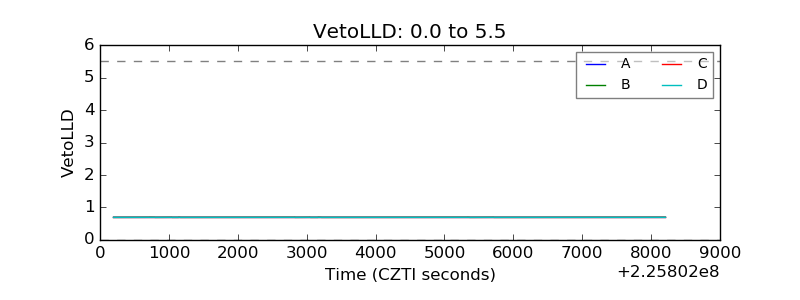 |
| Alpha Counter | 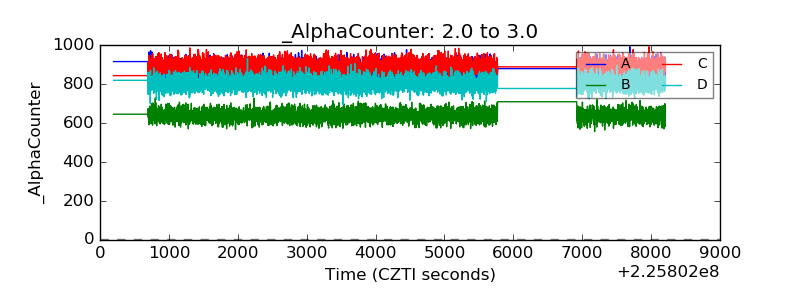 |
| _CPM_Rate | 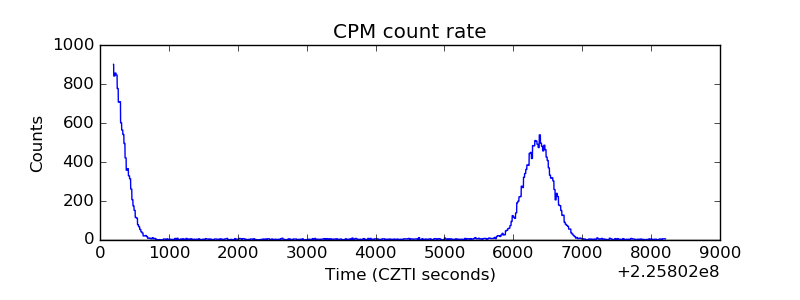 |
| CZT Counter |  |
| +2.5 Volts monitor |  |
| +5 Volts monitor |  |
| _ROLL_ROT | 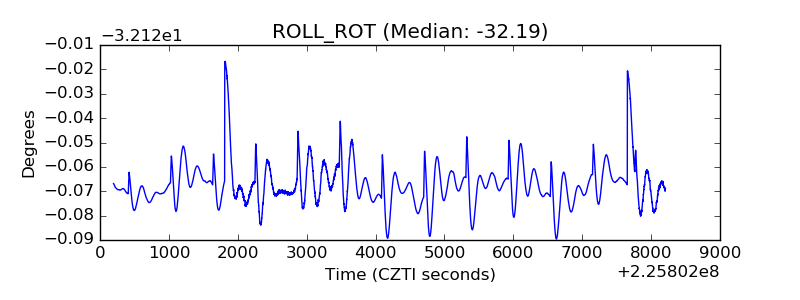 |
| _Roll_DEC | 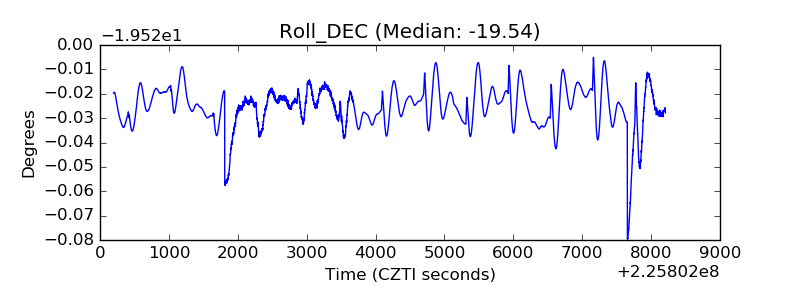 |
| _Roll_RA | 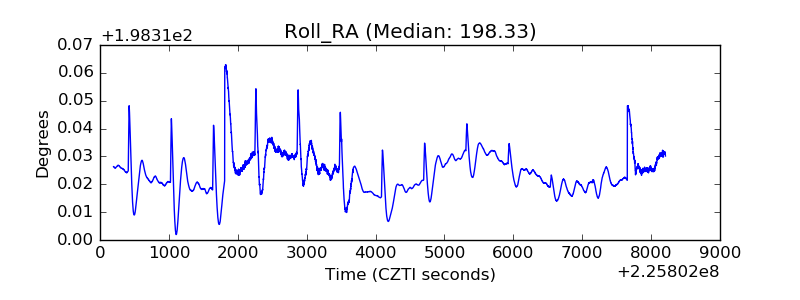 |
| Veto Counter | 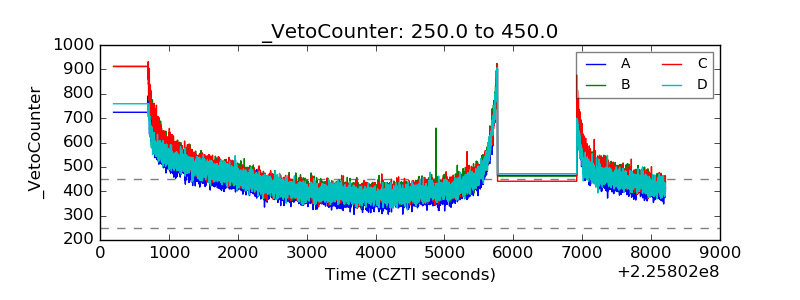 |