| Param | Original file | Final file |
|---|---|---|
| Filename | modeM0/AS1G06_114T01_9000001056cztM0_level2.fits | modeM0/AS1G06_114T01_9000001056cztM0_level2_quad_clean.evt |
| Size (bytes) | 388,451,520 | 353,868,480 |
| Size | 370.5 MB | 337.5 MB |
| Events in quadrant A | 2,351,168 | 2,052,400 |
| Events in quadrant B | 2,256,256 | 2,049,202 |
| Events in quadrant C | 2,315,338 | 1,965,979 |
| Events in quadrant D | 1,974,444 | 1,781,788 |
| Mode SS | |||
|---|---|---|---|
| Quadrant | BADHDUFLAG | Total packets | Discarded packets |
| A | 0 | 854 | 0 |
| B | 0 | 854 | 0 |
| C | 0 | 854 | 0 |
| D | 0 | 854 | 0 |
| Mode M9 | |||
|---|---|---|---|
| Quadrant | BADHDUFLAG | Total packets | Discarded packets |
| A | 0 | 55 | 0 |
| B | 0 | 55 | 0 |
| C | 0 | 55 | 0 |
| D | 0 | 55 | 0 |
| Mode M0 | |||
|---|---|---|---|
| Quadrant | BADHDUFLAG | Total packets | Discarded packets |
| A | 0 | 85636 | 0 |
| B | 0 | 89209 | 0 |
| C | 0 | 87378 | 0 |
| D | 0 | 100983 | 0 |
| Quadrant | Total seconds | Saturated seconds | Saturation percentage |
|---|---|---|---|
| A | 41742 | 376 | 0.900771% |
| B | 41742 | 610 | 1.461358% |
| C | 41742 | 274 | 0.656413% |
| D | 41742 | 1385 | 3.318001% |
Noise dominated data is calculated using 1-second bins in cleaned event files. If a bin has >2000 counts, and if more than 50% of those come from <1% of pixels, then it is considered to be noise-dominated and hence unusable.
| Quadrant | # 1 sec bins | Bins with >0 counts | Bins with >2000 counts | High rate bins dominated by noise | Noise dominated (total time) | Noise dominated (detector-on time) | Marked lightcurve |
|---|---|---|---|---|---|---|---|
| A | 47421 | 41741 | 0 | 0 | 0.00% | 0.00% | 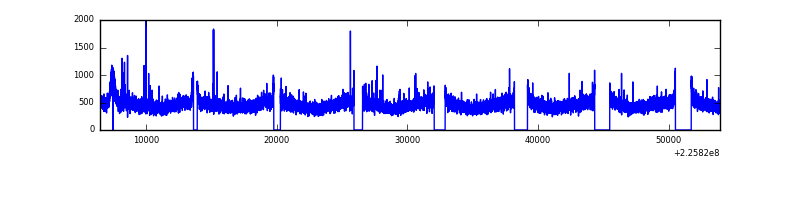 |
| B | 47422 | 41741 | 0 | 0 | 0.00% | 0.00% |  |
| C | 47422 | 41742 | 0 | 0 | 0.00% | 0.00% | 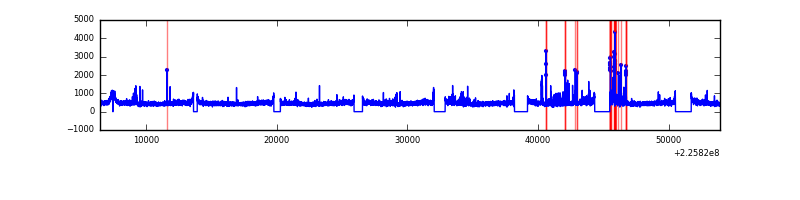 |
| D | 47422 | 41740 | 0 | 0 | 0.00% | 0.00% |  |
Top three noisy pixels from each quadrant. If the there are fewer than three noisy pixels in the level2.evt file, extra rows are filled as -1
| Pixel properties | Quadrant properties | ||||||
|---|---|---|---|---|---|---|---|
| Quadrant | DetID | PixID | Counts | Sigma | Mean | Median | Sigma |
| A | 14 | 188 | 2340 | 11.35 | 609 | 566 | 156.4 |
| A | 0 | 29 | 2323 | 11.24 | 609 | 566 | 156.4 |
| A | 14 | 204 | 2076 | 9.66 | 609 | 566 | 156.4 |
| B | 2 | 9 | 1981 | 11.59 | 595 | 563 | 122.4 |
| B | 3 | 17 | 1592 | 8.41 | 595 | 563 | 122.4 |
| B | 14 | 254 | 1562 | 8.16 | 595 | 563 | 122.4 |
| C | 12 | 241 | 1664 | 6.71 | 613 | 566 | 163.6 |
| C | 2 | 191 | 1557 | 6.06 | 613 | 566 | 163.6 |
| C | 9 | 188 | 1519 | 5.83 | 613 | 566 | 163.6 |
| D | 7 | 3 | 1475 | 6.28 | 565 | 513 | 153.1 |
| D | 6 | 231 | 1444 | 6.08 | 565 | 513 | 153.1 |
| D | 10 | 189 | 1422 | 5.94 | 565 | 513 | 153.1 |
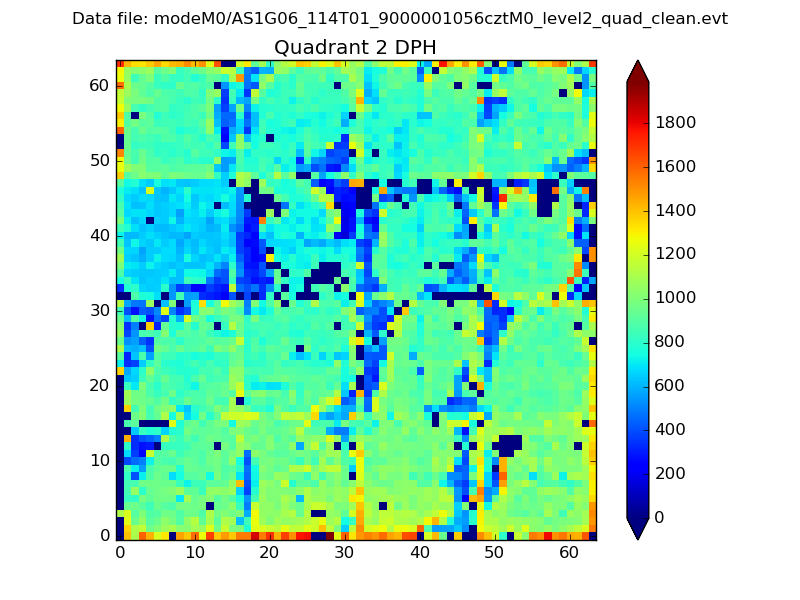
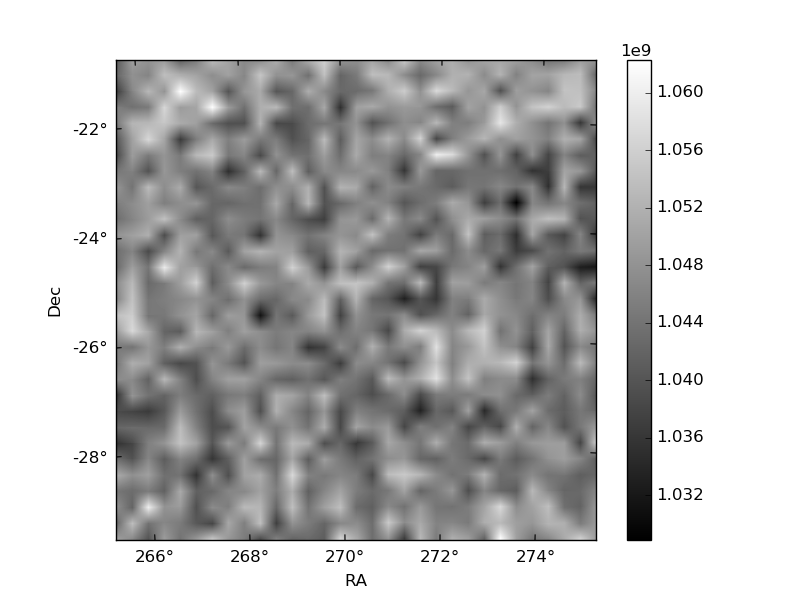
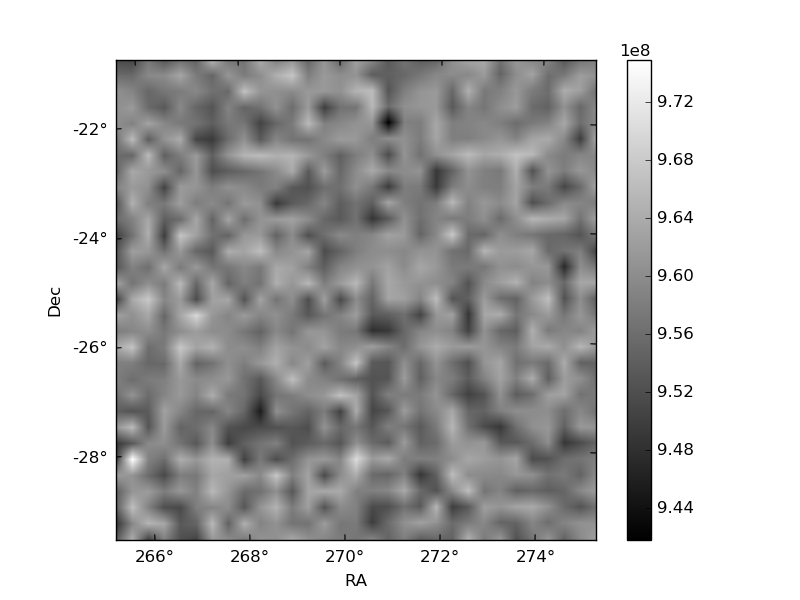
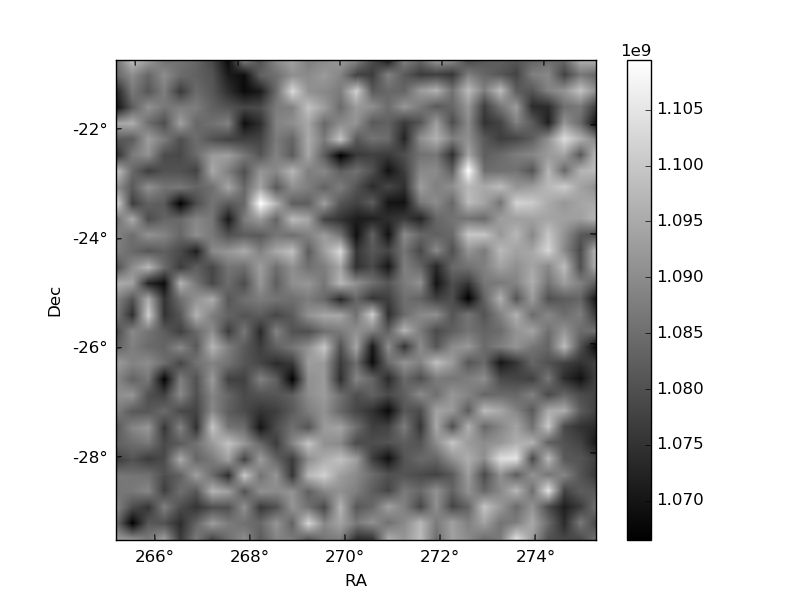
Histogram calculated using DETX and DETY for each event in the final _common_clean file
| Quadrant A | 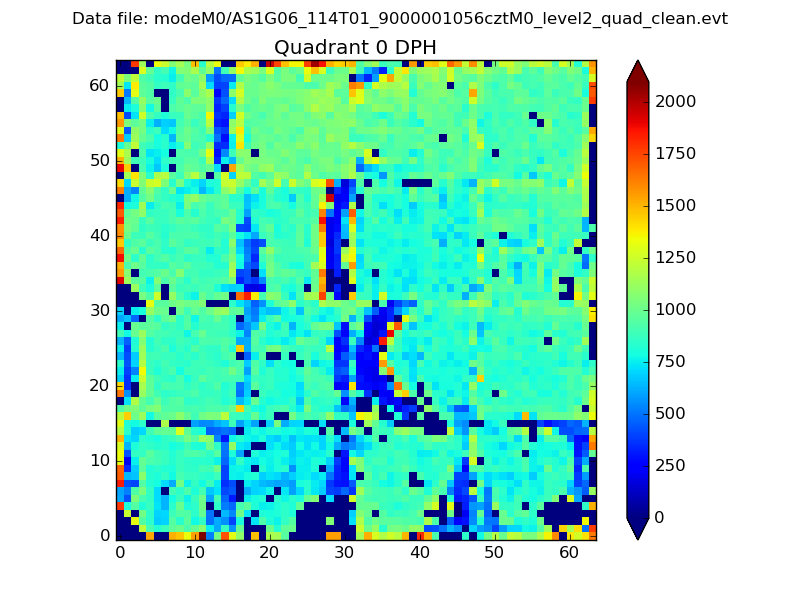 |
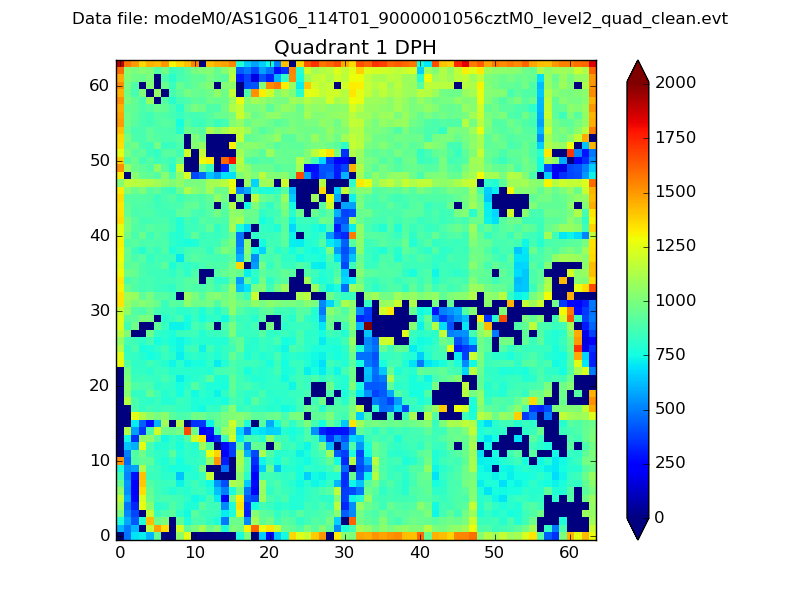 |
Quadrant B |
|---|---|---|---|
| Quadrant D | 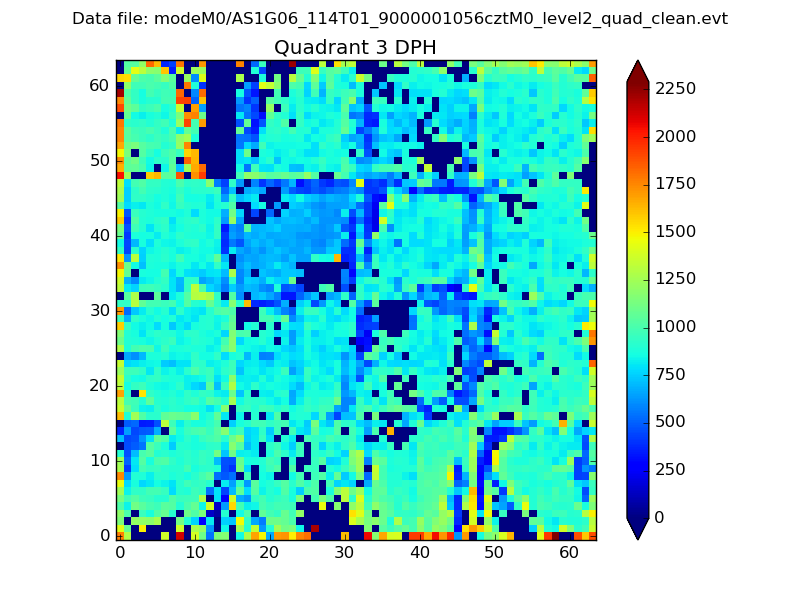 |
 |
Quadrant C |
| Plot type | Count rate plots | Images |
|---|---|---|
| Comparison with Poisson distribution Blue bars denote a histogram of data divided into 1 sec bins. Red curve is a Poisson curve with rate = median count rate of data. |
 |
 |
| Quadrant-wise count rates Data is divided into 100 sec bins |
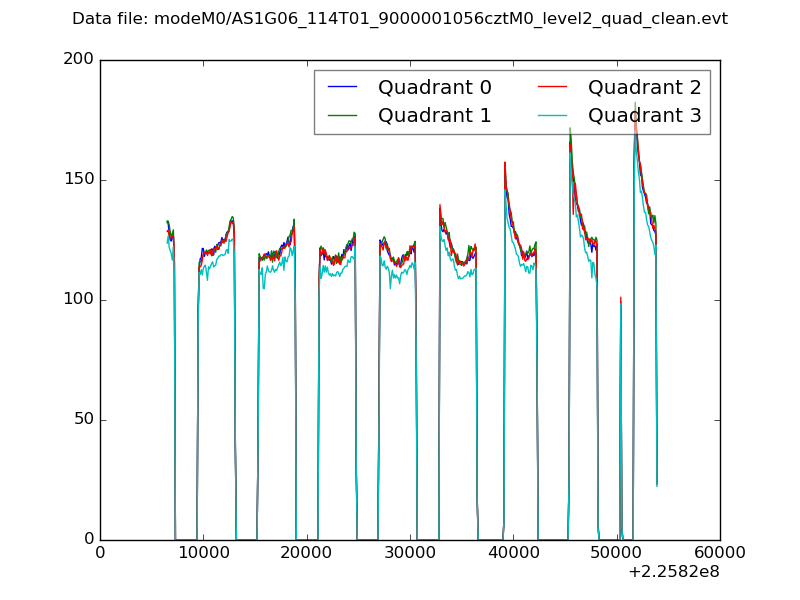 |
|
| Module-wise count rates for Quadrant A Data is divided into 100 sec bins |
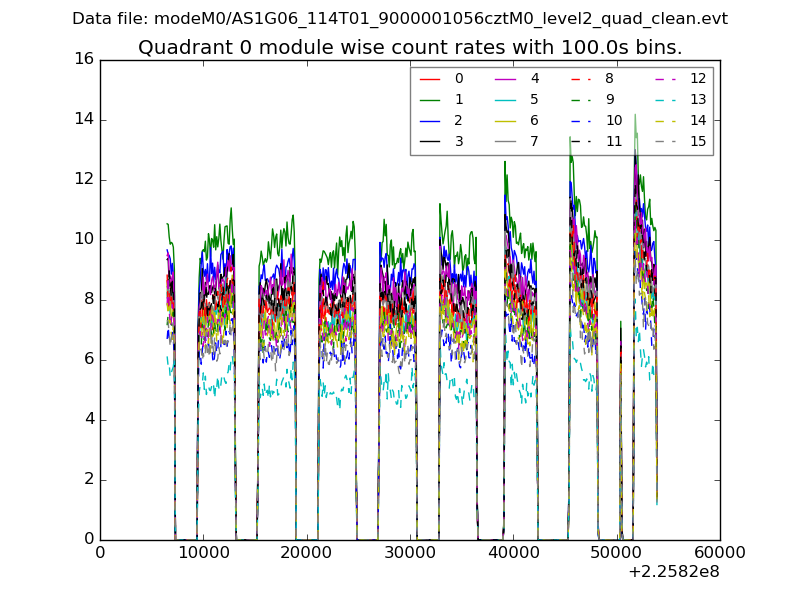 |
 |
| Module-wise count rates for Quadrant B Data is divided into 100 sec bins |
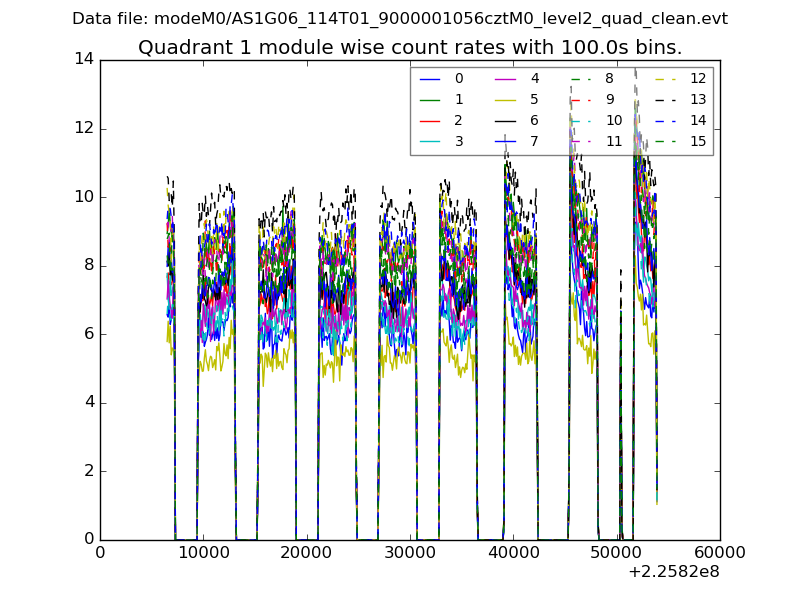 |
 |
| Module-wise count rates for Quadrant C Data is divided into 100 sec bins |
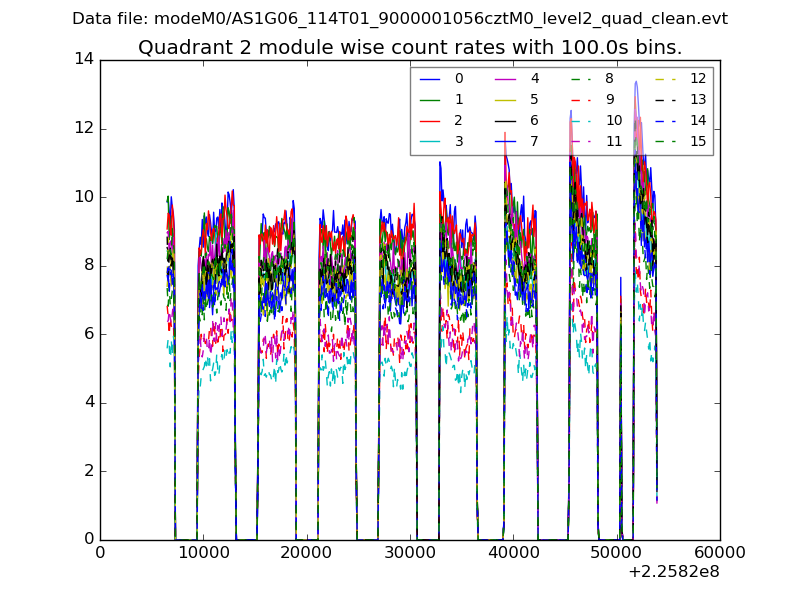 |
 |
| Module-wise count rates for Quadrant D Data is divided into 100 sec bins |
 |
 |
| Parameter | Plot |
|---|---|
| CZT HV Monitor | 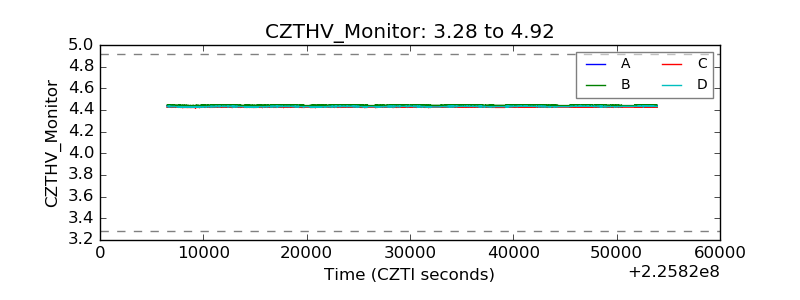 |
| D_VDD | 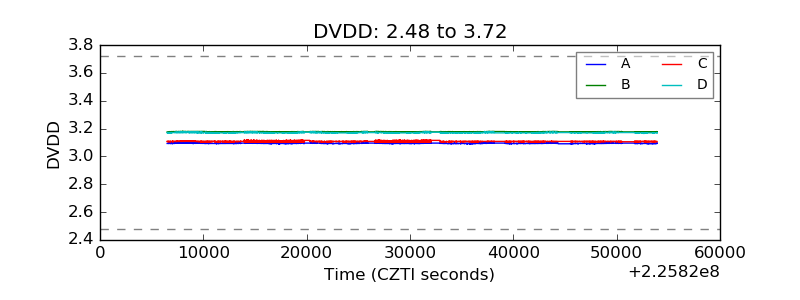 |
| Temperature 1 |  |
| Veto HV Monitor | 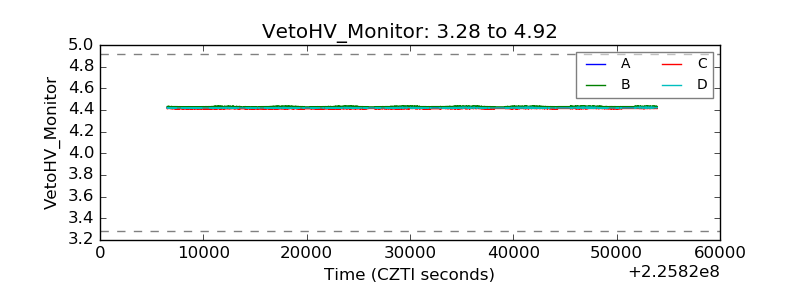 |
| Veto LLD | 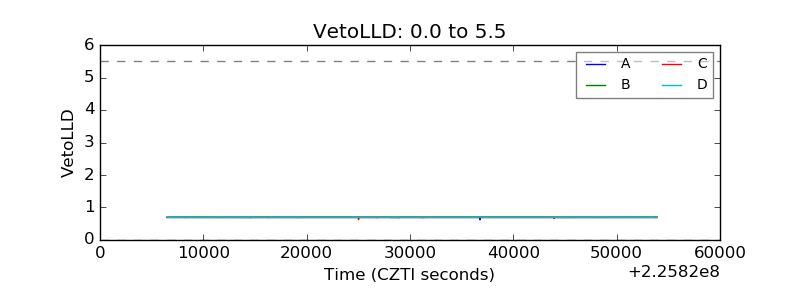 |
| Alpha Counter | 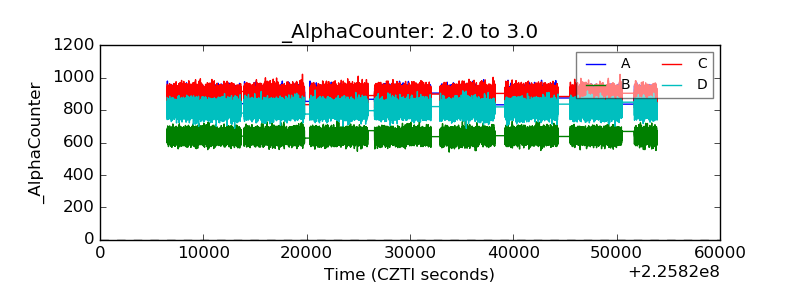 |
| _CPM_Rate | 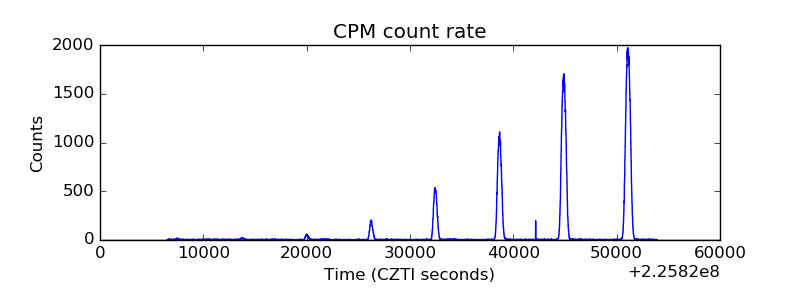 |
| CZT Counter | 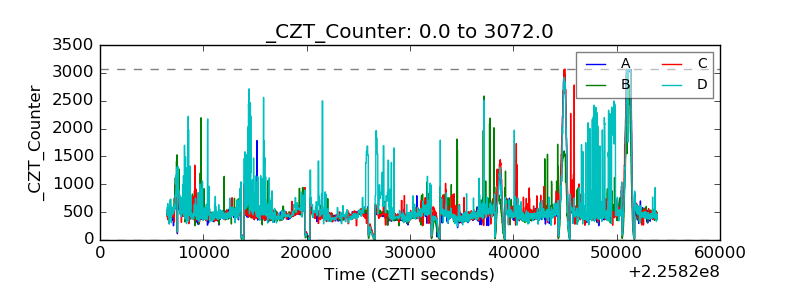 |
| +2.5 Volts monitor |  |
| +5 Volts monitor | 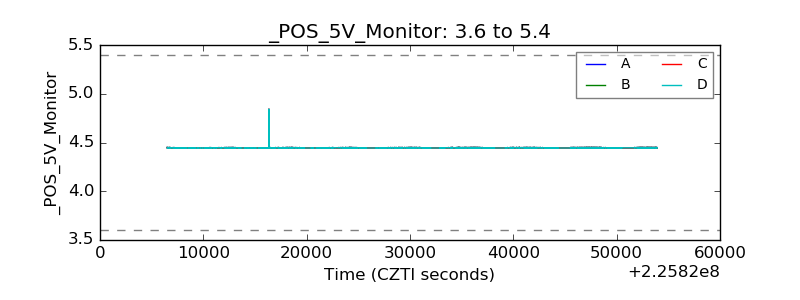 |
| _ROLL_ROT | 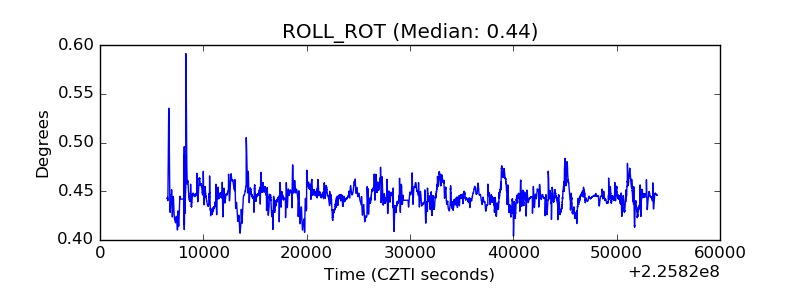 |
| _Roll_DEC | 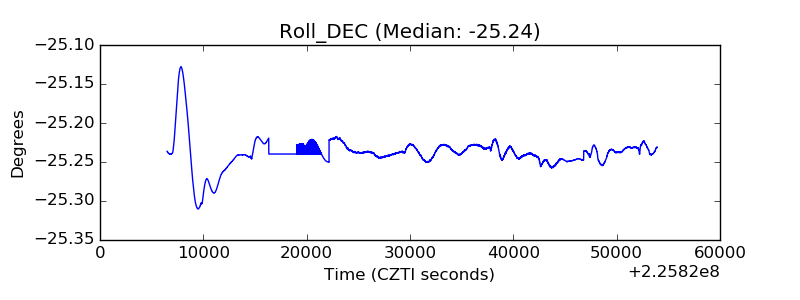 |
| _Roll_RA | 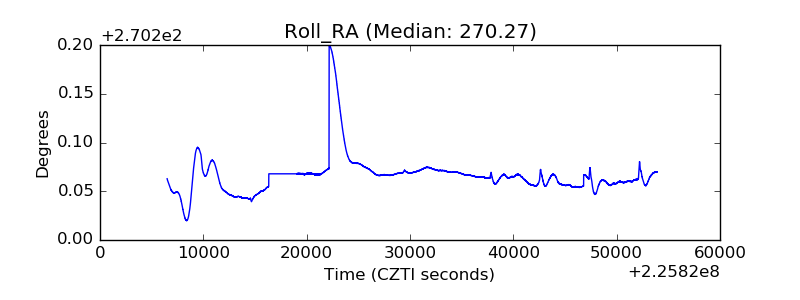 |
| Veto Counter |  |