| Param | Original file | Final file |
|---|---|---|
| Filename | modeM0/AS1G06_114T01_9000001056_07661cztM0_level2.evt | modeM0/AS1G06_114T01_9000001056_07661cztM0_level2_quad_clean.evt |
| Size (bytes) | 217,054,080 | 19,710,720 |
| Size | 207.0 MB | 18.8 MB |
| Events in quadrant A | 1,487,364 | 101,295 |
| Events in quadrant B | 1,665,092 | 102,735 |
| Events in quadrant C | 1,501,940 | 101,320 |
| Events in quadrant D | 1,732,540 | 96,561 |
| Mode SS | |||
|---|---|---|---|
| Quadrant | BADHDUFLAG | Total packets | Discarded packets |
| A | 0 | 56 | 0 |
| B | 0 | 56 | 0 |
| C | 0 | 56 | 0 |
| D | 0 | 56 | 0 |
| Mode M0 | |||
|---|---|---|---|
| Quadrant | BADHDUFLAG | Total packets | Discarded packets |
| A | 0 | 6105 | 2 |
| B | 0 | 6648 | 1 |
| C | 0 | 6231 | 1 |
| D | 0 | 6933 | 1 |
| Quadrant | Total seconds | Saturated seconds | Saturation percentage |
|---|---|---|---|
| A | 2707 | 223 | 8.237902% |
| B | 2707 | 272 | 10.048024% |
| C | 2707 | 112 | 4.137421% |
| D | 2707 | 170 | 6.280015% |
Noise dominated data is calculated using 1-second bins in cleaned event files. If a bin has >2000 counts, and if more than 50% of those come from <1% of pixels, then it is considered to be noise-dominated and hence unusable.
| Quadrant | # 1 sec bins | Bins with >0 counts | Bins with >2000 counts | High rate bins dominated by noise | Noise dominated (total time) | Noise dominated (detector-on time) | Marked lightcurve |
|---|---|---|---|---|---|---|---|
| A | 2732 | 2708 | 0 | 0 | 0.00% | 0.00% | 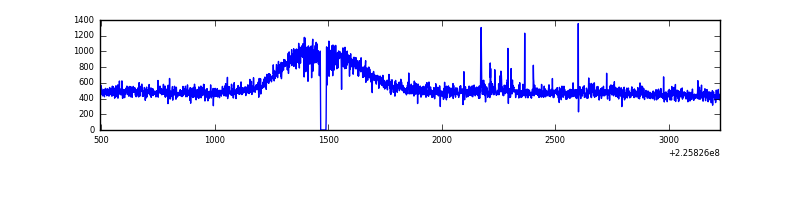 |
| B | 2732 | 2708 | 4 | 4 | 0.15% | 0.15% | 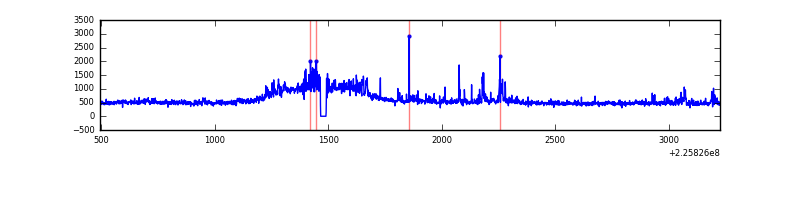 |
| C | 2732 | 2708 | 0 | 0 | 0.00% | 0.00% | 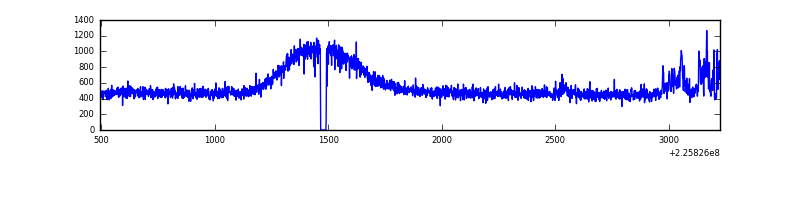 |
| D | 2732 | 2708 | 19 | 19 | 0.70% | 0.70% | 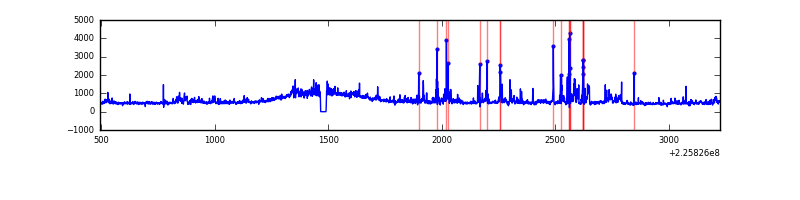 |
Top three noisy pixels from each quadrant. If the there are fewer than three noisy pixels in the level2.evt file, extra rows are filled as -1
| Pixel properties | Quadrant properties | ||||||
|---|---|---|---|---|---|---|---|
| Quadrant | DetID | PixID | Counts | Sigma | Mean | Median | Sigma |
| A | 13 | 251 | 17162 | 205.85 | 381 | 371 | 81.6 |
| A | 0 | 226 | 3766 | 41.62 | 381 | 371 | 81.6 |
| A | 12 | 194 | 3606 | 39.66 | 381 | 371 | 81.6 |
| B | 0 | 229 | 88529 | 1158.16 | 374 | 364 | 76.1 |
| B | 0 | 219 | 60468 | 789.54 | 374 | 364 | 76.1 |
| B | 10 | 245 | 14313 | 183.24 | 374 | 364 | 76.1 |
| C | 8 | 208 | 62378 | 694.92 | 368 | 369 | 89.2 |
| C | 13 | 61 | 2916 | 28.54 | 368 | 369 | 89.2 |
| C | 1 | 16 | 2580 | 24.78 | 368 | 369 | 89.2 |
| D | 13 | 104 | 150954 | 1593.13 | 371 | 358 | 94.5 |
| D | 12 | 233 | 32597 | 341.05 | 371 | 358 | 94.5 |
| D | 2 | 152 | 24186 | 252.07 | 371 | 358 | 94.5 |
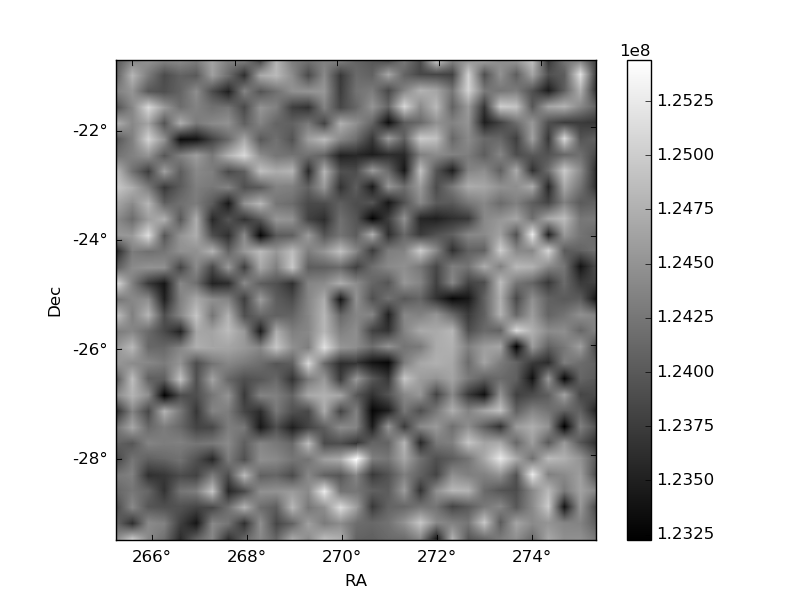
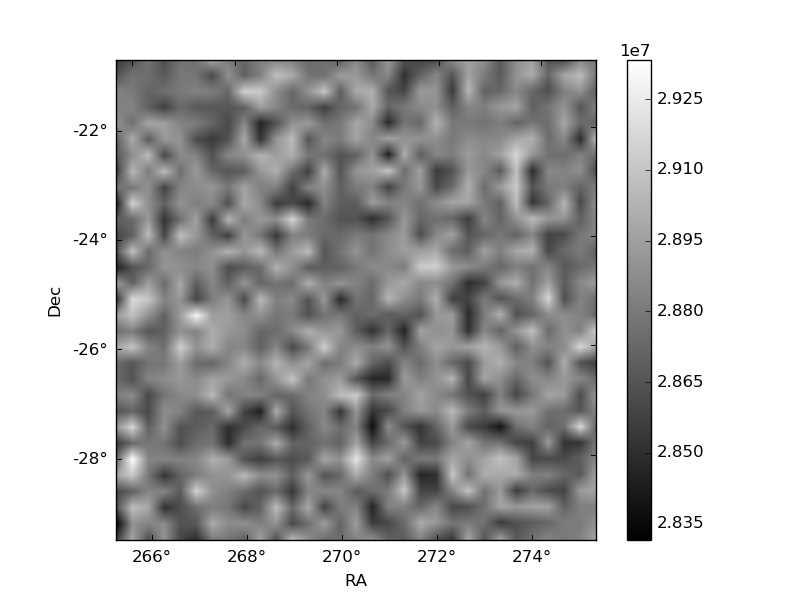
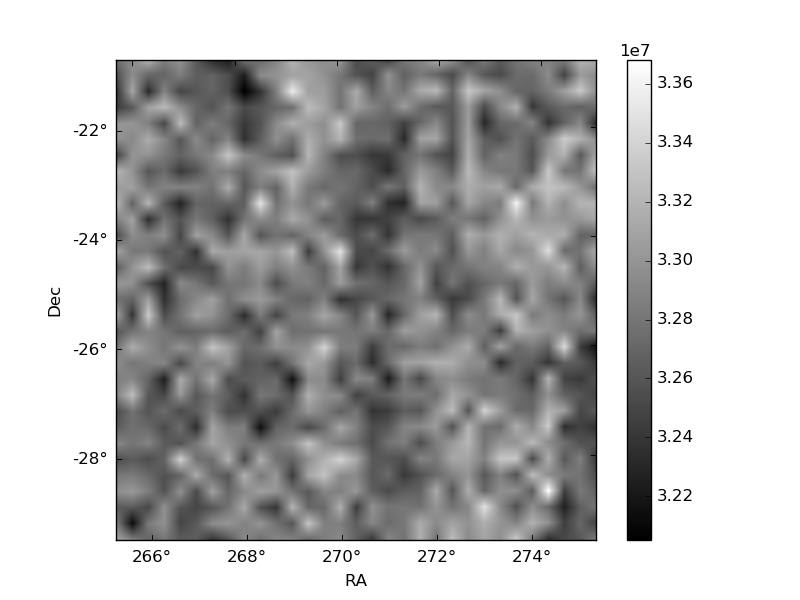
Histogram calculated using DETX and DETY for each event in the final _common_clean file
| Quadrant A | 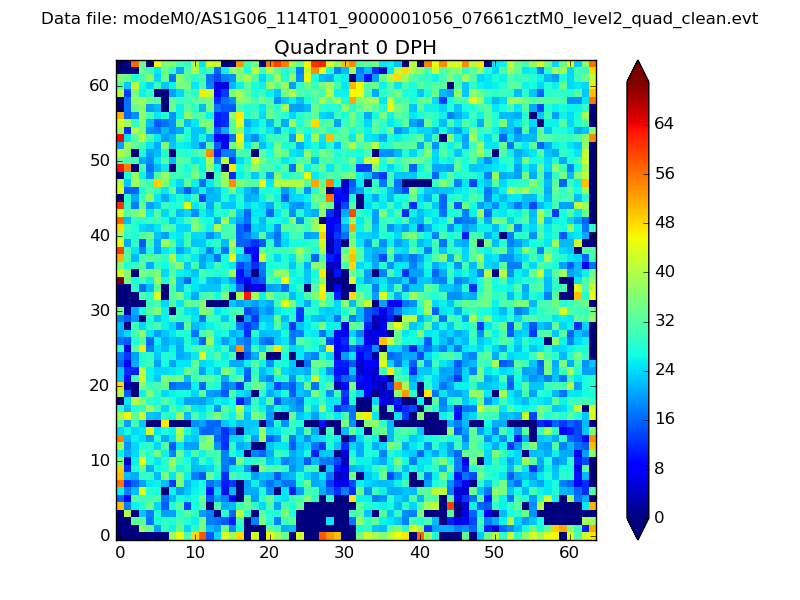 |
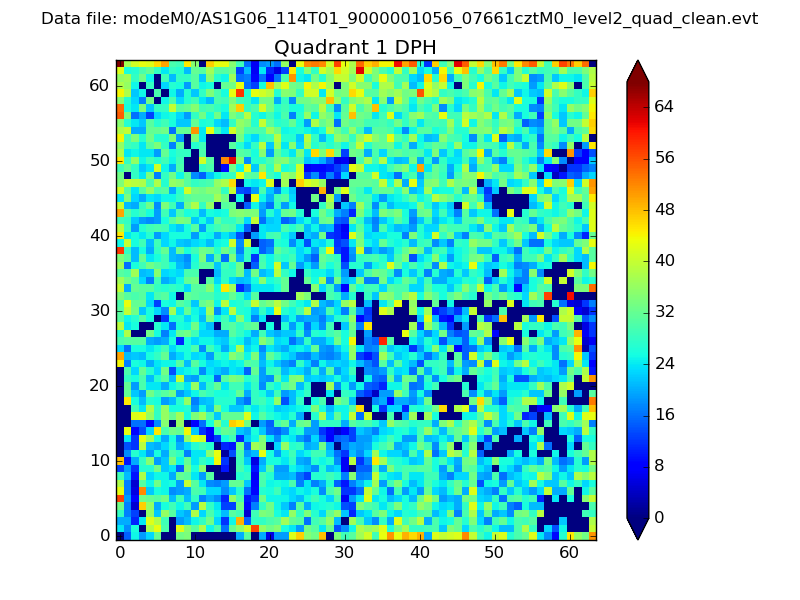 |
Quadrant B |
|---|---|---|---|
| Quadrant D | 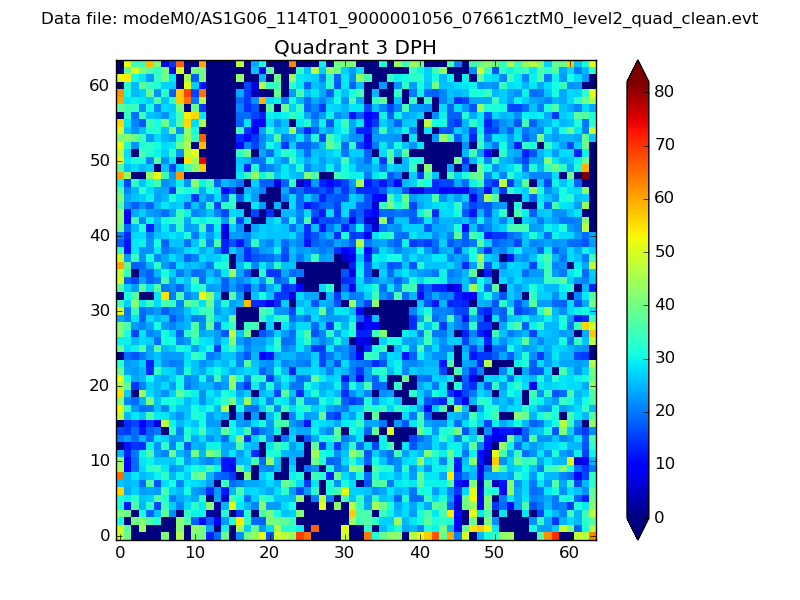 |
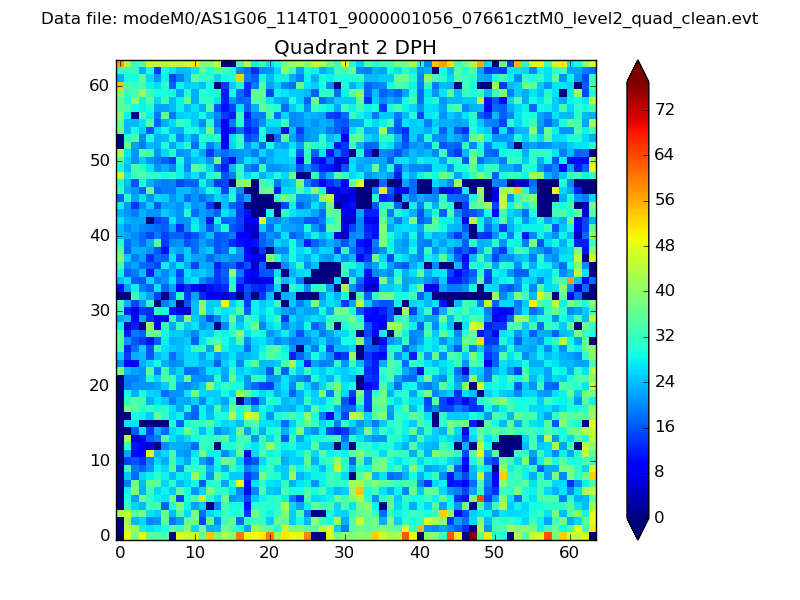 |
Quadrant C |
| Plot type | Count rate plots | Images |
|---|---|---|
| Comparison with Poisson distribution Blue bars denote a histogram of data divided into 1 sec bins. Red curve is a Poisson curve with rate = median count rate of data. |
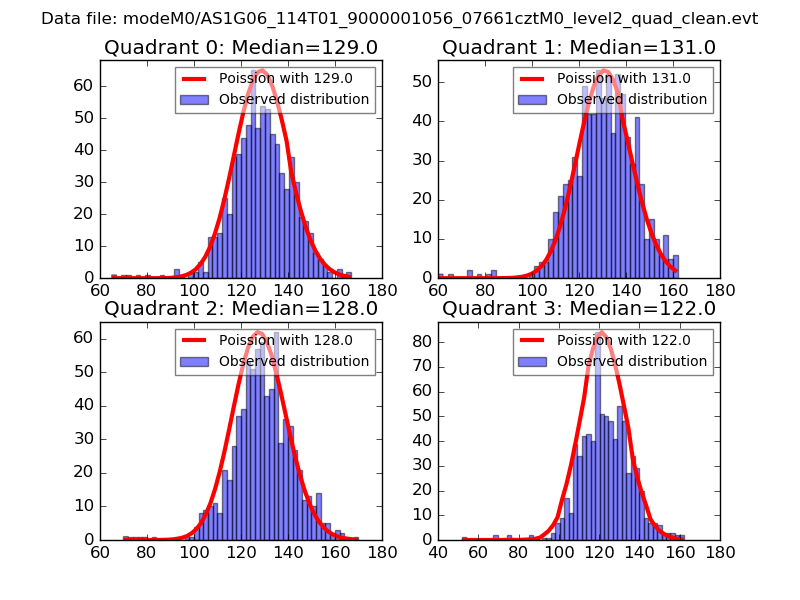 |
 |
| Quadrant-wise count rates Data is divided into 100 sec bins |
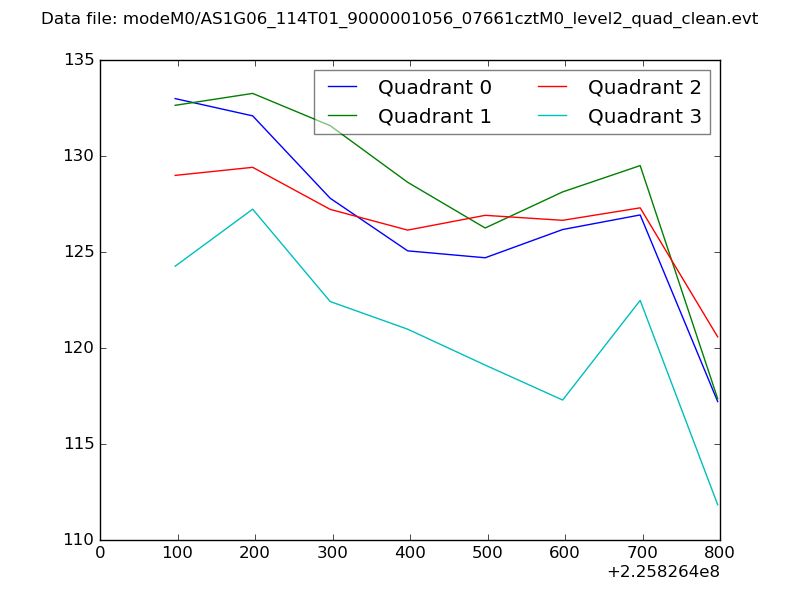 |
|
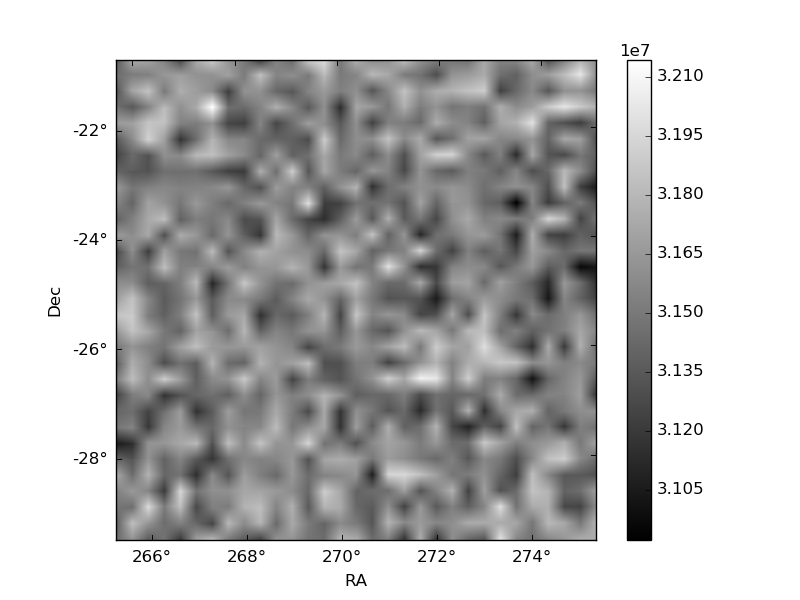
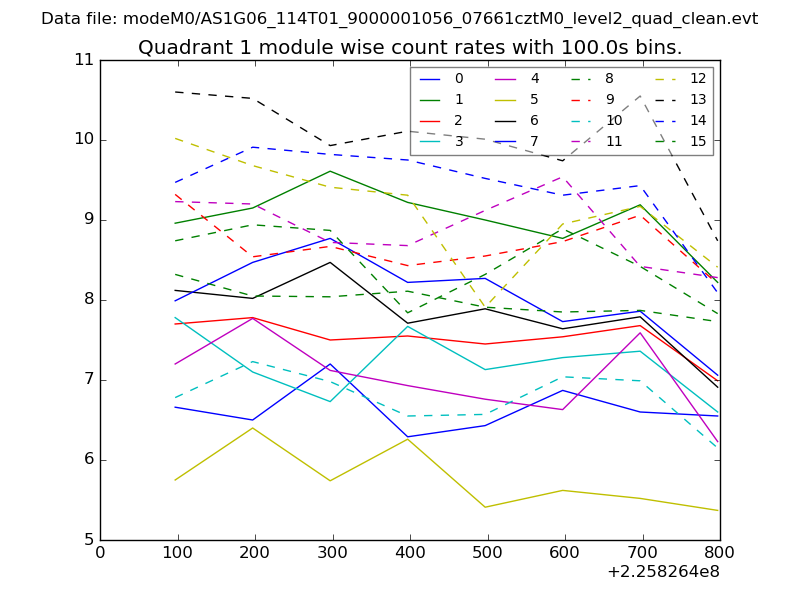
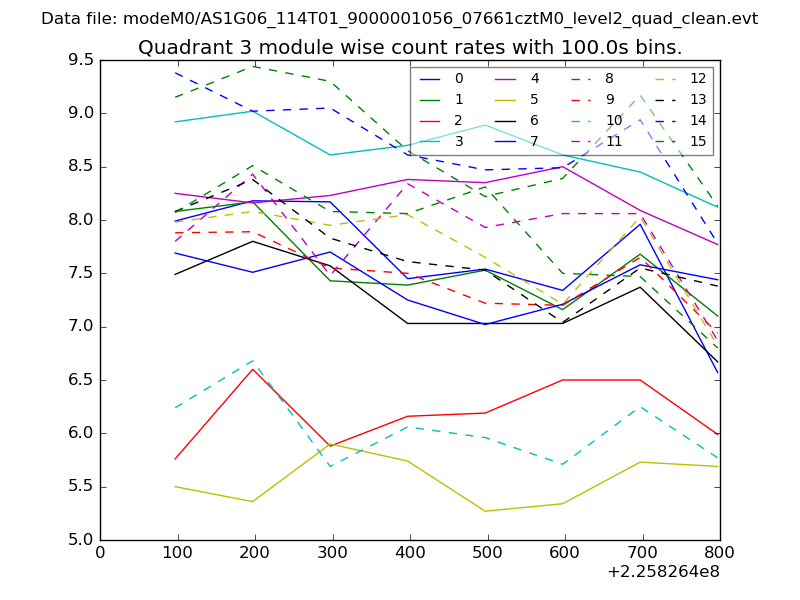
| Module-wise count rates for Quadrant A Data is divided into 100 sec bins |
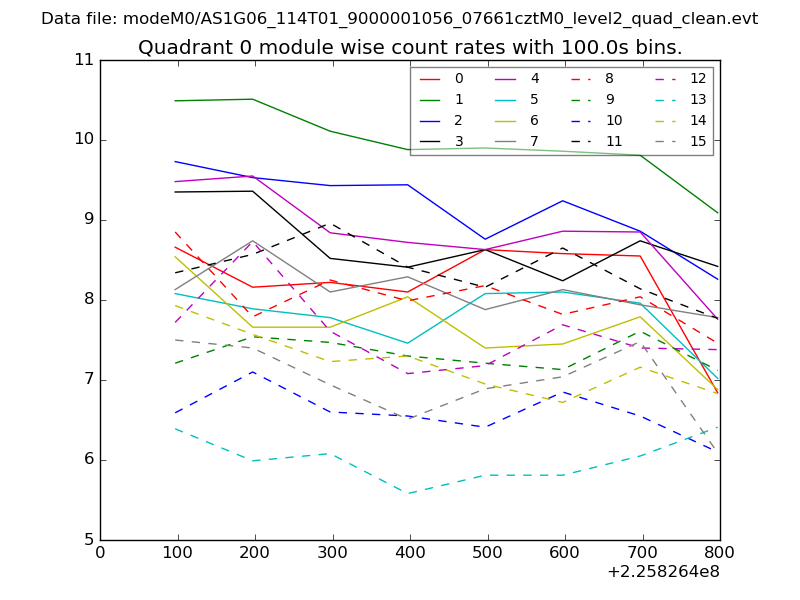 |
 |
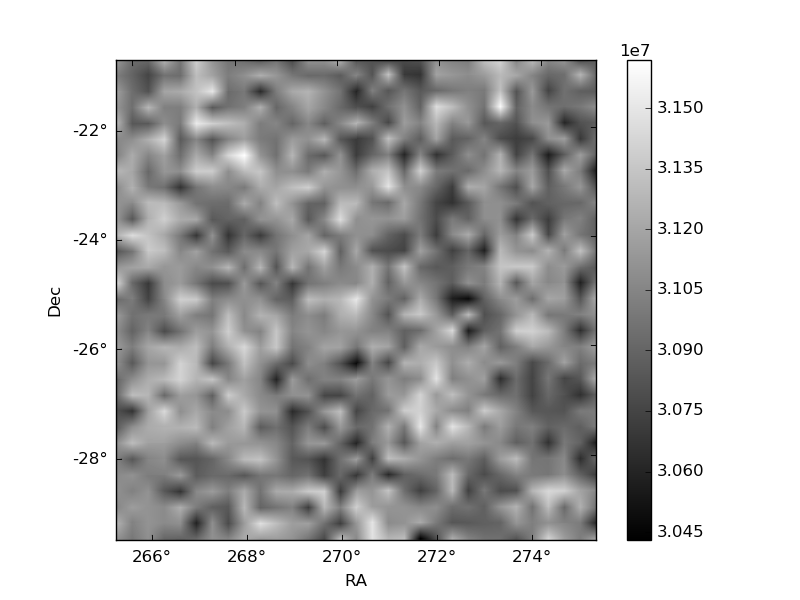
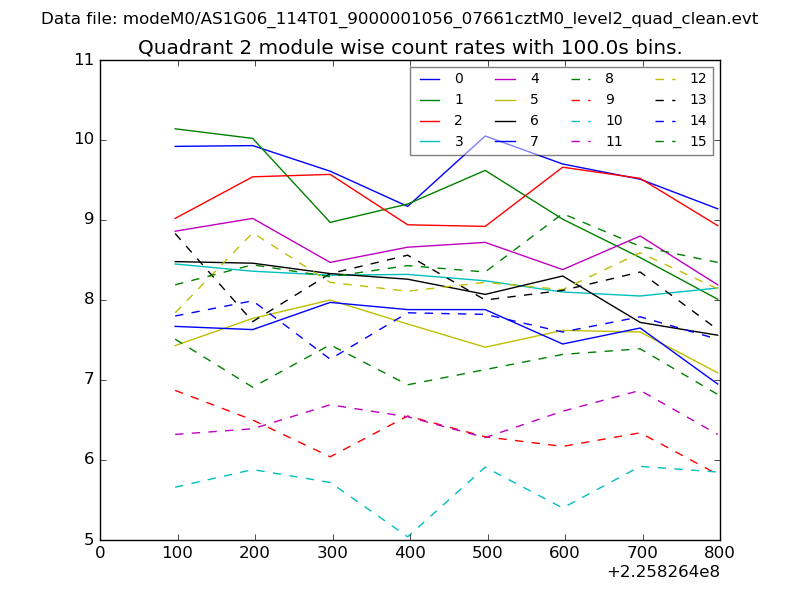
| Module-wise count rates for Quadrant B Data is divided into 100 sec bins |
 |
 |
| Module-wise count rates for Quadrant C Data is divided into 100 sec bins |
 |
 |
| Module-wise count rates for Quadrant D Data is divided into 100 sec bins |
 |
 |
| Parameter | Plot |
|---|---|
| CZT HV Monitor | 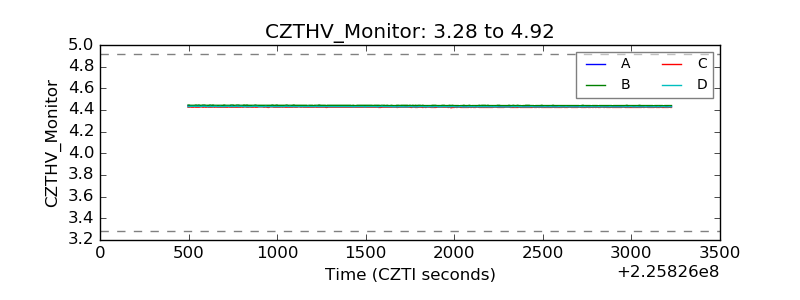 |
| D_VDD | 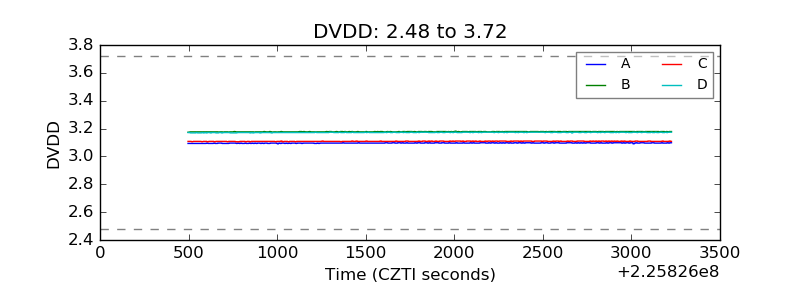 |
| Temperature 1 | 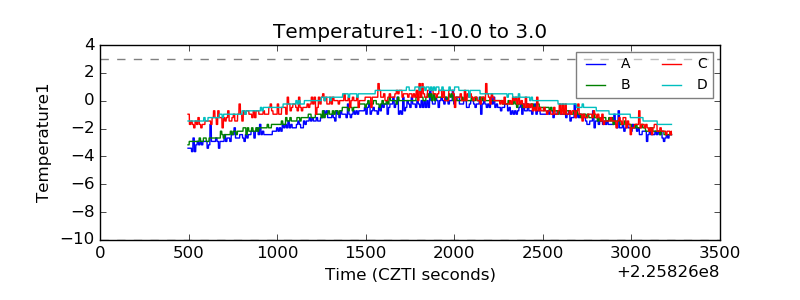 |
| Veto HV Monitor | 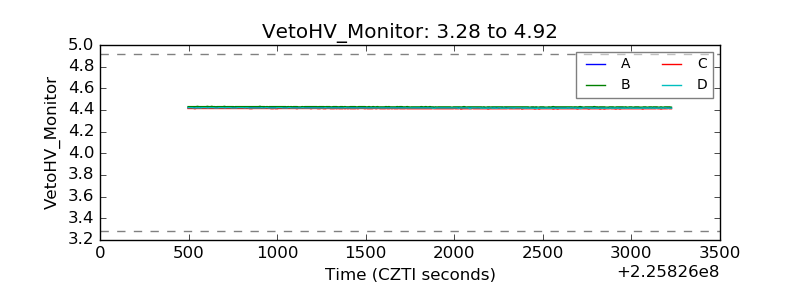 |
| Veto LLD | 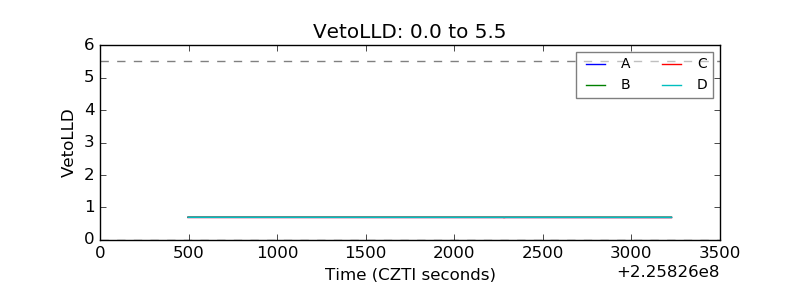 |
| Alpha Counter | 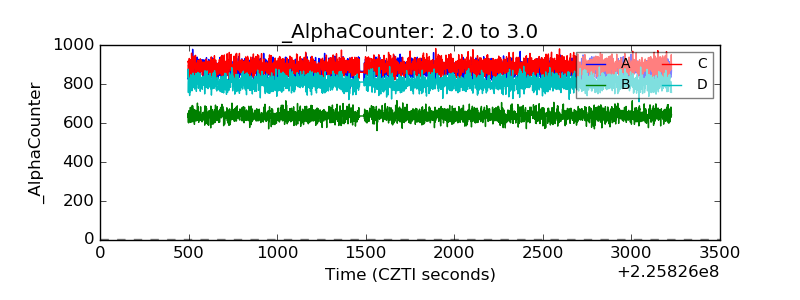 |
| _CPM_Rate | 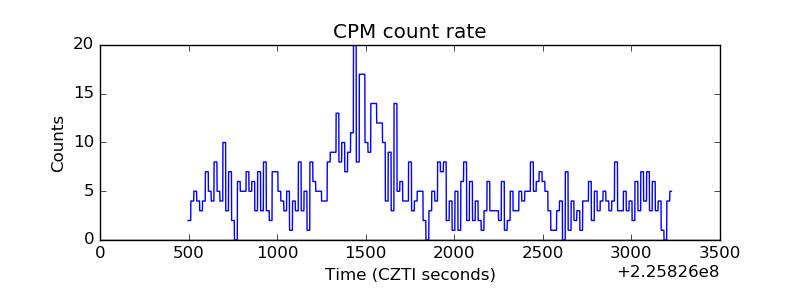 |
| CZT Counter |  |
| +2.5 Volts monitor |  |
| +5 Volts monitor |  |
| _ROLL_ROT | 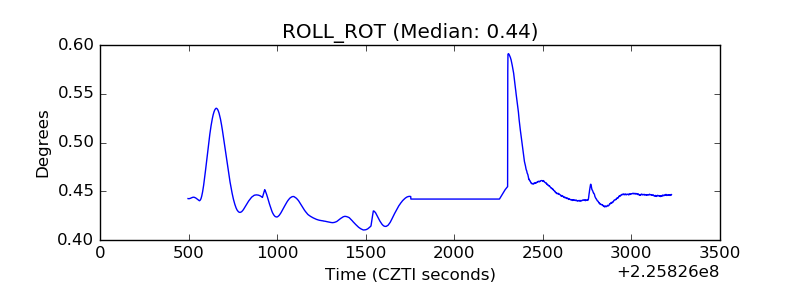 |
| _Roll_DEC | 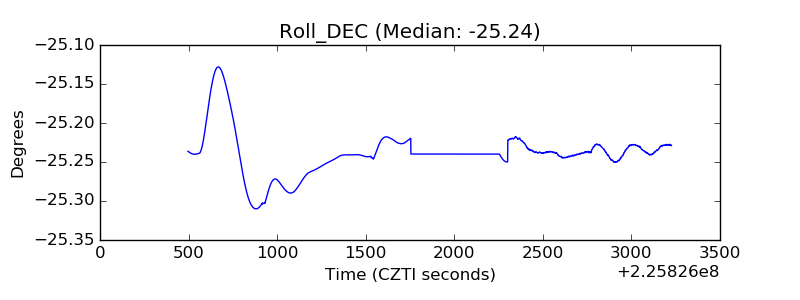 |
| _Roll_RA | 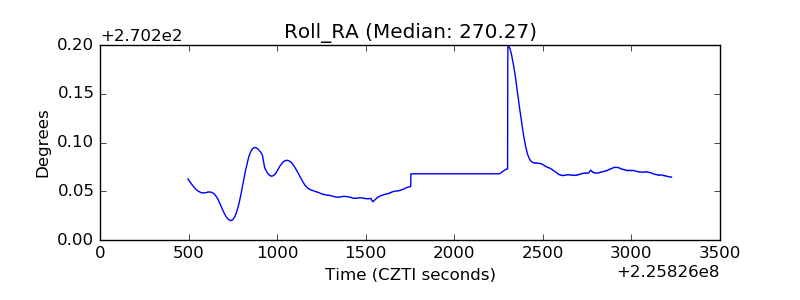 |
| Veto Counter | 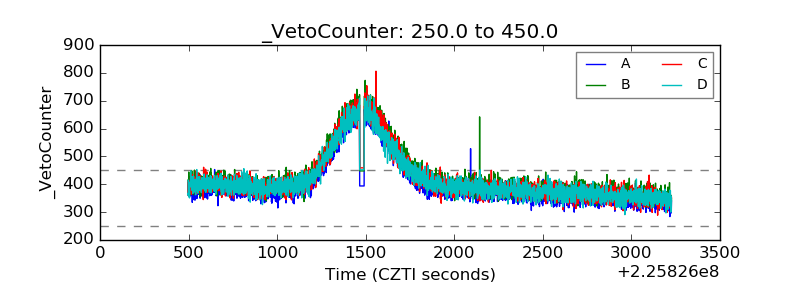 |