| Param | Original file | Final file |
|---|---|---|
| Filename | modeM0/AS1G06_114T01_9000001056_07662cztM0_level2.evt | modeM0/AS1G06_114T01_9000001056_07662cztM0_level2_quad_clean.evt |
| Size (bytes) | 499,458,240 | 77,915,520 |
| Size | 476.3 MB | 74.3 MB |
| Events in quadrant A | 3,344,306 | 471,265 |
| Events in quadrant B | 3,554,929 | 471,217 |
| Events in quadrant C | 3,353,468 | 469,051 |
| Events in quadrant D | 4,385,075 | 447,104 |
| Mode SS | |||
|---|---|---|---|
| Quadrant | BADHDUFLAG | Total packets | Discarded packets |
| A | 0 | 144 | 0 |
| B | 0 | 144 | 0 |
| C | 0 | 144 | 0 |
| D | 0 | 144 | 0 |
| Mode M9 | |||
|---|---|---|---|
| Quadrant | BADHDUFLAG | Total packets | Discarded packets |
| A | 0 | 3 | 0 |
| B | 0 | 3 | 0 |
| C | 0 | 3 | 0 |
| D | 0 | 3 | 0 |
| Mode M0 | |||
|---|---|---|---|
| Quadrant | BADHDUFLAG | Total packets | Discarded packets |
| A | 0 | 14783 | 2 |
| B | 0 | 15188 | 1 |
| C | 0 | 14879 | 1 |
| D | 0 | 17869 | 1 |
| Quadrant | Total seconds | Saturated seconds | Saturation percentage |
|---|---|---|---|
| A | 7196 | 61 | 0.847693% |
| B | 7196 | 88 | 1.222902% |
| C | 7196 | 32 | 0.444691% |
| D | 7196 | 240 | 3.335186% |
Noise dominated data is calculated using 1-second bins in cleaned event files. If a bin has >2000 counts, and if more than 50% of those come from <1% of pixels, then it is considered to be noise-dominated and hence unusable.
| Quadrant | # 1 sec bins | Bins with >0 counts | Bins with >2000 counts | High rate bins dominated by noise | Noise dominated (total time) | Noise dominated (detector-on time) | Marked lightcurve |
|---|---|---|---|---|---|---|---|
| A | 7486 | 7197 | 0 | 0 | 0.00% | 0.00% | 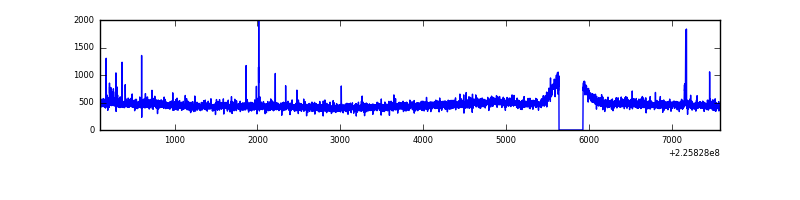 |
| B | 7486 | 7197 | 5 | 5 | 0.07% | 0.07% | 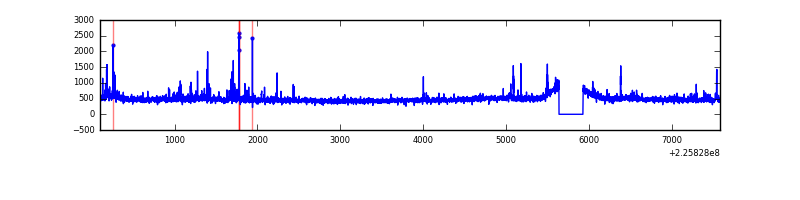 |
| C | 7486 | 7197 | 1 | 1 | 0.01% | 0.01% | 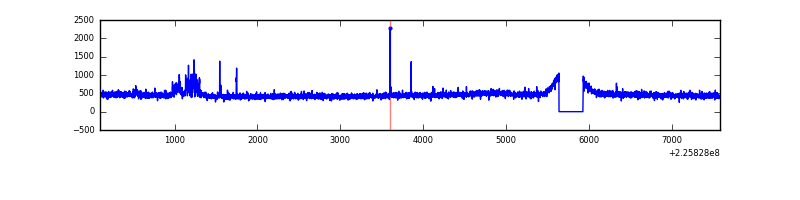 |
| D | 7486 | 7197 | 135 | 135 | 1.80% | 1.88% | 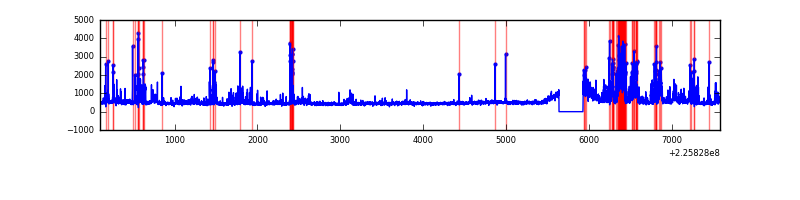 |
Top three noisy pixels from each quadrant. If the there are fewer than three noisy pixels in the level2.evt file, extra rows are filled as -1
| Pixel properties | Quadrant properties | ||||||
|---|---|---|---|---|---|---|---|
| Quadrant | DetID | PixID | Counts | Sigma | Mean | Median | Sigma |
| A | 13 | 251 | 19159 | 104.33 | 856 | 836 | 175.6 |
| A | 15 | 174 | 18230 | 99.04 | 856 | 836 | 175.6 |
| A | 0 | 226 | 8416 | 43.16 | 856 | 836 | 175.6 |
| B | 0 | 229 | 60591 | 363.4 | 859 | 840 | 164.4 |
| B | 10 | 245 | 36484 | 216.78 | 859 | 840 | 164.4 |
| B | 0 | 230 | 24032 | 141.05 | 859 | 840 | 164.4 |
| C | 8 | 208 | 88483 | 450.73 | 829 | 834 | 194.5 |
| C | 9 | 68 | 14907 | 72.37 | 829 | 834 | 194.5 |
| C | 12 | 4 | 6530 | 29.29 | 829 | 834 | 194.5 |
| D | 2 | 152 | 578067 | 2846.95 | 823 | 798 | 202.8 |
| D | 13 | 104 | 359906 | 1771.03 | 823 | 798 | 202.8 |
| D | 5 | 233 | 51049 | 247.83 | 823 | 798 | 202.8 |
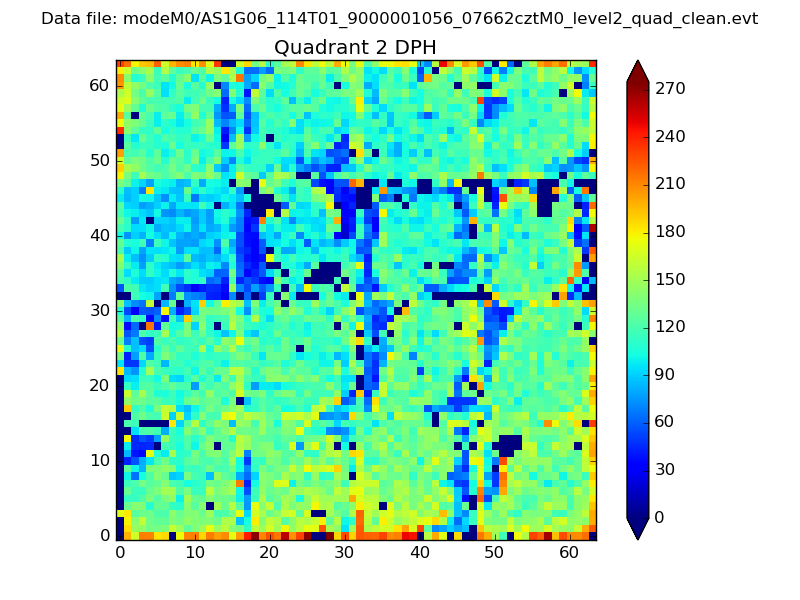
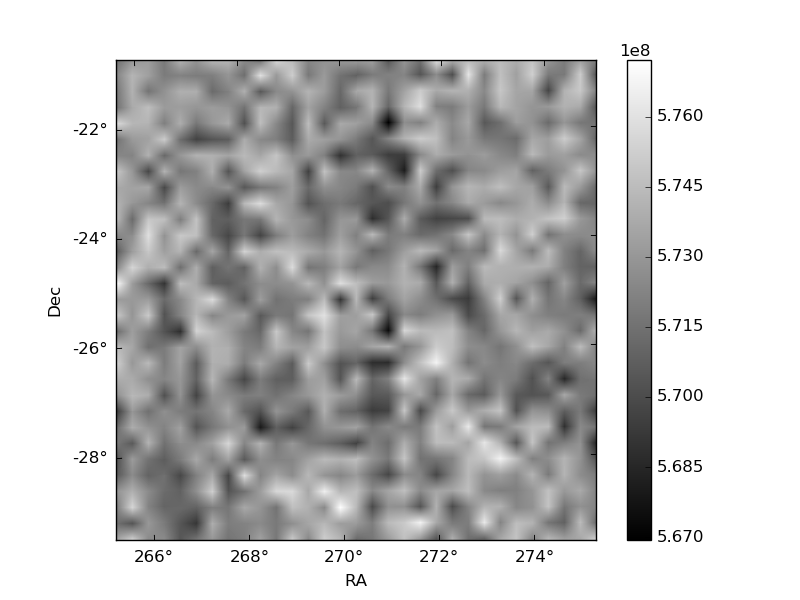
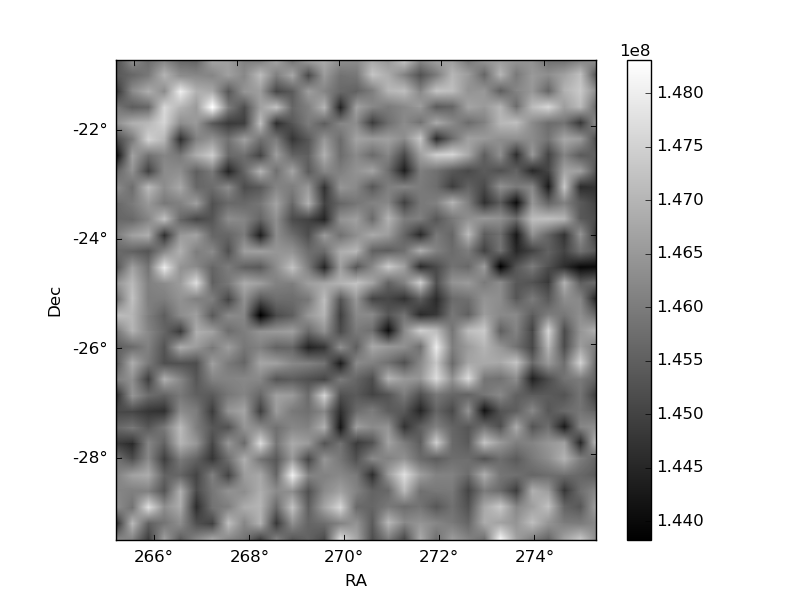
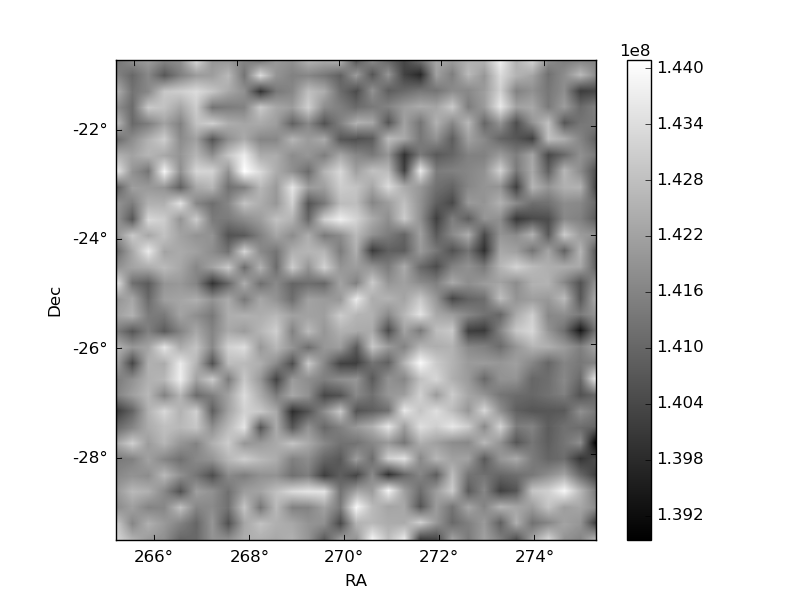
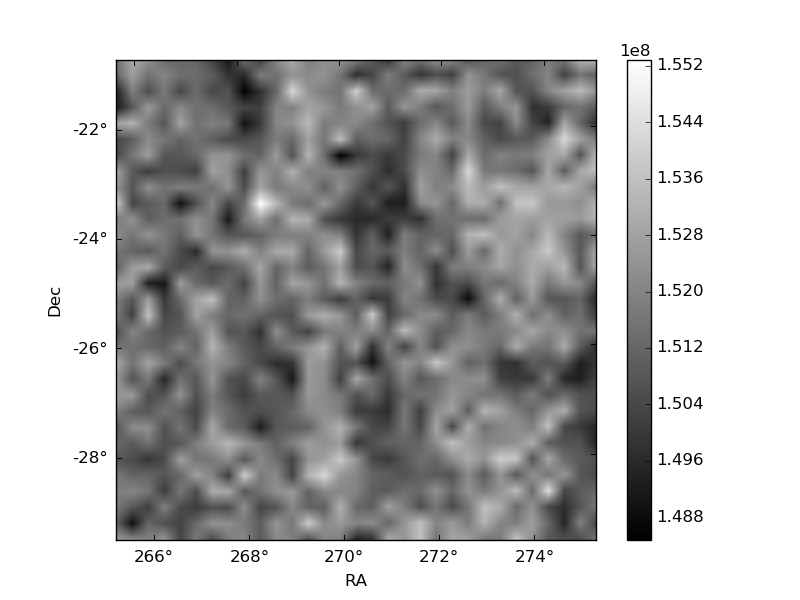
Histogram calculated using DETX and DETY for each event in the final _common_clean file
| Quadrant A | 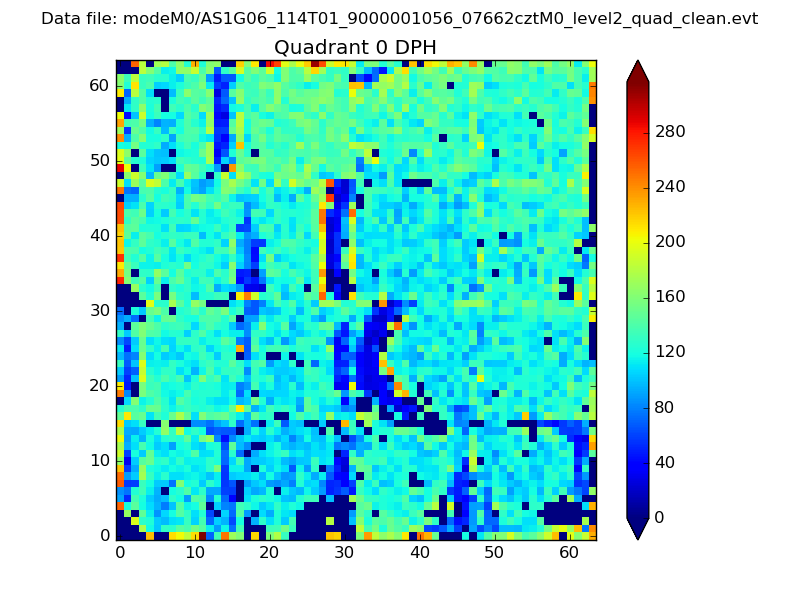 |
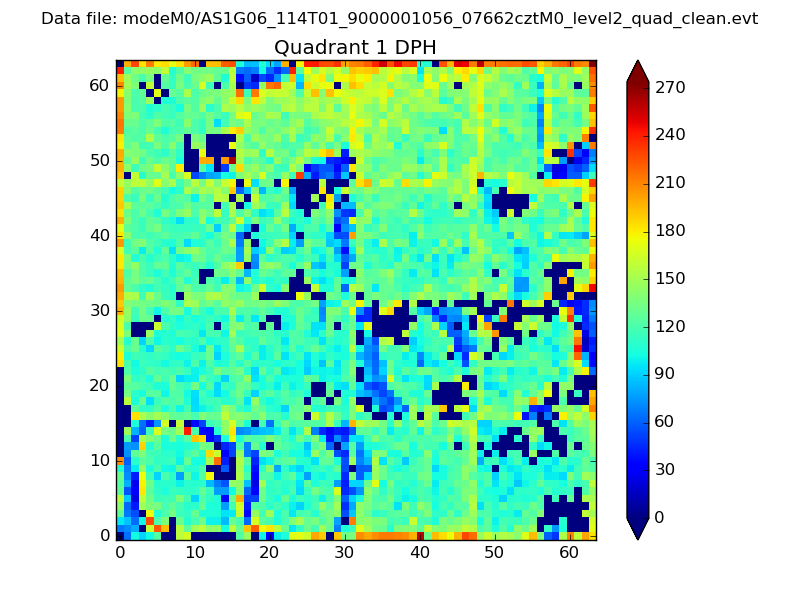 |
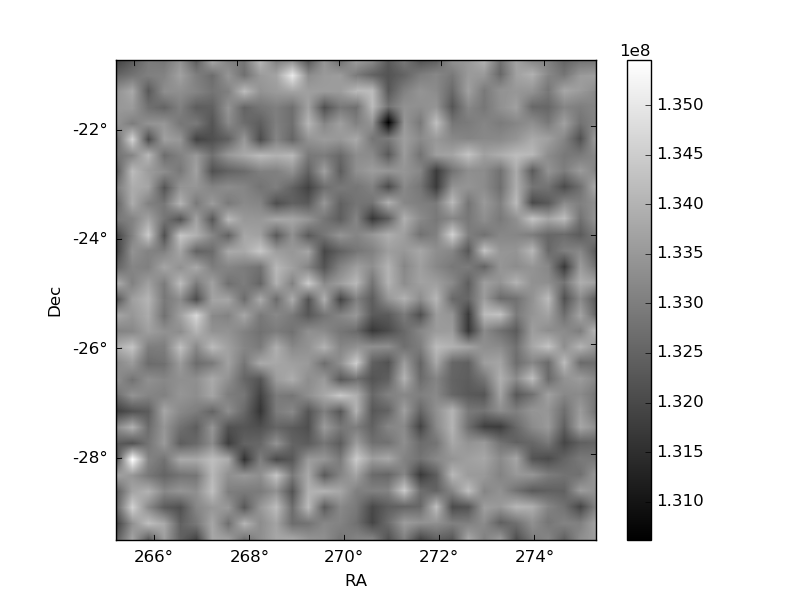
Quadrant B |
|---|---|---|---|
| Quadrant D | 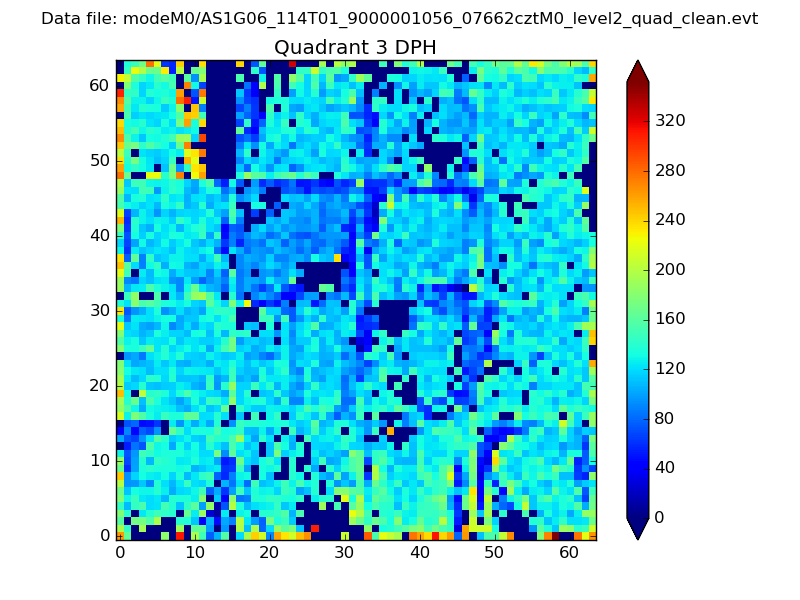 |
 |
Quadrant C |
| Plot type | Count rate plots | Images |
|---|---|---|
| Comparison with Poisson distribution Blue bars denote a histogram of data divided into 1 sec bins. Red curve is a Poisson curve with rate = median count rate of data. |
 |
 |
| Quadrant-wise count rates Data is divided into 100 sec bins |
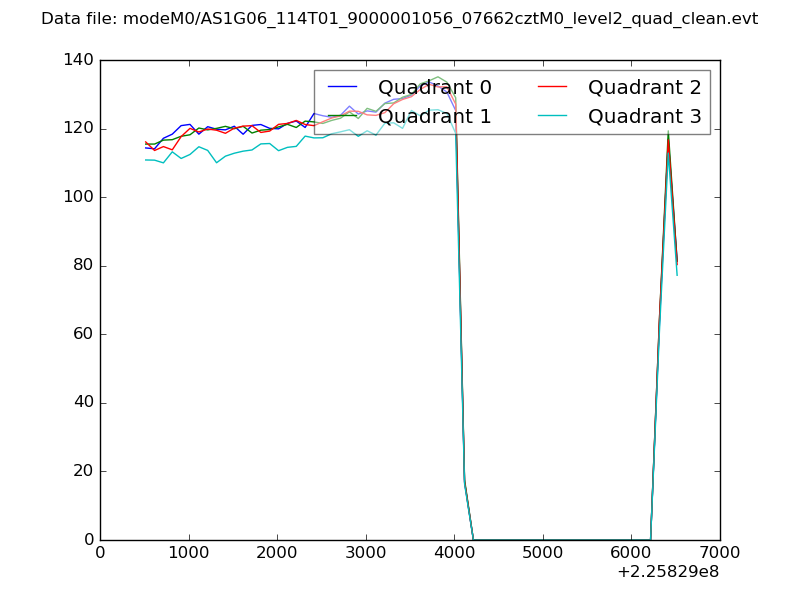 |
|
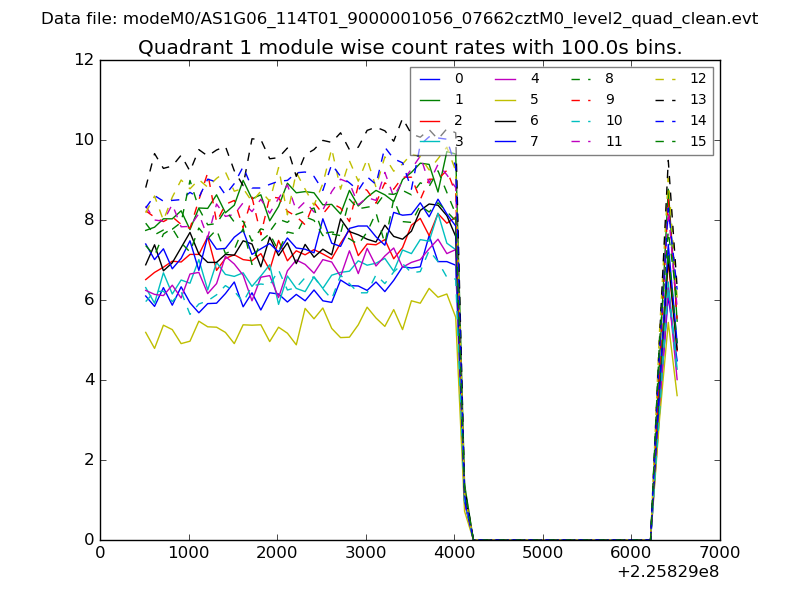
| Module-wise count rates for Quadrant A Data is divided into 100 sec bins |
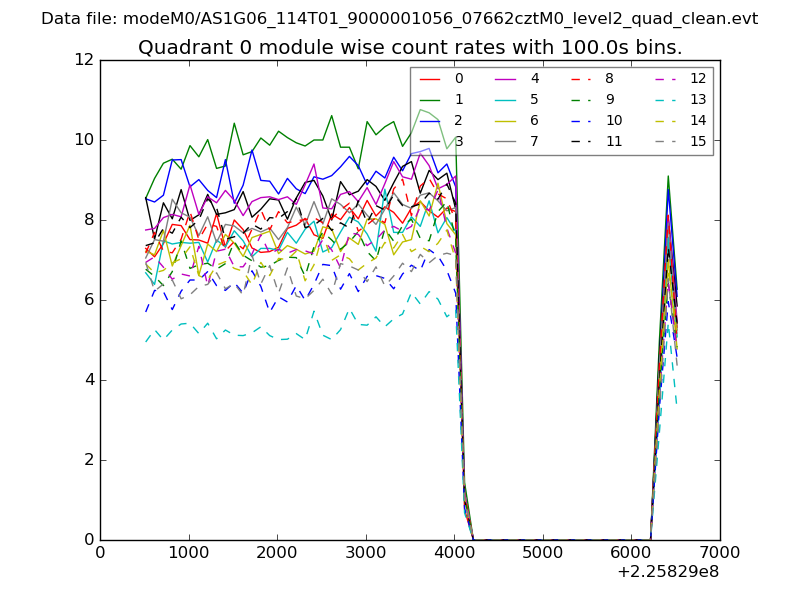 |
 |
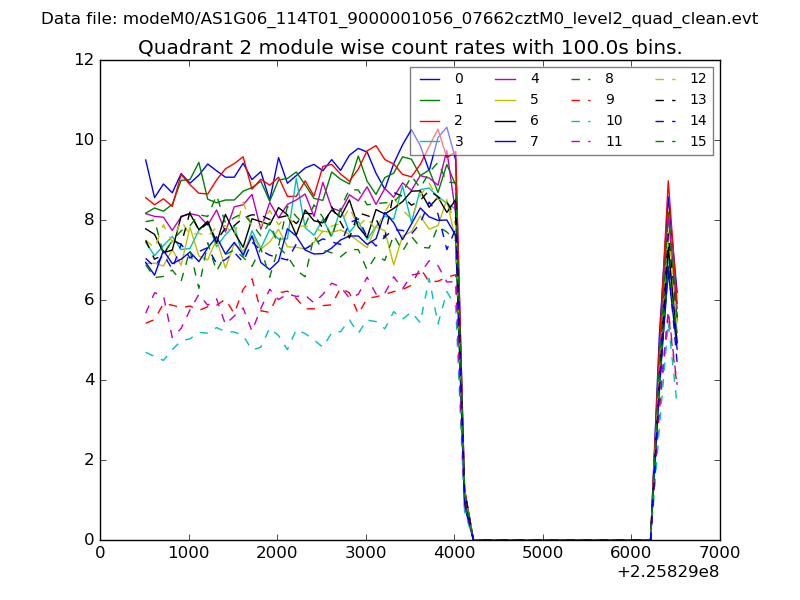
| Module-wise count rates for Quadrant B Data is divided into 100 sec bins |
 |
 |
| Module-wise count rates for Quadrant C Data is divided into 100 sec bins |
 |
 |
| Module-wise count rates for Quadrant D Data is divided into 100 sec bins |
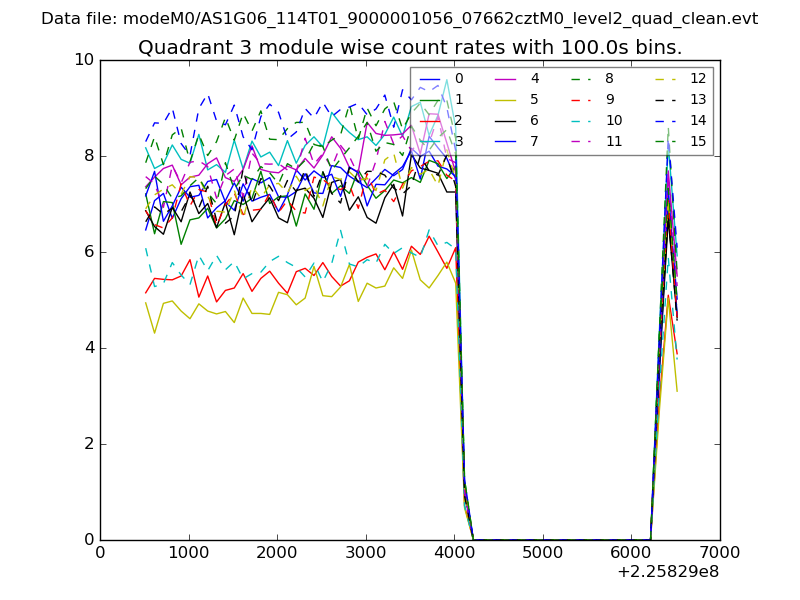 |
 |
| Parameter | Plot |
|---|---|
| CZT HV Monitor | 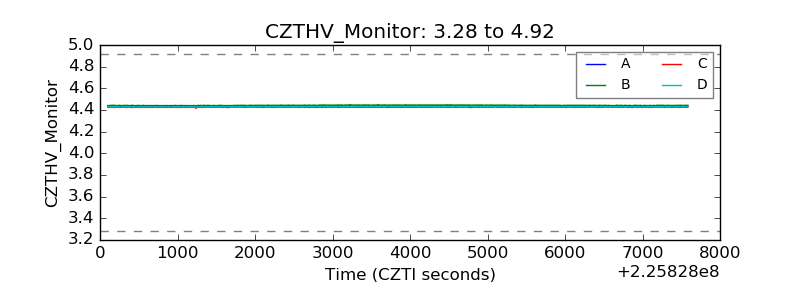 |
| D_VDD | 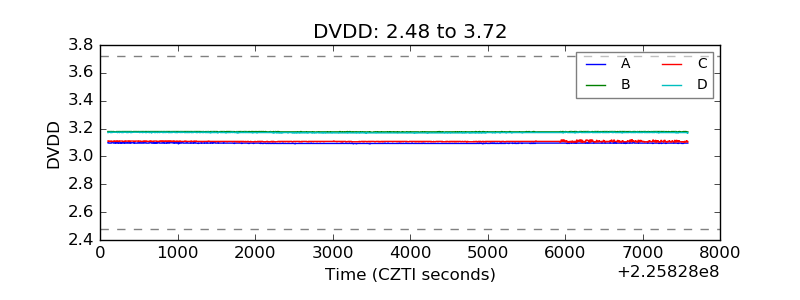 |
| Temperature 1 | 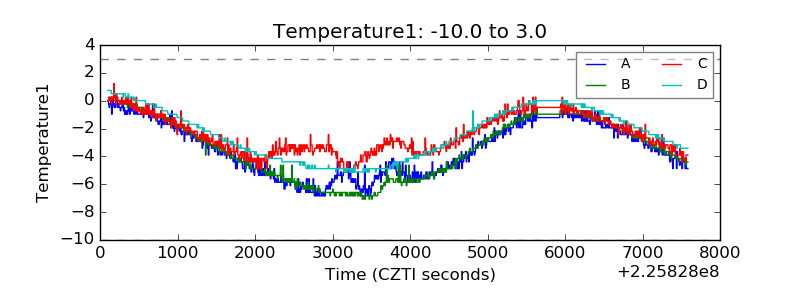 |
| Veto HV Monitor | 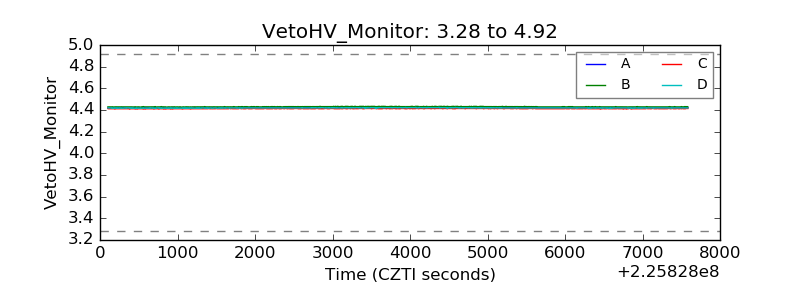 |
| Veto LLD | 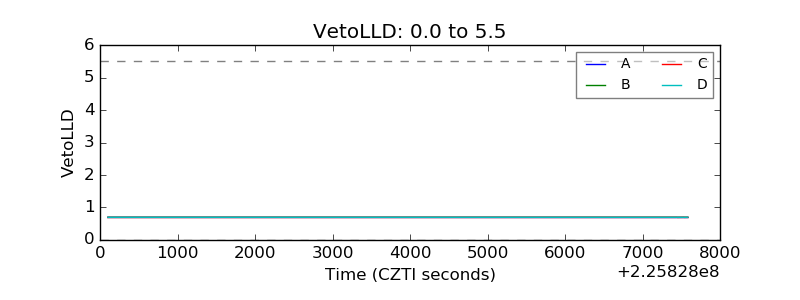 |
| Alpha Counter | 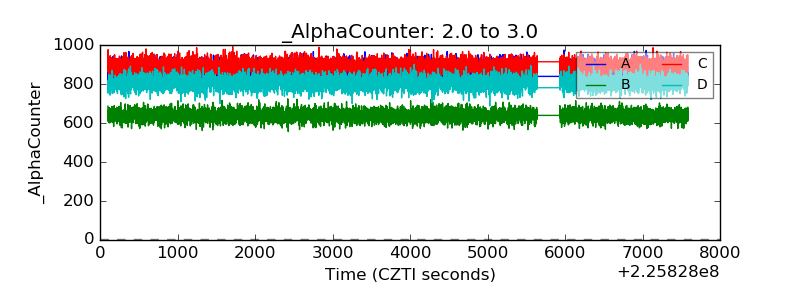 |
| _CPM_Rate | 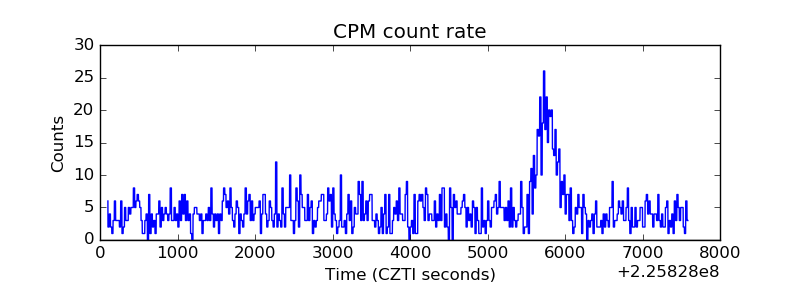 |
| CZT Counter | 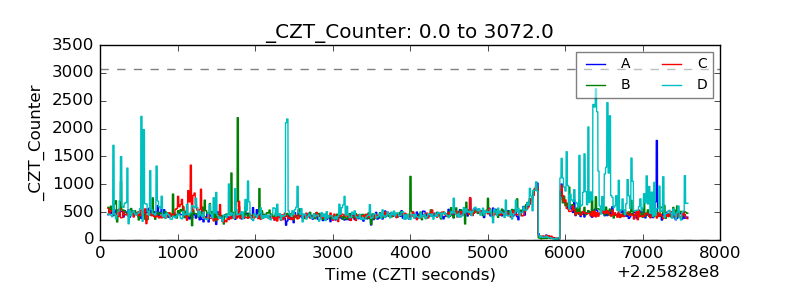 |
| +2.5 Volts monitor |  |
| +5 Volts monitor | 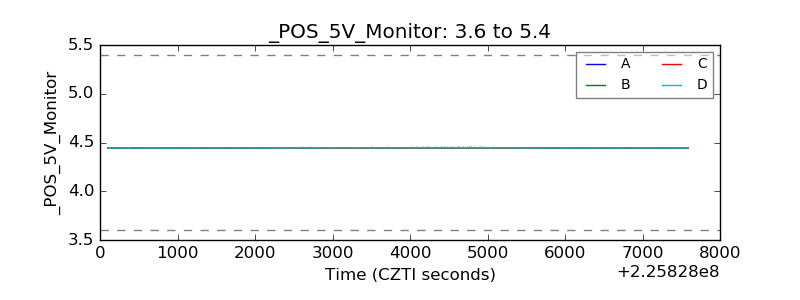 |
| _ROLL_ROT | 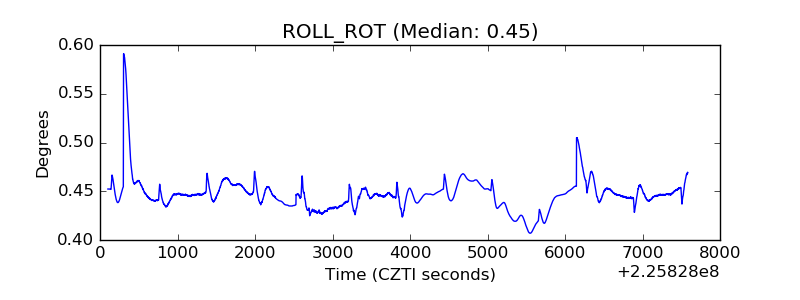 |
| _Roll_DEC | 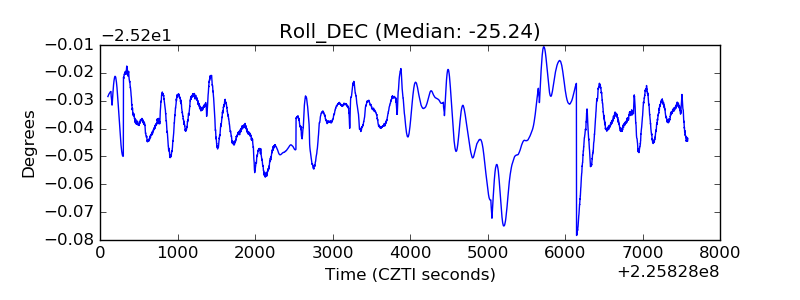 |
| _Roll_RA | 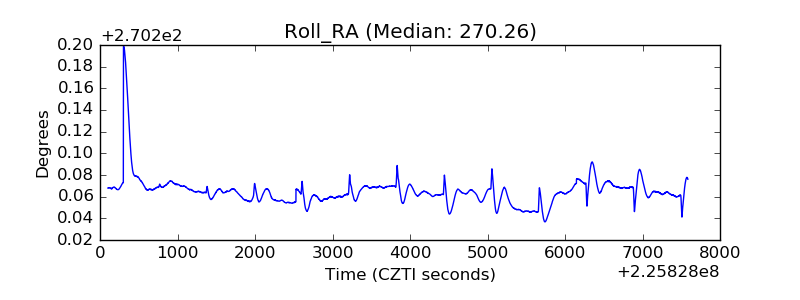 |
| Veto Counter | 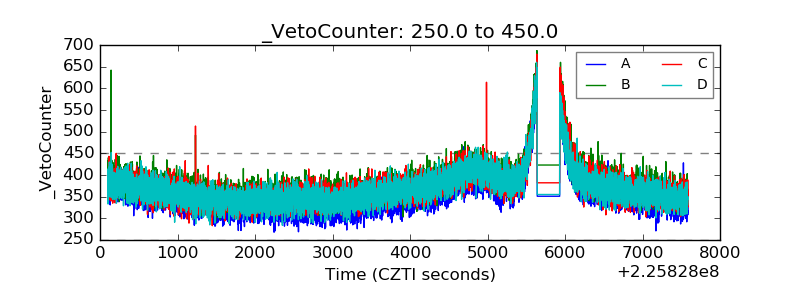 |