| Param | Original file | Final file |
|---|---|---|
| Filename | modeM0/AS1G06_114T01_9000001056_07664cztM0_level2.evt | modeM0/AS1G06_114T01_9000001056_07664cztM0_level2_quad_clean.evt |
| Size (bytes) | 232,911,360 | 35,386,560 |
| Size | 222.1 MB | 33.7 MB |
| Events in quadrant A | 1,458,243 | 213,517 |
| Events in quadrant B | 1,545,768 | 213,538 |
| Events in quadrant C | 1,440,845 | 212,635 |
| Events in quadrant D | 2,387,309 | 201,649 |
| Mode SS | |||
|---|---|---|---|
| Quadrant | BADHDUFLAG | Total packets | Discarded packets |
| A | 0 | 64 | 0 |
| B | 0 | 64 | 0 |
| C | 0 | 64 | 0 |
| D | 0 | 64 | 0 |
| Mode M9 | |||
|---|---|---|---|
| Quadrant | BADHDUFLAG | Total packets | Discarded packets |
| A | 0 | 1 | 0 |
| B | 0 | 1 | 0 |
| C | 0 | 1 | 0 |
| D | 0 | 2 | 0 |
| Mode M0 | |||
|---|---|---|---|
| Quadrant | BADHDUFLAG | Total packets | Discarded packets |
| A | 0 | 6636 | 2 |
| B | 0 | 6739 | 1 |
| C | 0 | 6577 | 1 |
| D | 0 | 9343 | 1 |
| Quadrant | Total seconds | Saturated seconds | Saturation percentage |
|---|---|---|---|
| A | 3234 | 18 | 0.556586% |
| B | 3234 | 23 | 0.711194% |
| C | 3234 | 13 | 0.401979% |
| D | 3234 | 193 | 5.967842% |
Noise dominated data is calculated using 1-second bins in cleaned event files. If a bin has >2000 counts, and if more than 50% of those come from <1% of pixels, then it is considered to be noise-dominated and hence unusable.
| Quadrant | # 1 sec bins | Bins with >0 counts | Bins with >2000 counts | High rate bins dominated by noise | Noise dominated (total time) | Noise dominated (detector-on time) | Marked lightcurve |
|---|---|---|---|---|---|---|---|
| A | 3234 | 3234 | 0 | 0 | 0.00% | 0.00% |  |
| B | 3234 | 3234 | 1 | 1 | 0.03% | 0.03% |  |
| C | 3234 | 3234 | 0 | 0 | 0.00% | 0.00% |  |
| D | 3234 | 3234 | 115 | 115 | 3.56% | 3.56% | 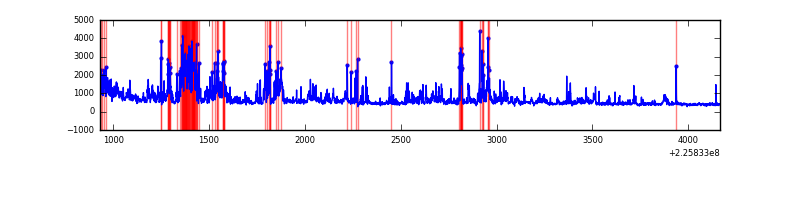 |
Top three noisy pixels from each quadrant. If the there are fewer than three noisy pixels in the level2.evt file, extra rows are filled as -1
| Pixel properties | Quadrant properties | ||||||
|---|---|---|---|---|---|---|---|
| Quadrant | DetID | PixID | Counts | Sigma | Mean | Median | Sigma |
| A | 15 | 174 | 16196 | 201.02 | 374 | 366 | 78.8 |
| A | 0 | 226 | 3621 | 41.33 | 374 | 366 | 78.8 |
| A | 12 | 194 | 3327 | 37.6 | 374 | 366 | 78.8 |
| B | 0 | 229 | 25236 | 336.2 | 377 | 368 | 74.0 |
| B | 0 | 230 | 19568 | 259.57 | 377 | 368 | 74.0 |
| B | 4 | 80 | 11544 | 151.09 | 377 | 368 | 74.0 |
| C | 8 | 128 | 6420 | 69.58 | 363 | 366 | 87.0 |
| C | 8 | 112 | 3755 | 38.95 | 363 | 366 | 87.0 |
| C | 13 | 61 | 2877 | 28.86 | 363 | 366 | 87.0 |
| D | 2 | 152 | 761975 | 8601.93 | 352 | 340 | 88.5 |
| D | 13 | 104 | 119531 | 1346.15 | 352 | 340 | 88.5 |
| D | 12 | 233 | 44385 | 497.45 | 352 | 340 | 88.5 |
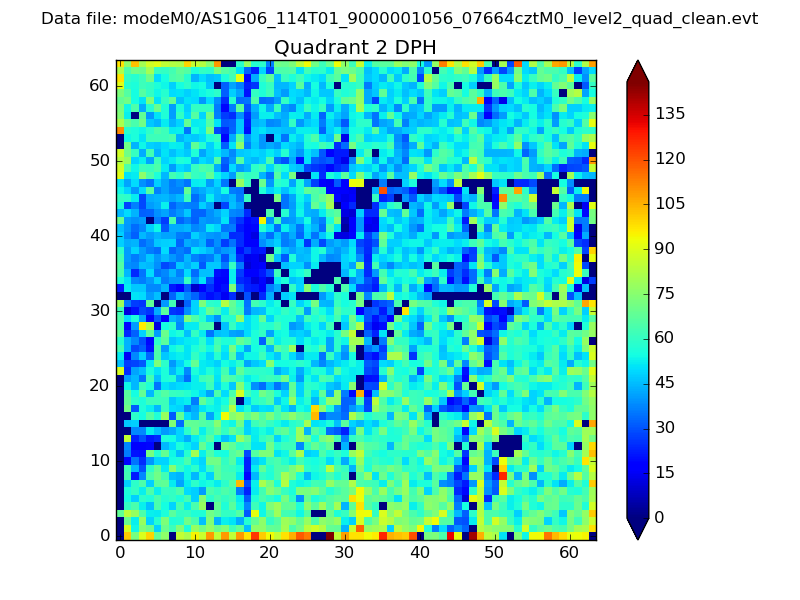
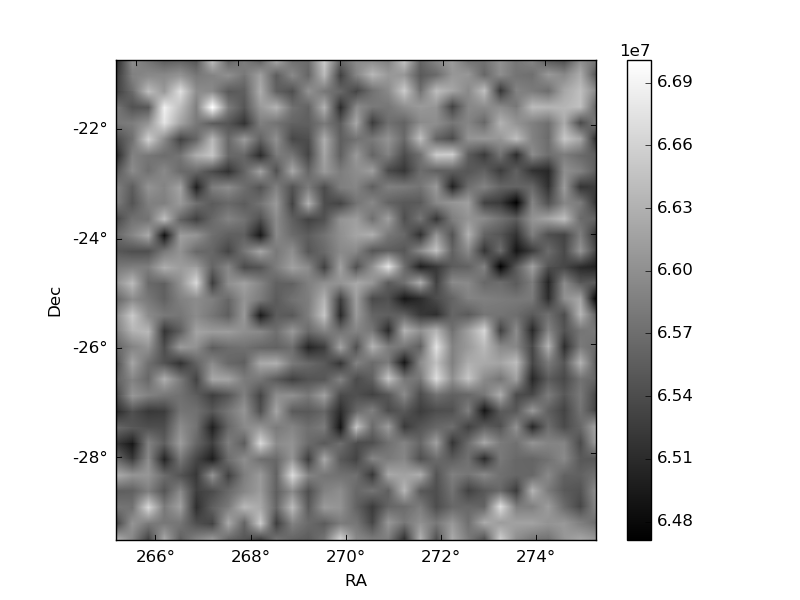
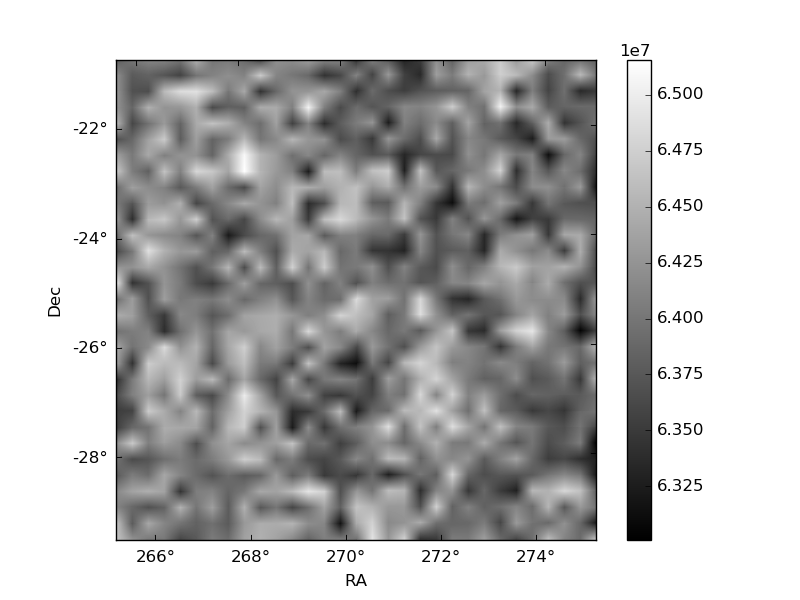
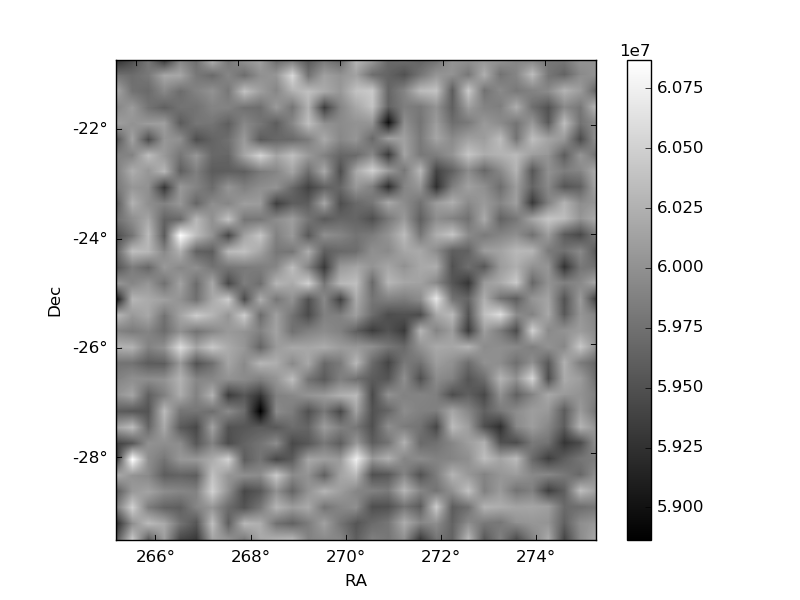
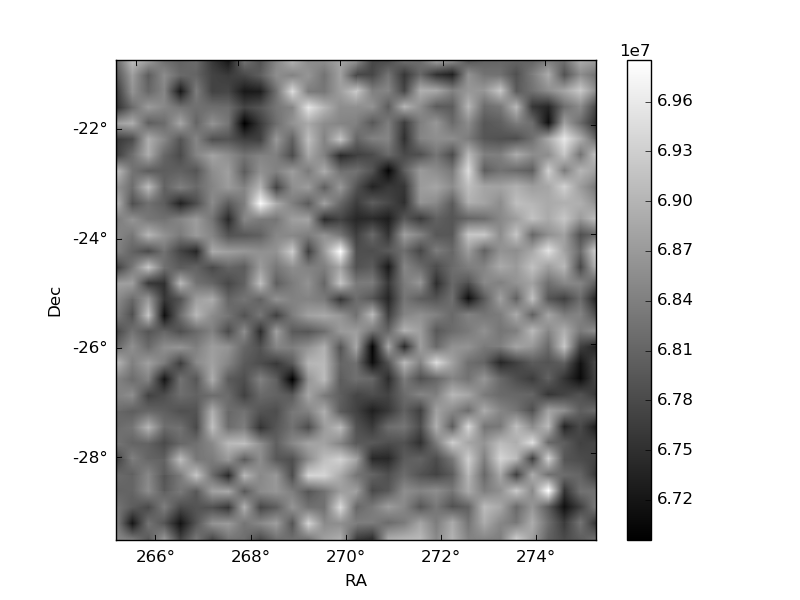
Histogram calculated using DETX and DETY for each event in the final _common_clean file
| Quadrant A | 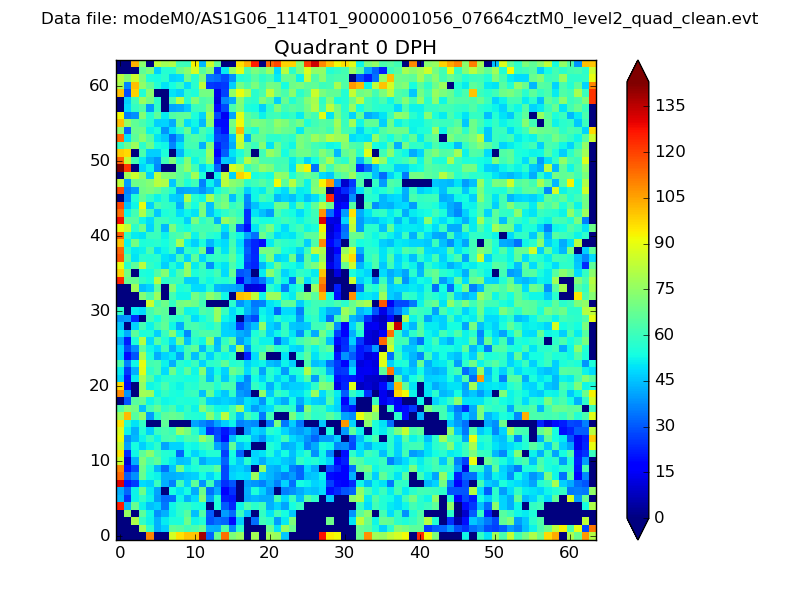 |
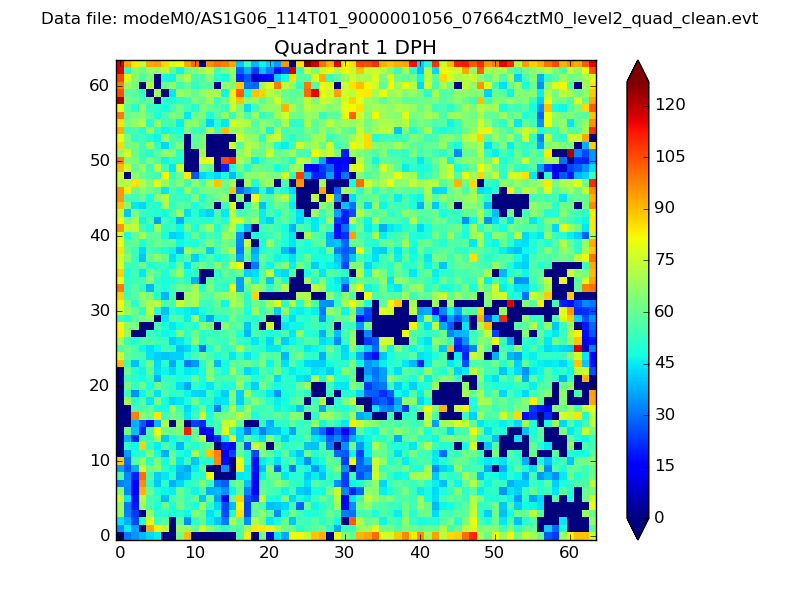 |
Quadrant B |
|---|---|---|---|
| Quadrant D | 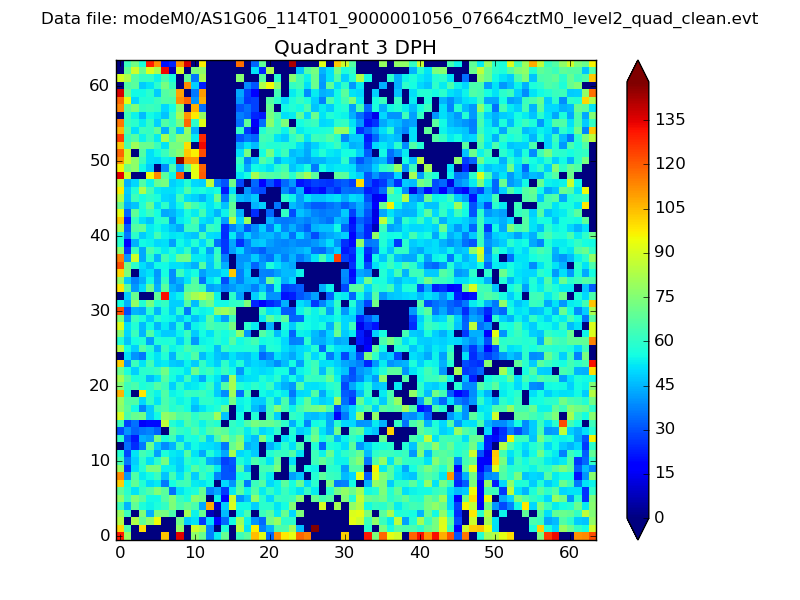 |
 |
Quadrant C |
| Plot type | Count rate plots | Images |
|---|---|---|
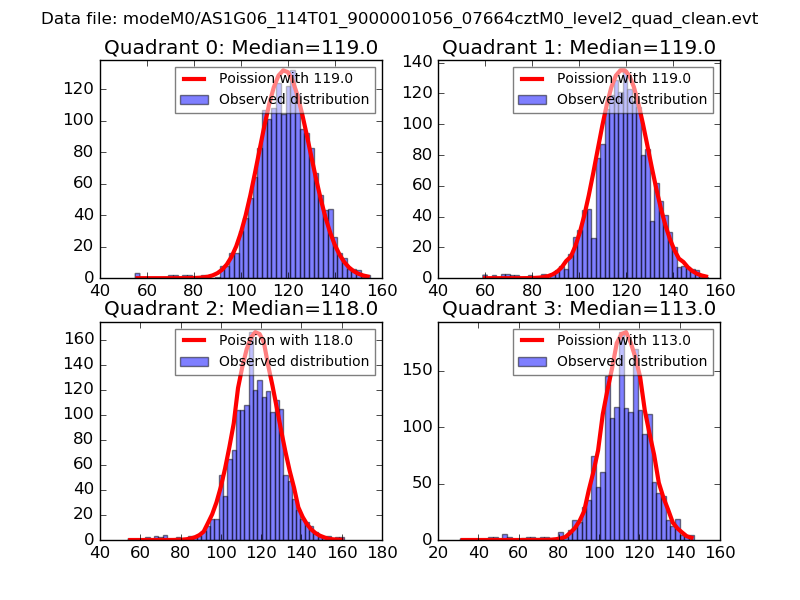
| Comparison with Poisson distribution Blue bars denote a histogram of data divided into 1 sec bins. Red curve is a Poisson curve with rate = median count rate of data. |
 |
 |
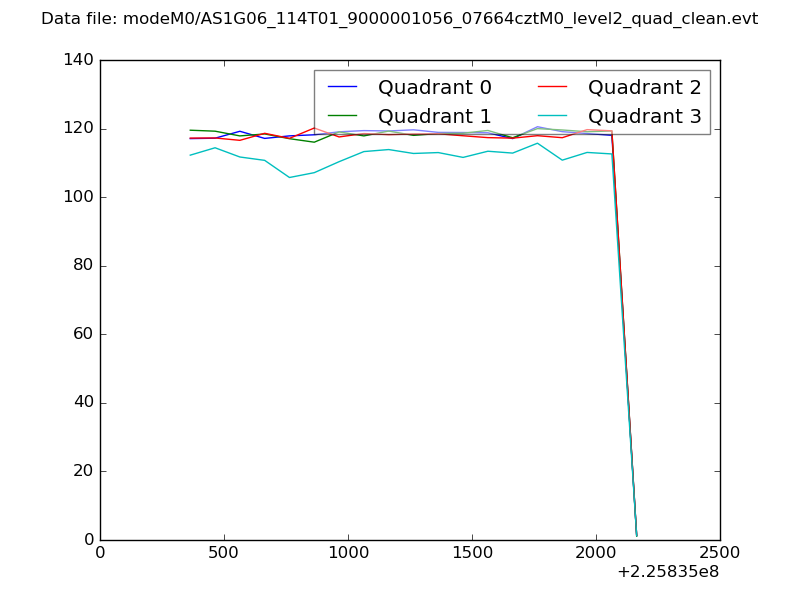
| Quadrant-wise count rates Data is divided into 100 sec bins |
 |
|
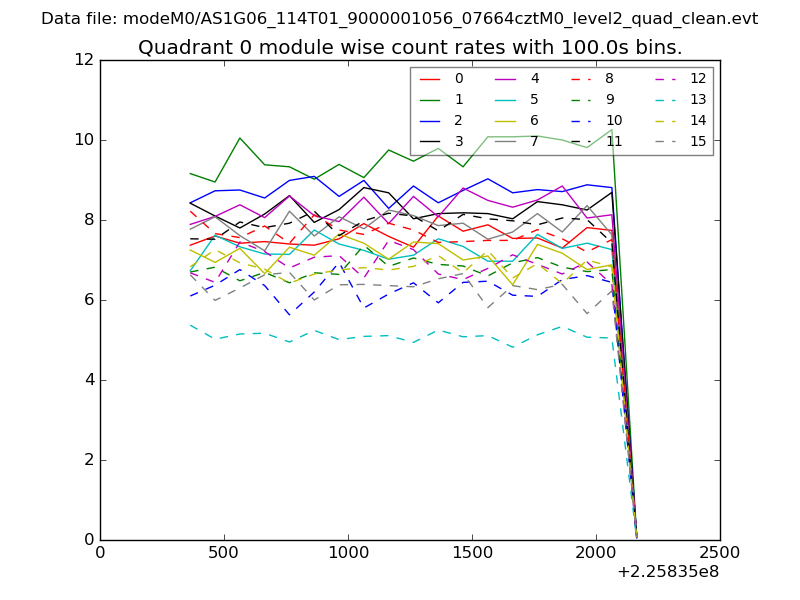
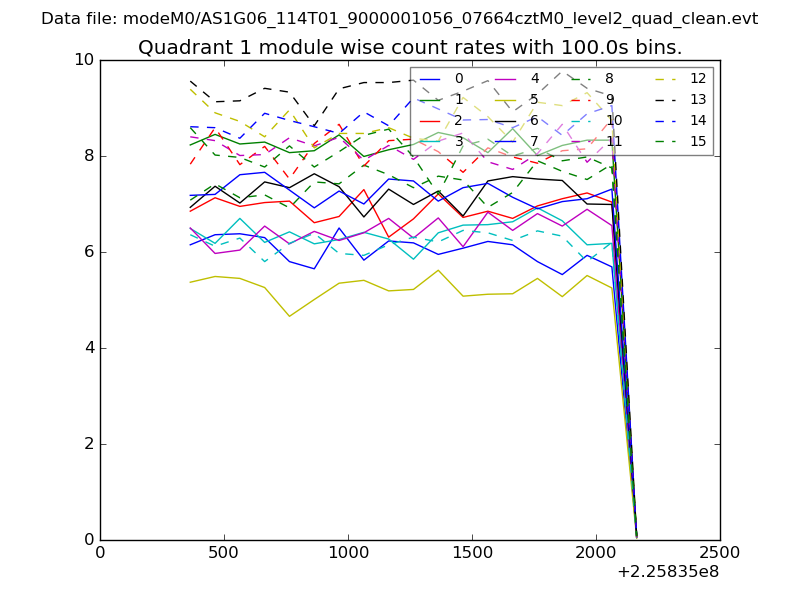
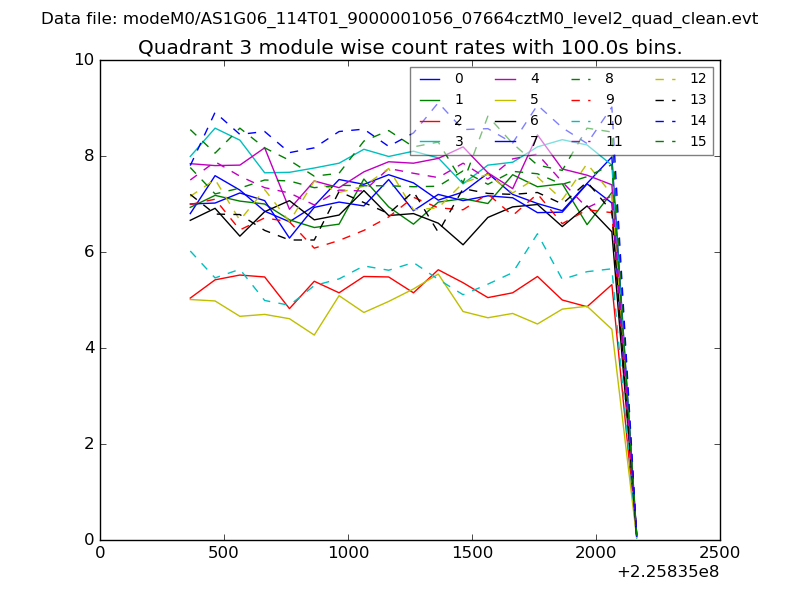
| Module-wise count rates for Quadrant A Data is divided into 100 sec bins |
 |
 |
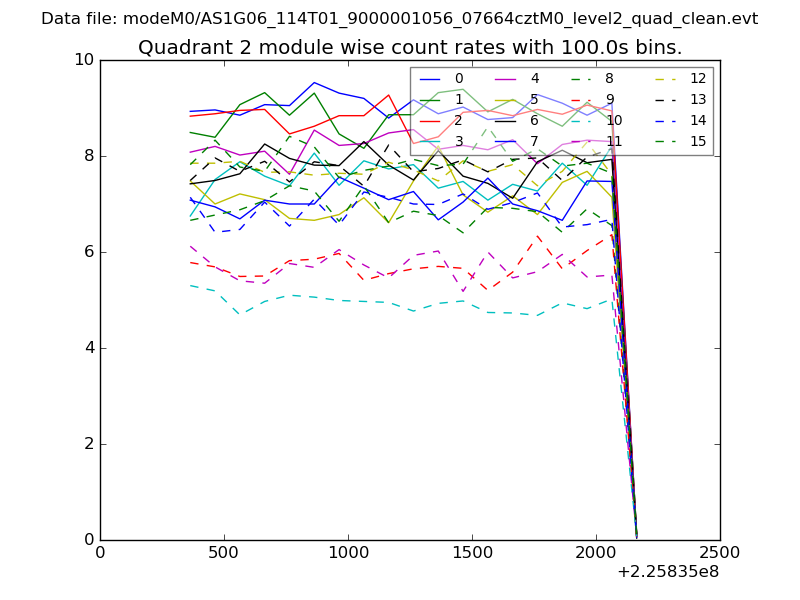
| Module-wise count rates for Quadrant B Data is divided into 100 sec bins |
 |
 |
| Module-wise count rates for Quadrant C Data is divided into 100 sec bins |
 |
 |
| Module-wise count rates for Quadrant D Data is divided into 100 sec bins |
 |
 |
| Parameter | Plot |
|---|---|
| CZT HV Monitor | 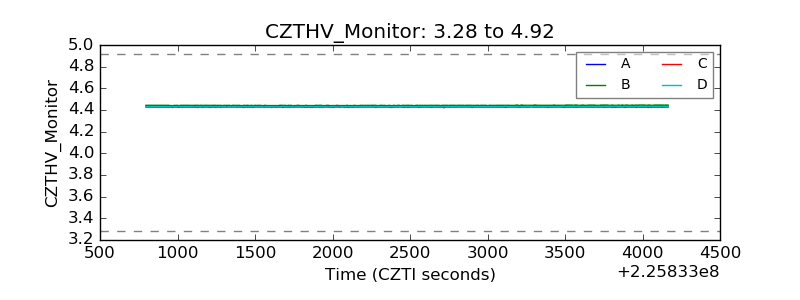 |
| D_VDD | 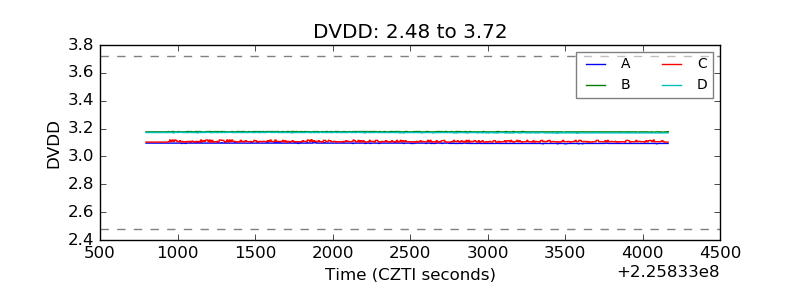 |
| Temperature 1 | 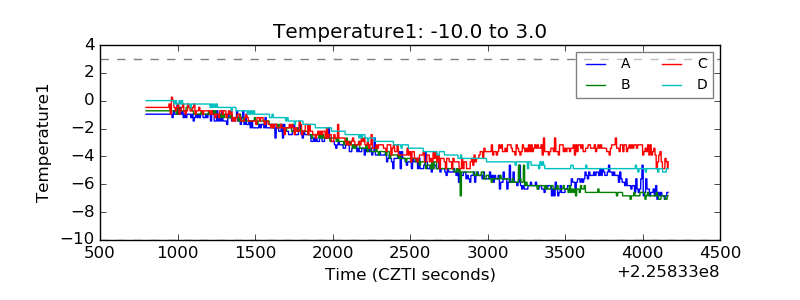 |
| Veto HV Monitor | 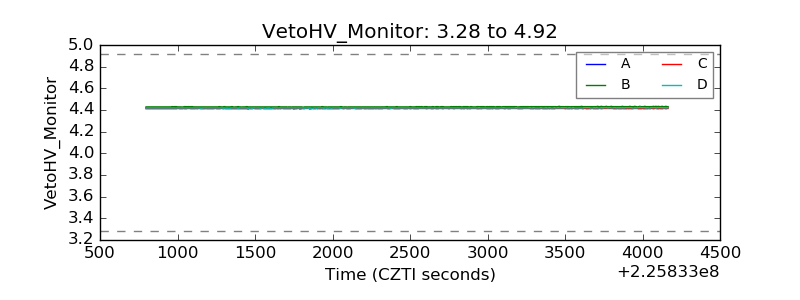 |
| Veto LLD | 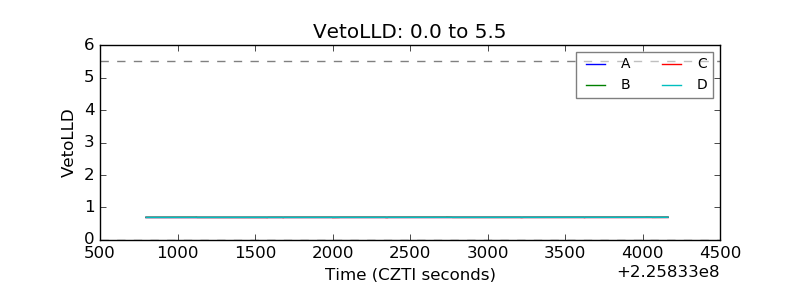 |
| Alpha Counter | 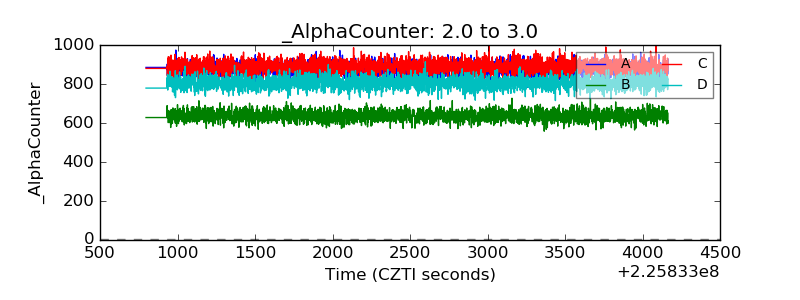 |
| _CPM_Rate | 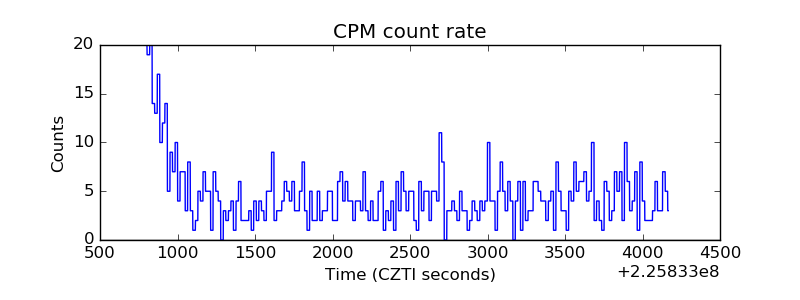 |
| CZT Counter | 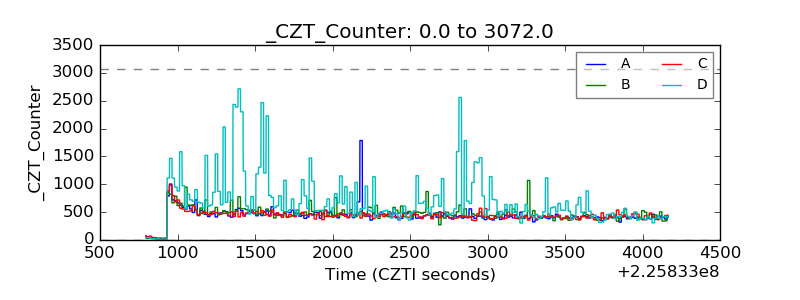 |
| +2.5 Volts monitor |  |
| +5 Volts monitor |  |
| _ROLL_ROT | 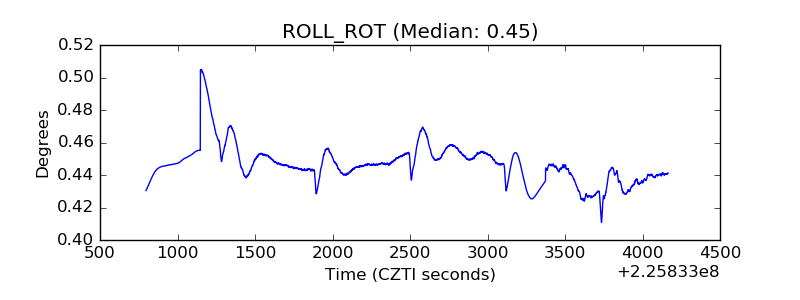 |
| _Roll_DEC | 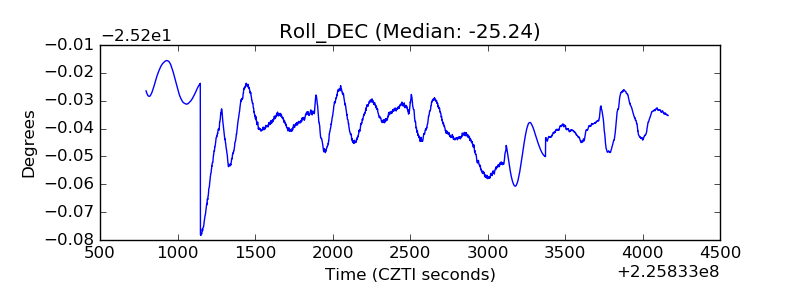 |
| _Roll_RA | 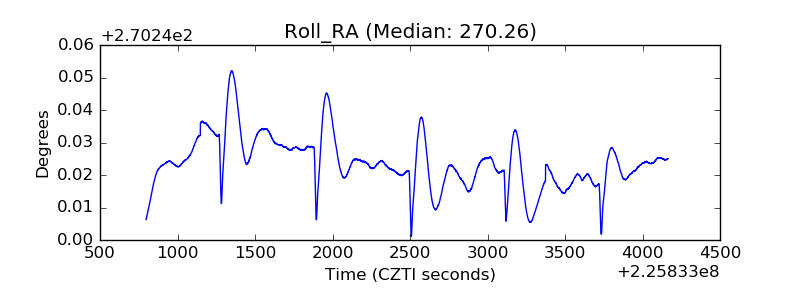 |
| Veto Counter | 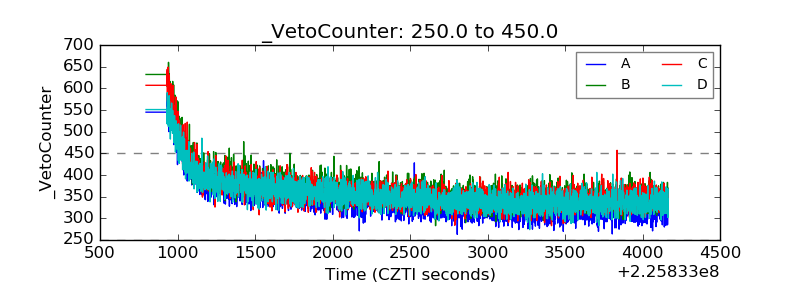 |