| Param | Original file | Final file |
|---|---|---|
| Filename | modeM0/AS1G06_114T01_9000001056_07666cztM0_level2.evt | modeM0/AS1G06_114T01_9000001056_07666cztM0_level2_quad_clean.evt |
| Size (bytes) | 589,322,880 | 112,438,080 |
| Size | 562.0 MB | 107.2 MB |
| Events in quadrant A | 4,070,119 | 704,132 |
| Events in quadrant B | 4,572,442 | 714,714 |
| Events in quadrant C | 4,230,405 | 709,158 |
| Events in quadrant D | 4,382,099 | 670,765 |
| Mode SS | |||
|---|---|---|---|
| Quadrant | BADHDUFLAG | Total packets | Discarded packets |
| A | 0 | 178 | 0 |
| B | 0 | 178 | 0 |
| C | 0 | 178 | 0 |
| D | 0 | 178 | 0 |
| Mode M9 | |||
|---|---|---|---|
| Quadrant | BADHDUFLAG | Total packets | Discarded packets |
| A | 0 | 18 | 0 |
| B | 0 | 18 | 0 |
| C | 0 | 18 | 0 |
| D | 0 | 18 | 0 |
| Mode M0 | |||
|---|---|---|---|
| Quadrant | BADHDUFLAG | Total packets | Discarded packets |
| A | 0 | 17821 | 3 |
| B | 0 | 19335 | 2 |
| C | 0 | 18175 | 2 |
| D | 0 | 18977 | 2 |
| Quadrant | Total seconds | Saturated seconds | Saturation percentage |
|---|---|---|---|
| A | 8739 | 24 | 0.274631% |
| B | 8739 | 131 | 1.499027% |
| C | 8739 | 25 | 0.286074% |
| D | 8739 | 67 | 0.766678% |
Noise dominated data is calculated using 1-second bins in cleaned event files. If a bin has >2000 counts, and if more than 50% of those come from <1% of pixels, then it is considered to be noise-dominated and hence unusable.
| Quadrant | # 1 sec bins | Bins with >0 counts | Bins with >2000 counts | High rate bins dominated by noise | Noise dominated (total time) | Noise dominated (detector-on time) | Marked lightcurve |
|---|---|---|---|---|---|---|---|
| A | 10579 | 8741 | 0 | 0 | 0.00% | 0.00% | 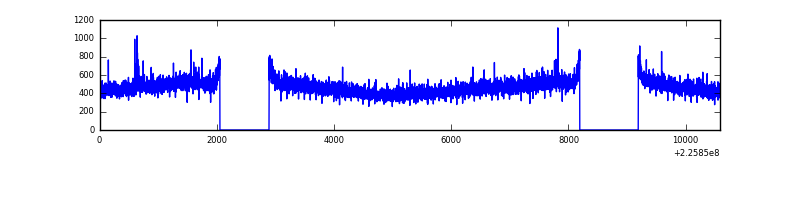 |
| B | 10579 | 8741 | 50 | 50 | 0.47% | 0.57% | 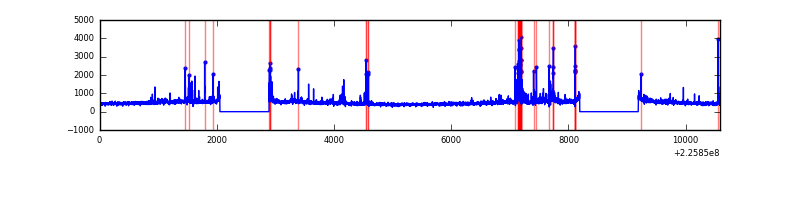 |
| C | 10579 | 8741 | 0 | 0 | 0.00% | 0.00% | 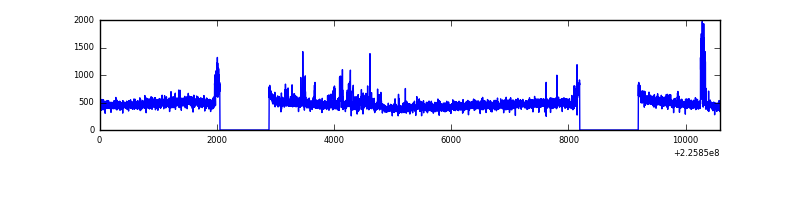 |
| D | 10579 | 8741 | 28 | 28 | 0.26% | 0.32% | 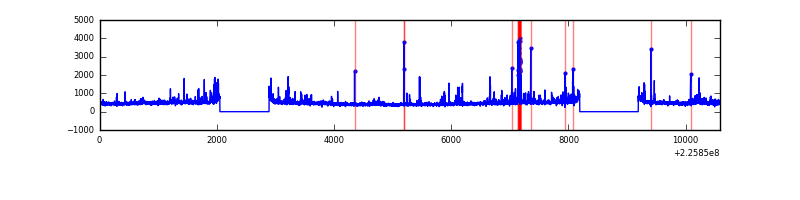 |
Top three noisy pixels from each quadrant. If the there are fewer than three noisy pixels in the level2.evt file, extra rows are filled as -1
| Pixel properties | Quadrant properties | ||||||
|---|---|---|---|---|---|---|---|
| Quadrant | DetID | PixID | Counts | Sigma | Mean | Median | Sigma |
| A | 13 | 248 | 14984 | 64.41 | 1051 | 1026 | 216.7 |
| A | 0 | 226 | 10179 | 42.24 | 1051 | 1026 | 216.7 |
| A | 12 | 194 | 9074 | 37.14 | 1051 | 1026 | 216.7 |
| B | 10 | 245 | 178475 | 877.68 | 1054 | 1029 | 202.2 |
| B | 4 | 239 | 137735 | 676.18 | 1054 | 1029 | 202.2 |
| B | 0 | 229 | 42977 | 207.48 | 1054 | 1029 | 202.2 |
| C | 9 | 68 | 206995 | 858.82 | 1026 | 1031 | 239.8 |
| C | 13 | 61 | 7763 | 28.07 | 1026 | 1031 | 239.8 |
| C | 8 | 208 | 6029 | 20.84 | 1026 | 1031 | 239.8 |
| D | 13 | 104 | 273965 | 1085.12 | 1021 | 991 | 251.6 |
| D | 2 | 152 | 77474 | 304.03 | 1021 | 991 | 251.6 |
| D | 5 | 233 | 34792 | 134.36 | 1021 | 991 | 251.6 |
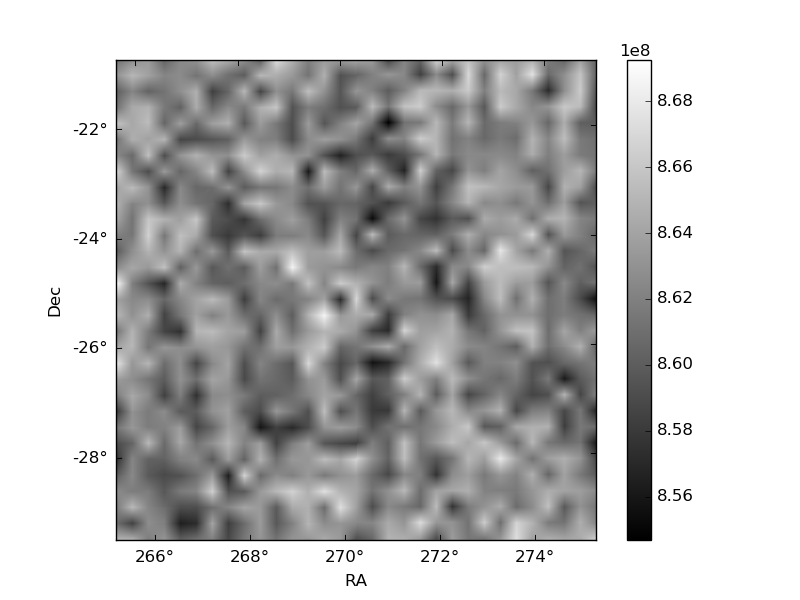
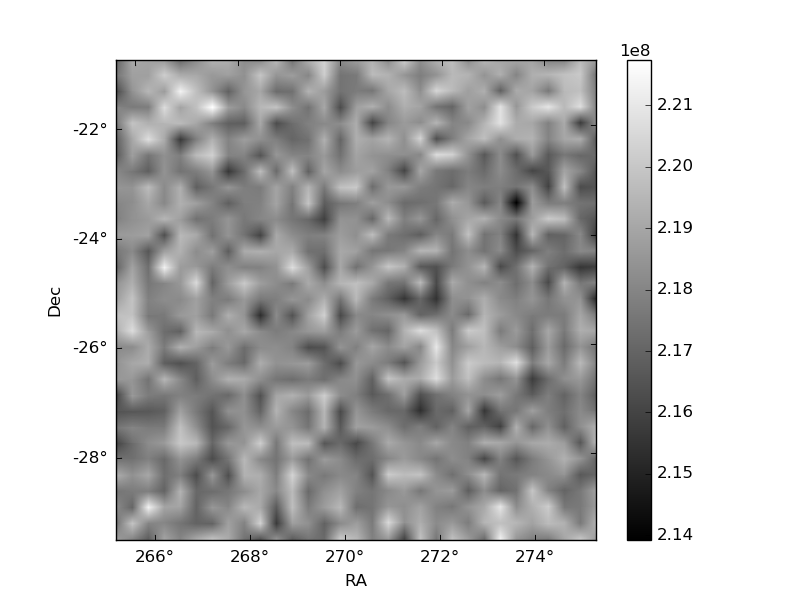
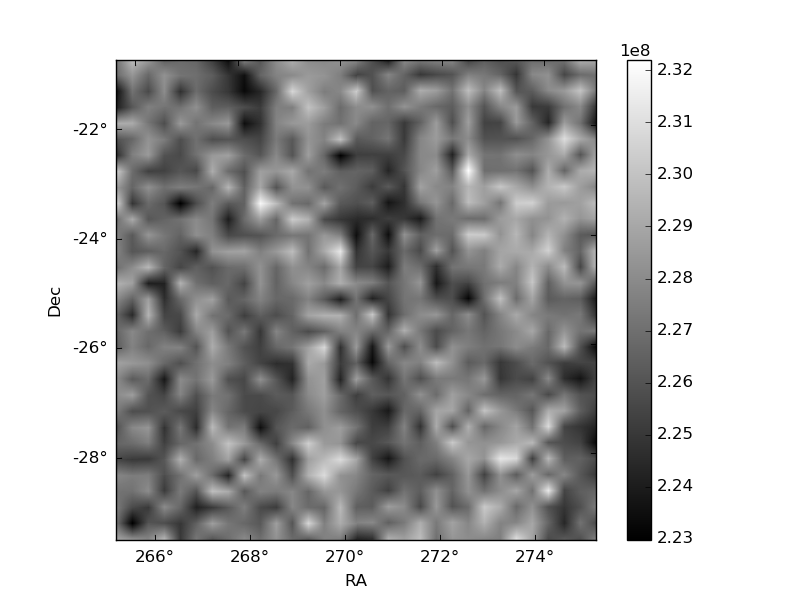
Histogram calculated using DETX and DETY for each event in the final _common_clean file
| Quadrant A | 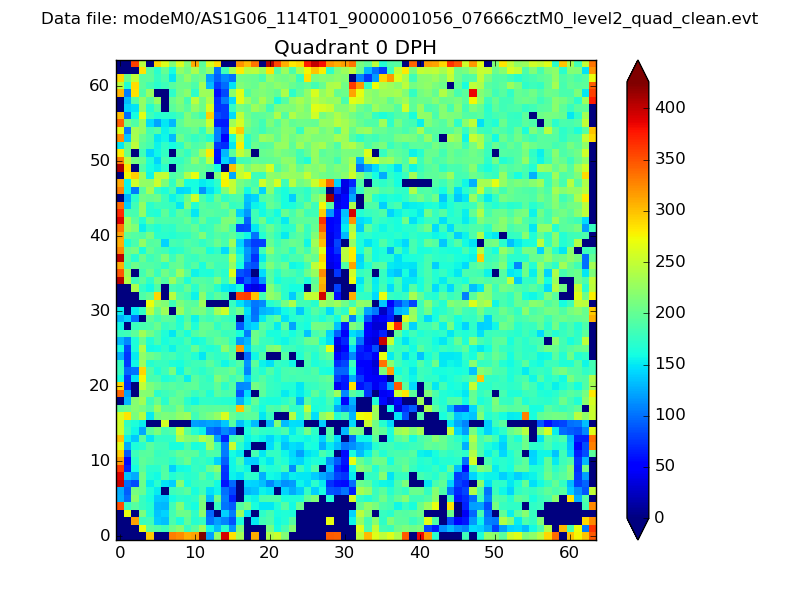 |
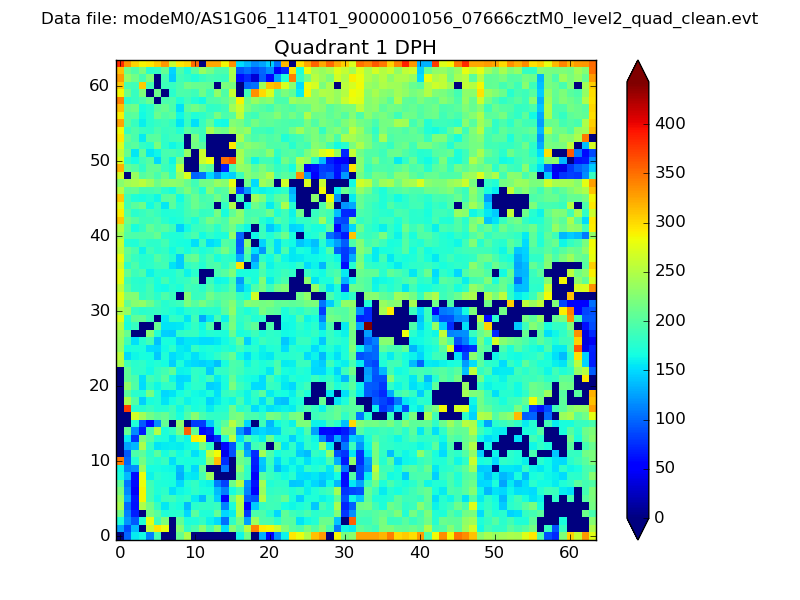 |
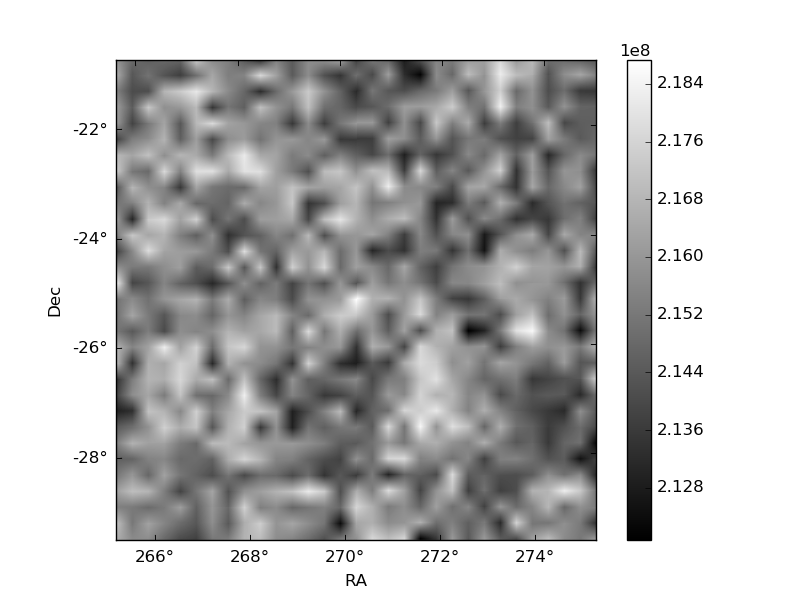
Quadrant B |
|---|---|---|---|
| Quadrant D | 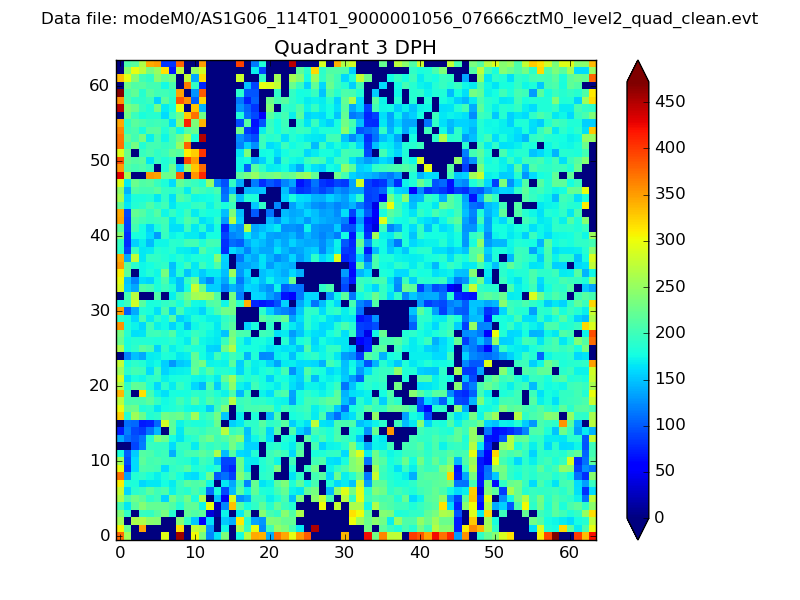 |
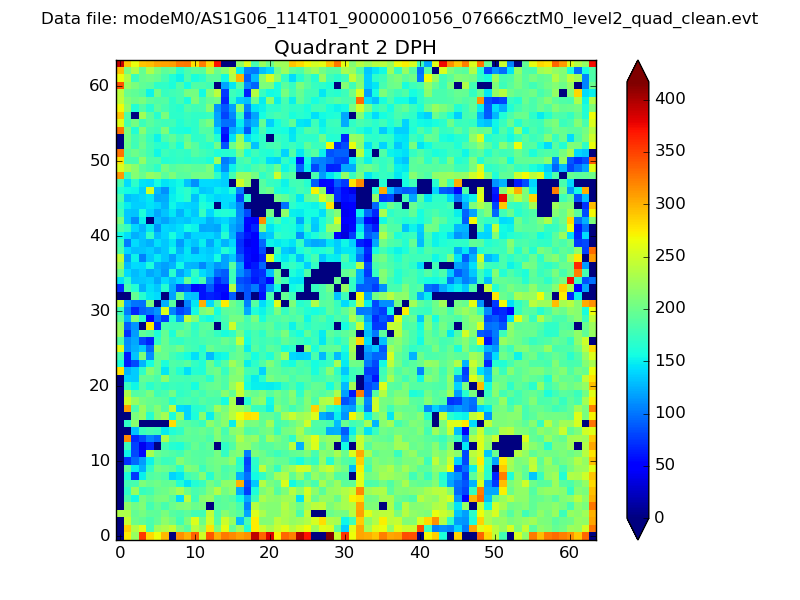 |
Quadrant C |
| Plot type | Count rate plots | Images |
|---|---|---|
| Comparison with Poisson distribution Blue bars denote a histogram of data divided into 1 sec bins. Red curve is a Poisson curve with rate = median count rate of data. |
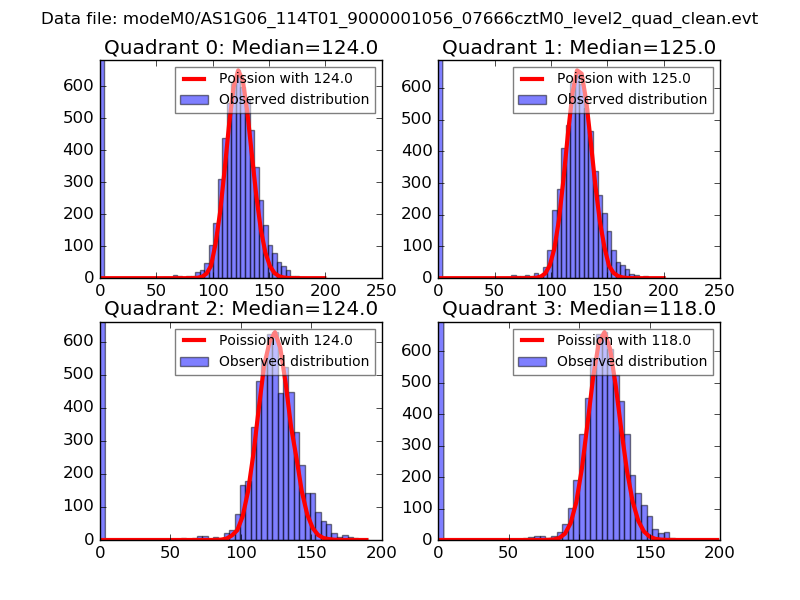 |
 |
| Quadrant-wise count rates Data is divided into 100 sec bins |
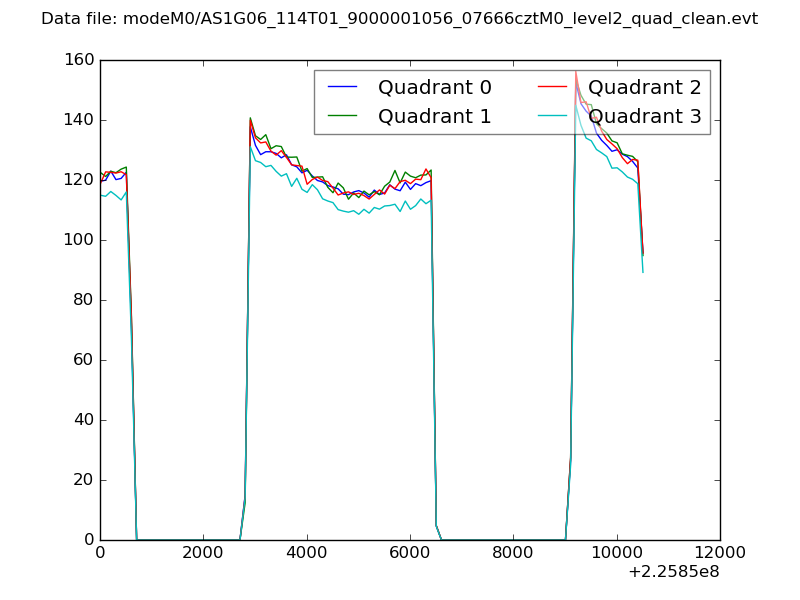 |
|
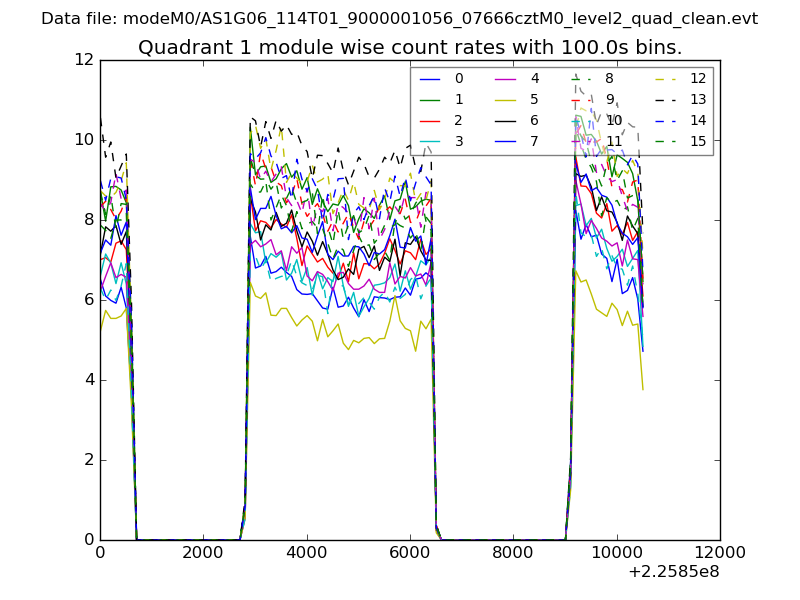
| Module-wise count rates for Quadrant A Data is divided into 100 sec bins |
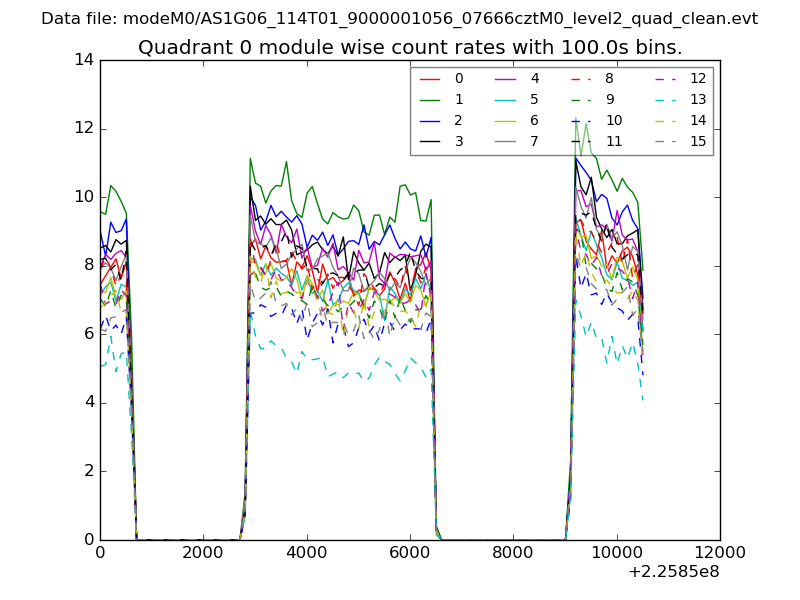 |
 |
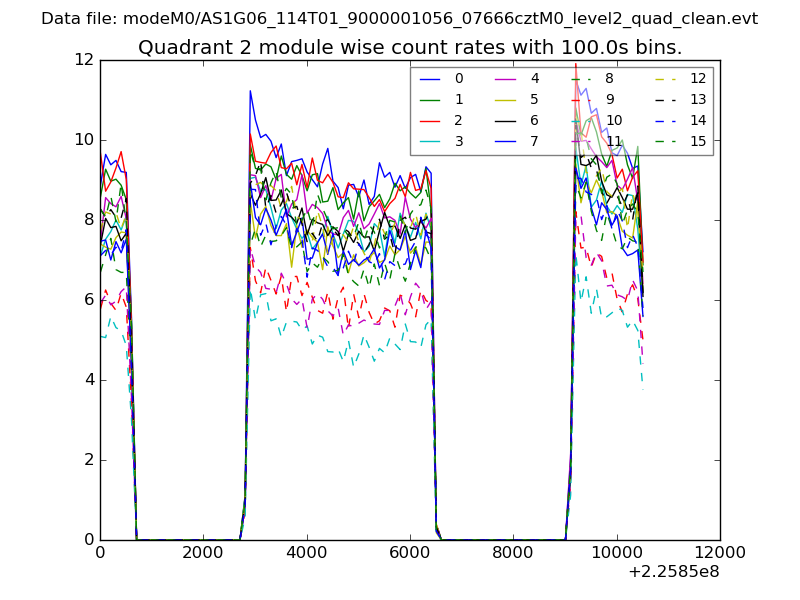
| Module-wise count rates for Quadrant B Data is divided into 100 sec bins |
 |
 |
| Module-wise count rates for Quadrant C Data is divided into 100 sec bins |
 |
 |
| Module-wise count rates for Quadrant D Data is divided into 100 sec bins |
 |
 |
| Parameter | Plot |
|---|---|
| CZT HV Monitor | 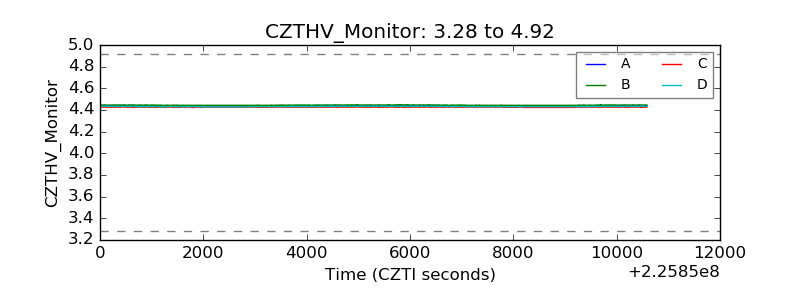 |
| D_VDD | 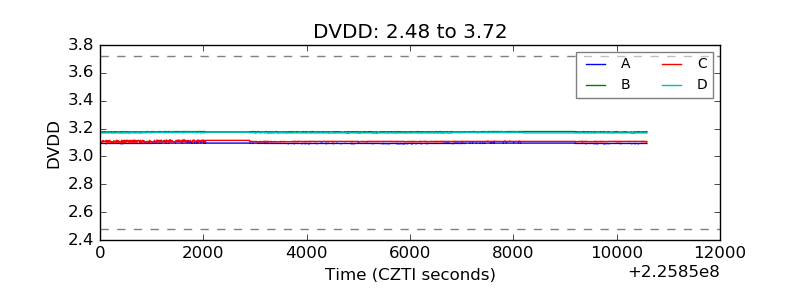 |
| Temperature 1 | 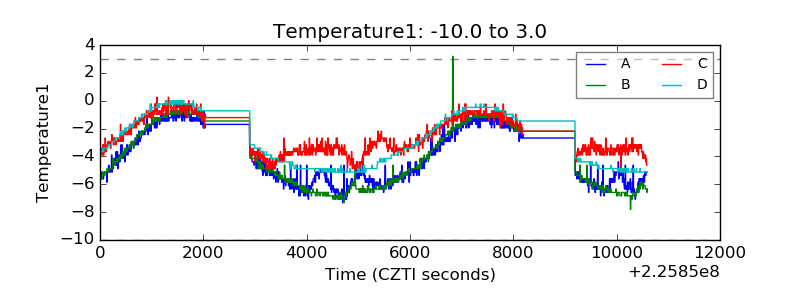 |
| Veto HV Monitor | 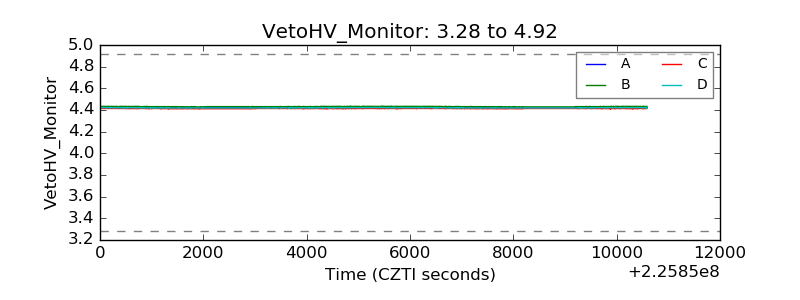 |
| Veto LLD | 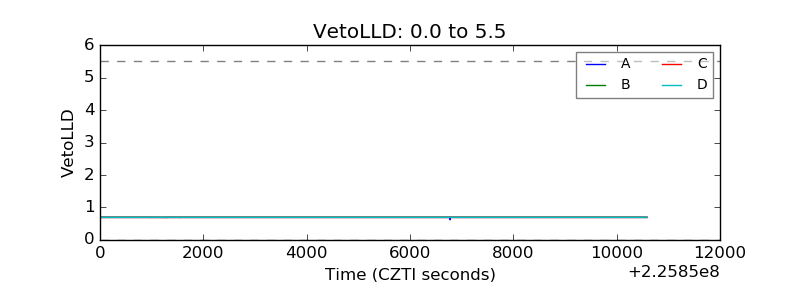 |
| Alpha Counter | 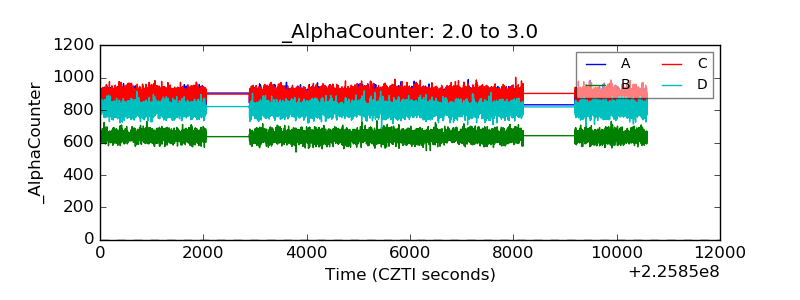 |
| _CPM_Rate | 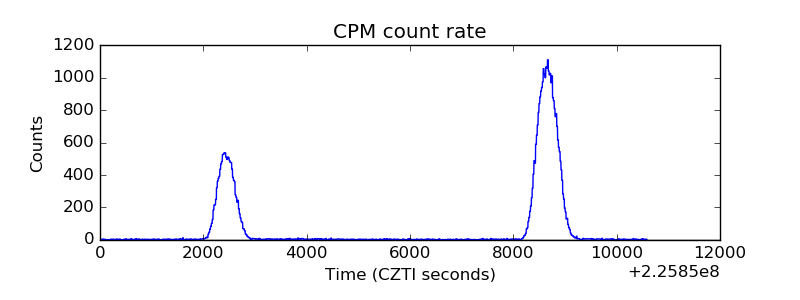 |
| CZT Counter | 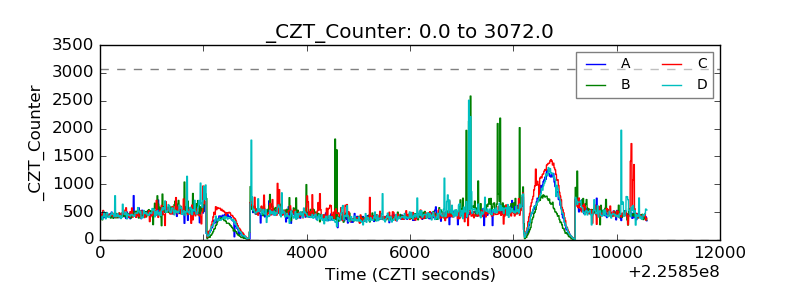 |
| +2.5 Volts monitor |  |
| +5 Volts monitor |  |
| _ROLL_ROT |  |
| _Roll_DEC |  |
| _Roll_RA | 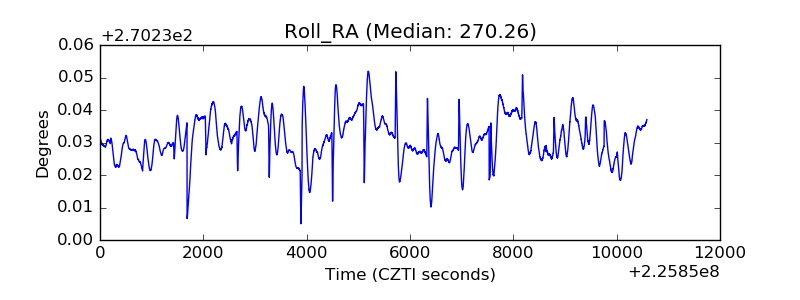 |
| Veto Counter | 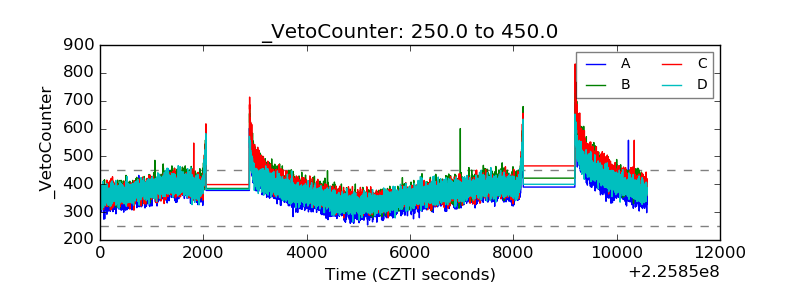 |