| Param | Original file | Final file |
|---|---|---|
| Filename | modeM0/AS1G06_114T01_9000001056_07668cztM0_level2.evt | modeM0/AS1G06_114T01_9000001056_07668cztM0_level2_quad_clean.evt |
| Size (bytes) | 388,203,840 | 77,921,280 |
| Size | 370.2 MB | 74.3 MB |
| Events in quadrant A | 2,642,864 | 492,709 |
| Events in quadrant B | 2,809,421 | 500,858 |
| Events in quadrant C | 3,100,549 | 492,117 |
| Events in quadrant D | 2,810,827 | 470,147 |
| Mode SS | |||
|---|---|---|---|
| Quadrant | BADHDUFLAG | Total packets | Discarded packets |
| A | 0 | 120 | 0 |
| B | 0 | 120 | 0 |
| C | 0 | 120 | 0 |
| D | 0 | 120 | 0 |
| Mode M9 | |||
|---|---|---|---|
| Quadrant | BADHDUFLAG | Total packets | Discarded packets |
| A | 0 | 11 | 0 |
| B | 0 | 11 | 0 |
| C | 0 | 11 | 0 |
| D | 0 | 11 | 0 |
| Mode M0 | |||
|---|---|---|---|
| Quadrant | BADHDUFLAG | Total packets | Discarded packets |
| A | 0 | 11702 | 2 |
| B | 0 | 12129 | 1 |
| C | 0 | 13031 | 1 |
| D | 0 | 12284 | 1 |
| Quadrant | Total seconds | Saturated seconds | Saturation percentage |
|---|---|---|---|
| A | 5768 | 9 | 0.156033% |
| B | 5768 | 26 | 0.450763% |
| C | 5768 | 55 | 0.953537% |
| D | 5768 | 16 | 0.277393% |
Noise dominated data is calculated using 1-second bins in cleaned event files. If a bin has >2000 counts, and if more than 50% of those come from <1% of pixels, then it is considered to be noise-dominated and hence unusable.
| Quadrant | # 1 sec bins | Bins with >0 counts | Bins with >2000 counts | High rate bins dominated by noise | Noise dominated (total time) | Noise dominated (detector-on time) | Marked lightcurve |
|---|---|---|---|---|---|---|---|
| A | 6923 | 5769 | 0 | 0 | 0.00% | 0.00% | 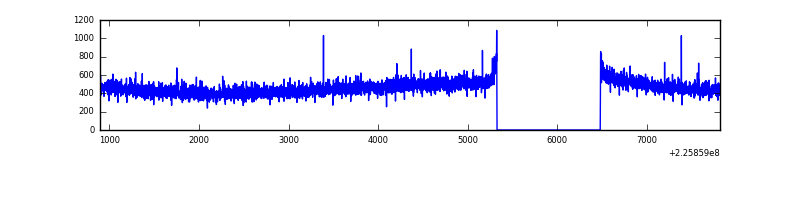 |
| B | 6923 | 5769 | 3 | 3 | 0.04% | 0.05% | 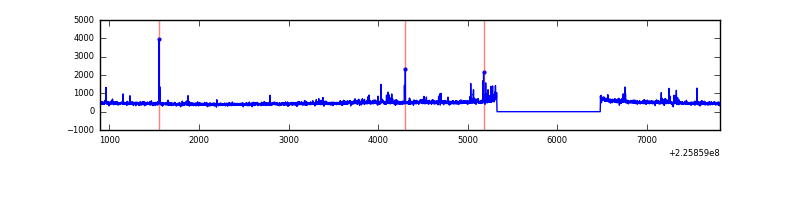 |
| C | 6923 | 5769 | 39 | 39 | 0.56% | 0.68% | 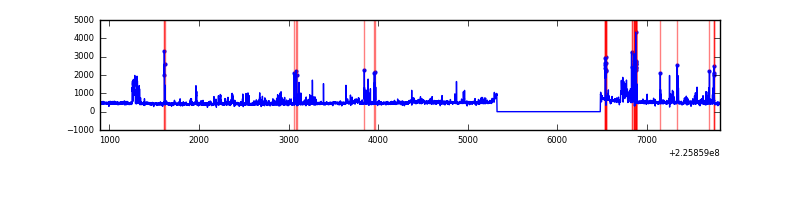 |
| D | 6923 | 5769 | 7 | 7 | 0.10% | 0.12% | 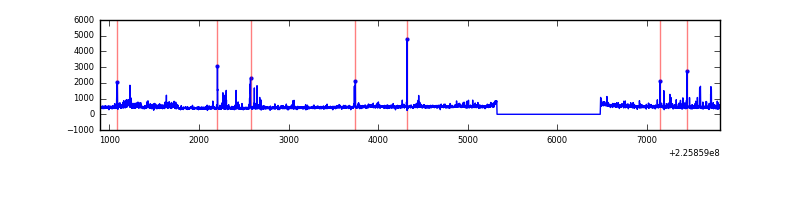 |
Top three noisy pixels from each quadrant. If the there are fewer than three noisy pixels in the level2.evt file, extra rows are filled as -1
| Pixel properties | Quadrant properties | ||||||
|---|---|---|---|---|---|---|---|
| Quadrant | DetID | PixID | Counts | Sigma | Mean | Median | Sigma |
| A | 0 | 226 | 6496 | 41.32 | 685 | 670 | 141.0 |
| A | 12 | 194 | 5930 | 37.3 | 685 | 670 | 141.0 |
| A | 13 | 164 | 3834 | 22.44 | 685 | 670 | 141.0 |
| B | 10 | 245 | 35368 | 261.83 | 690 | 674 | 132.5 |
| B | 0 | 230 | 26595 | 195.62 | 690 | 674 | 132.5 |
| B | 0 | 214 | 18037 | 131.04 | 690 | 674 | 132.5 |
| C | 9 | 68 | 466848 | 2976.09 | 672 | 676 | 156.6 |
| C | 9 | 243 | 6957 | 40.1 | 672 | 676 | 156.6 |
| C | 13 | 61 | 5246 | 29.18 | 672 | 676 | 156.6 |
| D | 2 | 152 | 88058 | 533.08 | 670 | 650 | 164.0 |
| D | 13 | 104 | 60403 | 364.42 | 670 | 650 | 164.0 |
| D | 1 | 20 | 42388 | 254.55 | 670 | 650 | 164.0 |
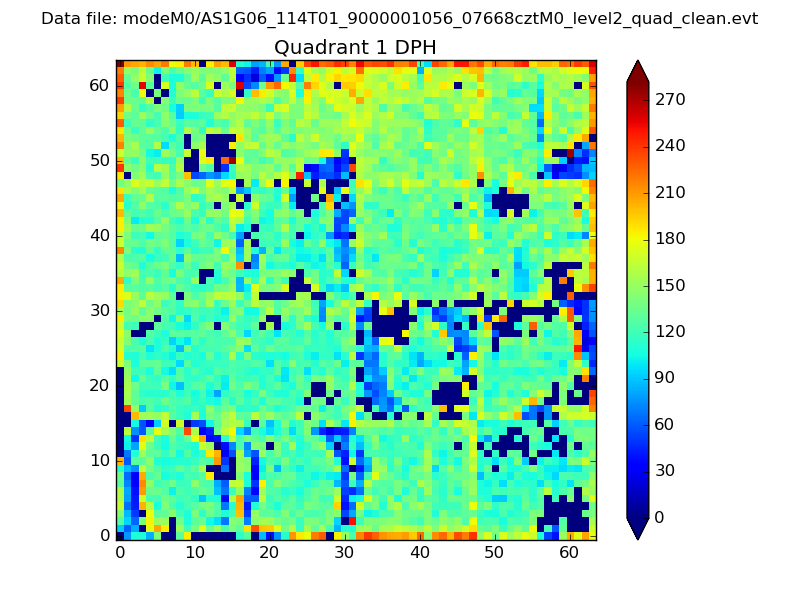
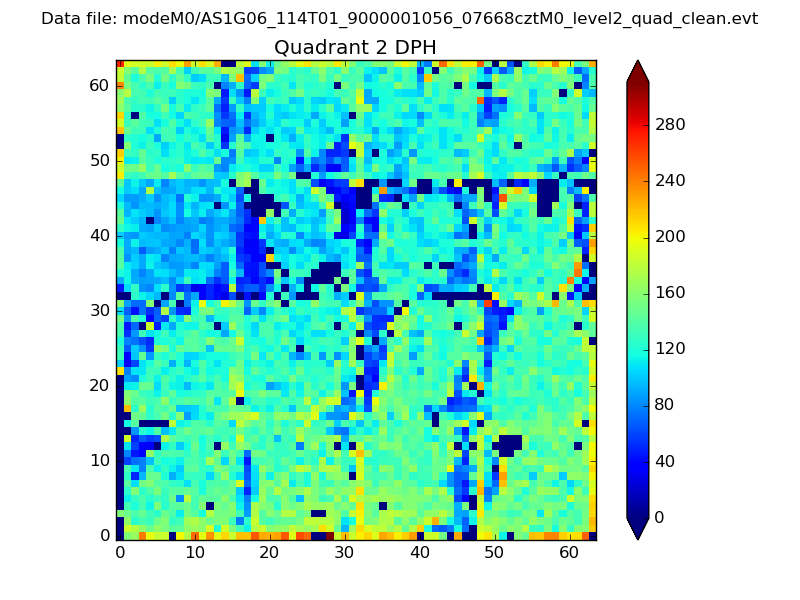
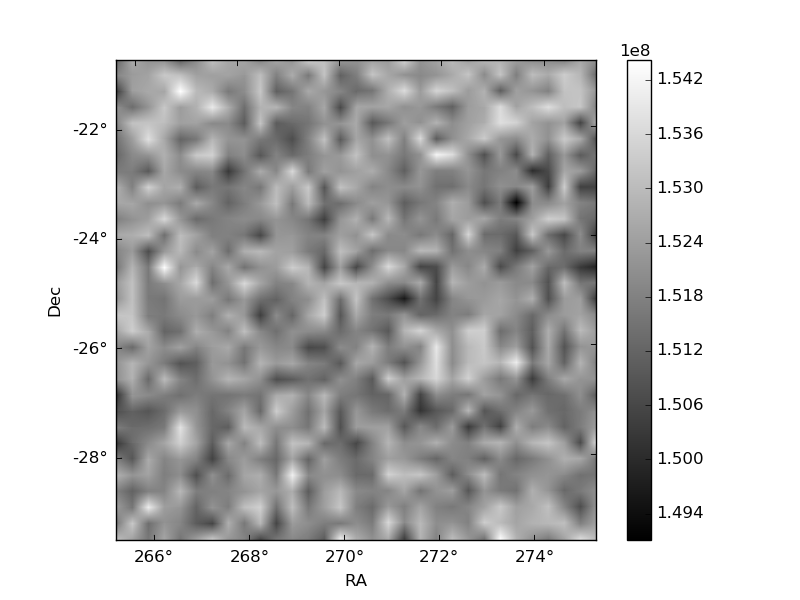
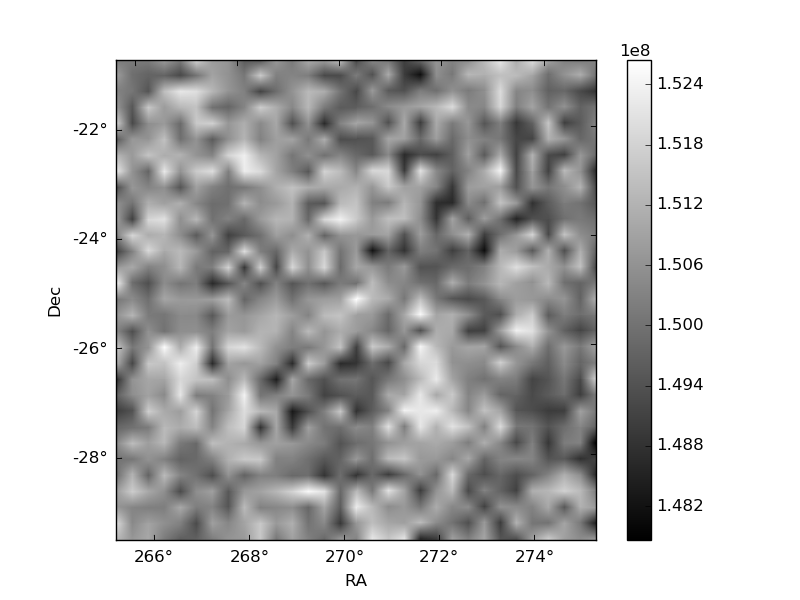
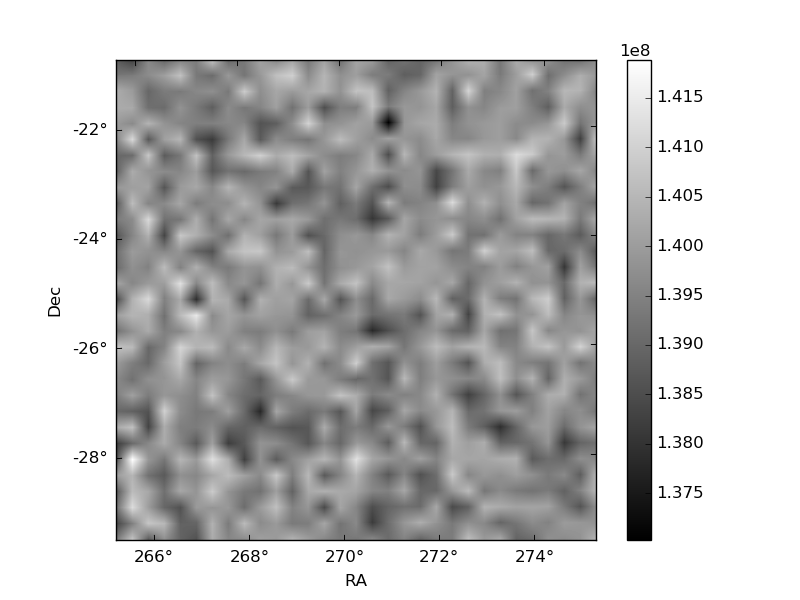
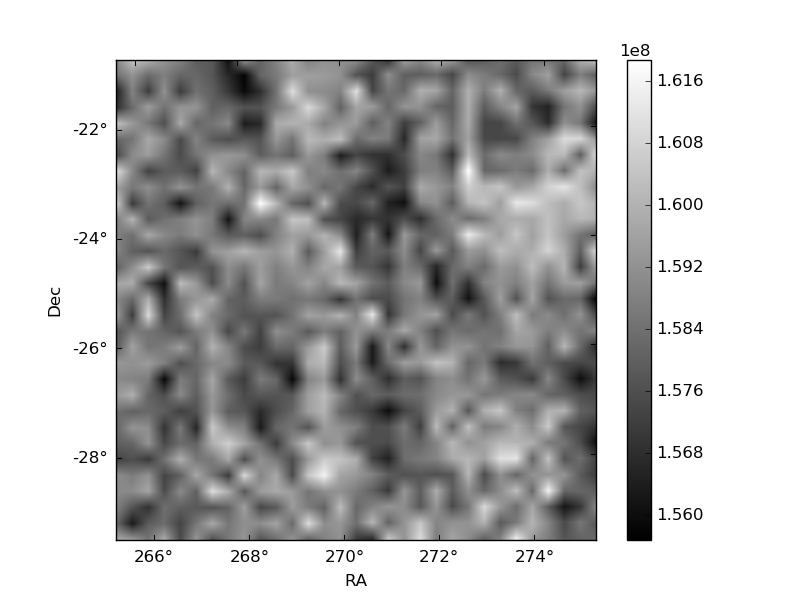
Histogram calculated using DETX and DETY for each event in the final _common_clean file
| Quadrant A |  |
 |
Quadrant B |
|---|---|---|---|
| Quadrant D | 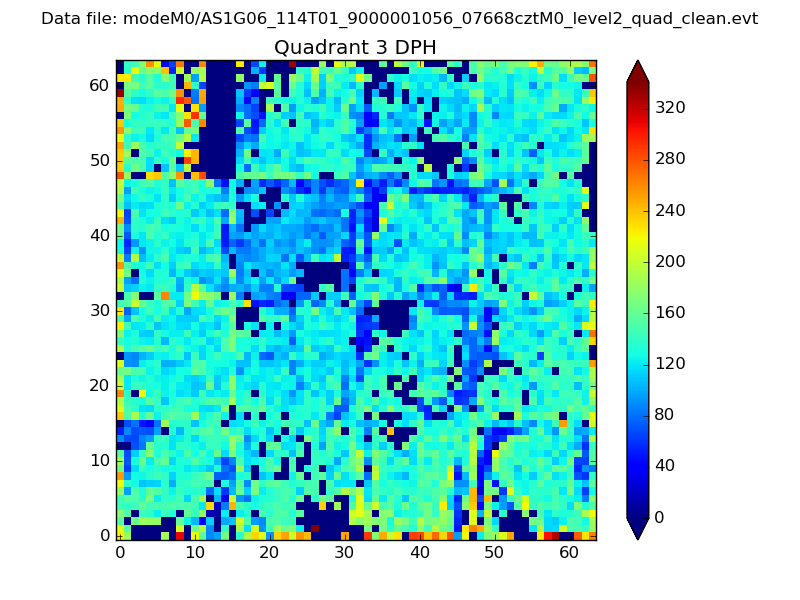 |
 |
Quadrant C |
| Plot type | Count rate plots | Images |
|---|---|---|
| Comparison with Poisson distribution Blue bars denote a histogram of data divided into 1 sec bins. Red curve is a Poisson curve with rate = median count rate of data. |
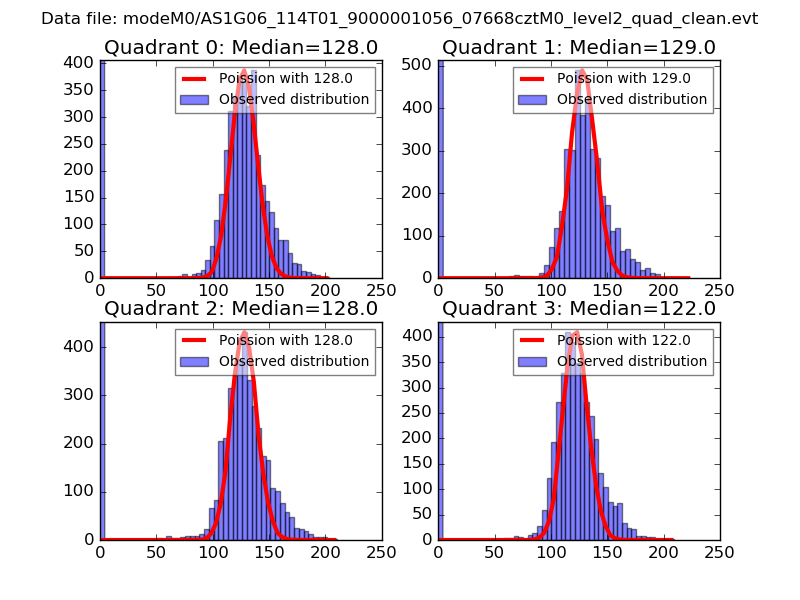 |
 |
| Quadrant-wise count rates Data is divided into 100 sec bins |
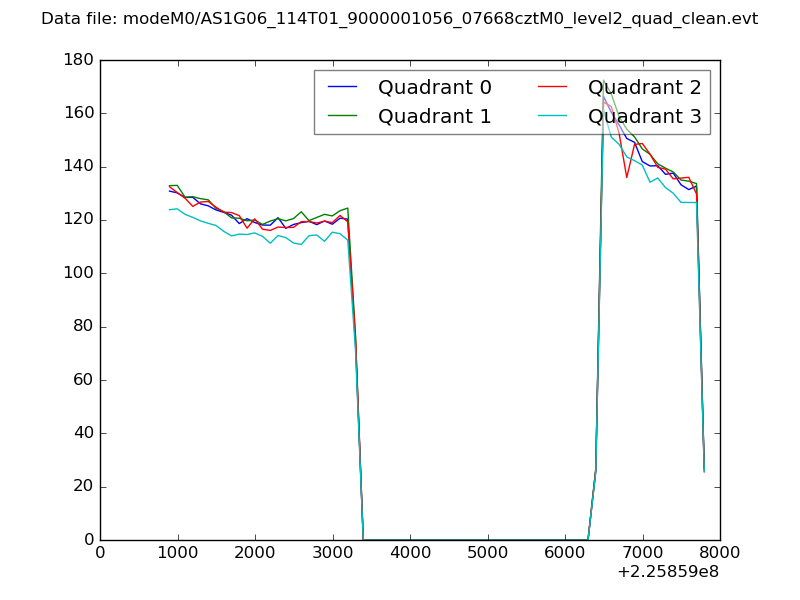 |
|
| Module-wise count rates for Quadrant A Data is divided into 100 sec bins |
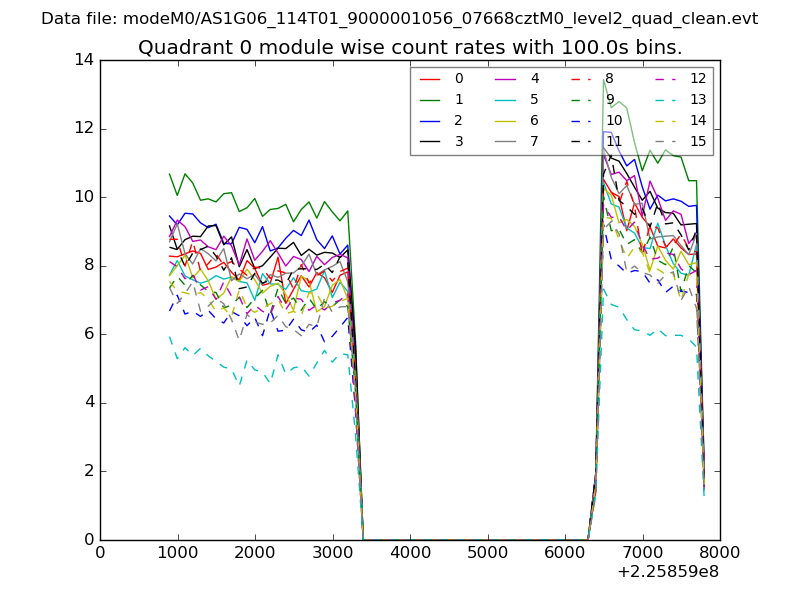 |
 |
| Module-wise count rates for Quadrant B Data is divided into 100 sec bins |
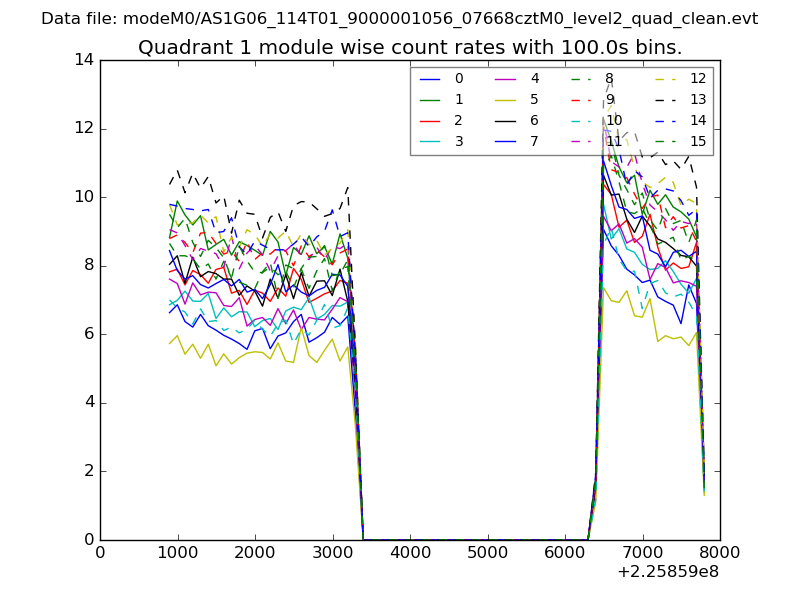 |
 |
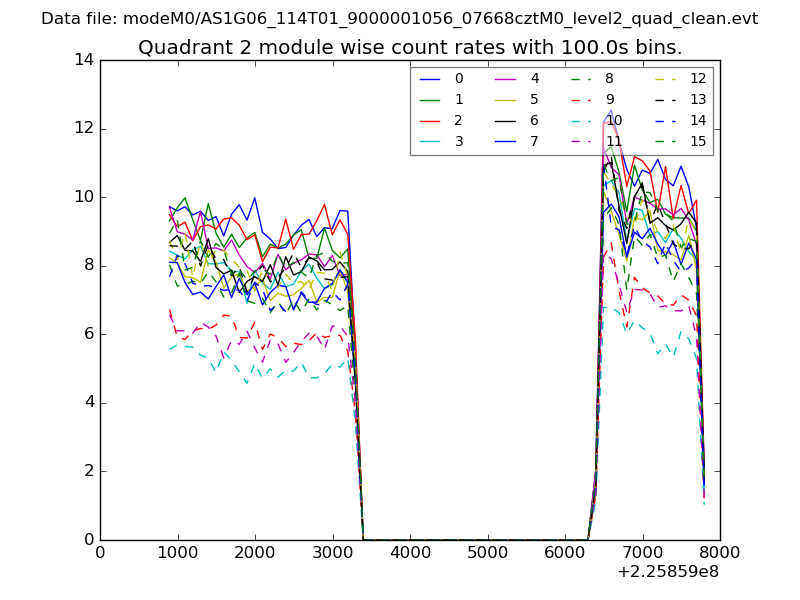
| Module-wise count rates for Quadrant C Data is divided into 100 sec bins |
 |
 |
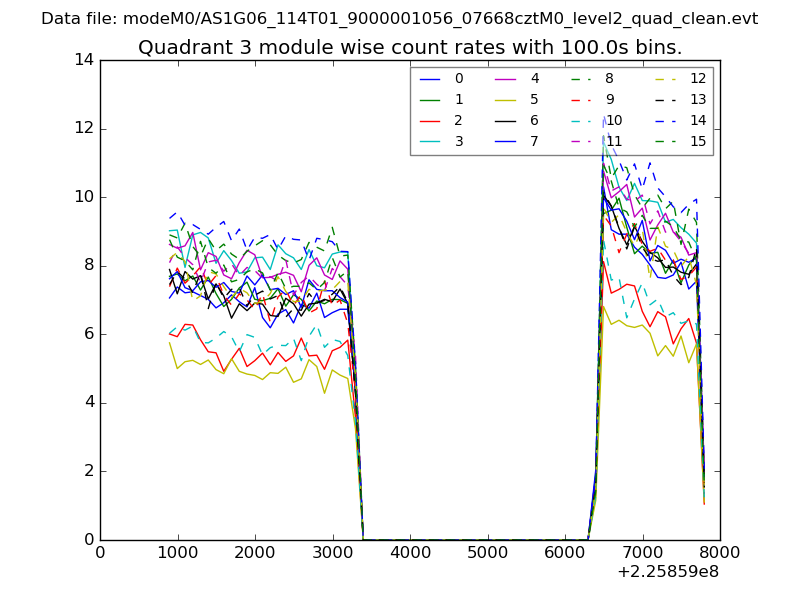
| Module-wise count rates for Quadrant D Data is divided into 100 sec bins |
 |
 |
| Parameter | Plot |
|---|---|
| CZT HV Monitor | 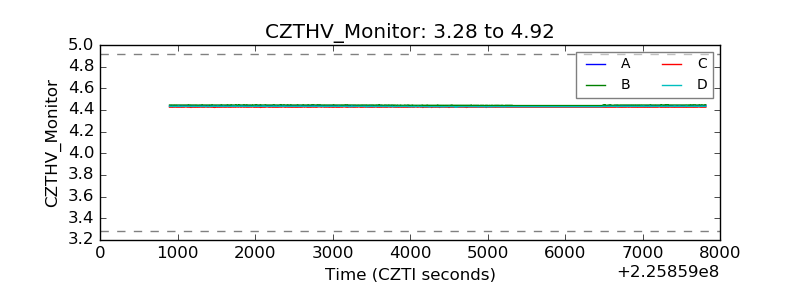 |
| D_VDD | 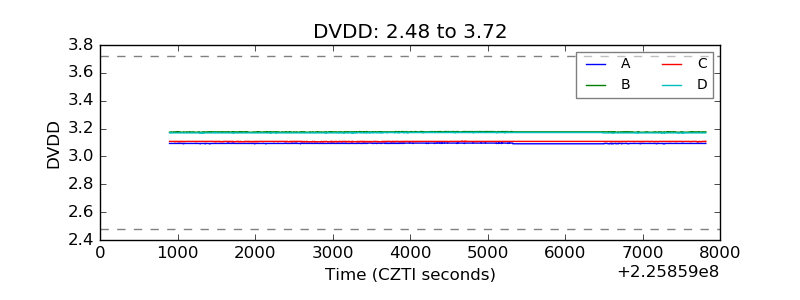 |
| Temperature 1 | 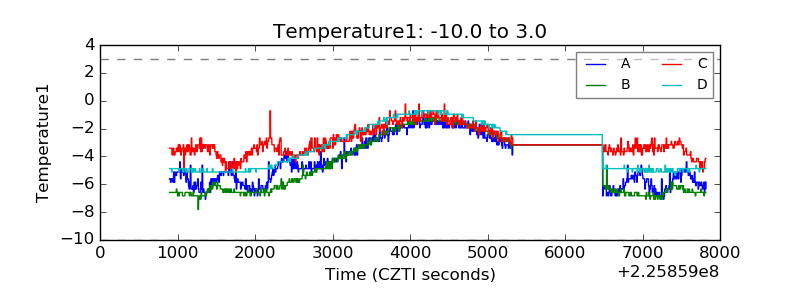 |
| Veto HV Monitor | 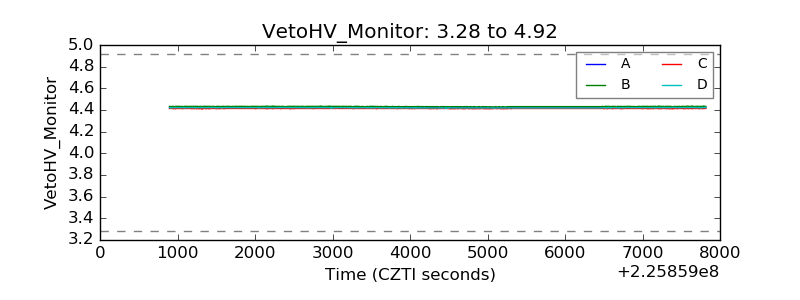 |
| Veto LLD | 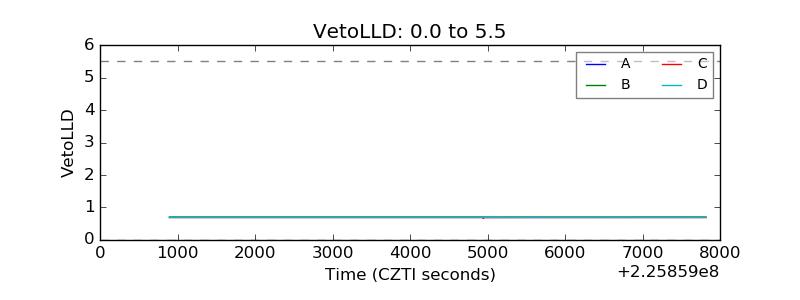 |
| Alpha Counter | 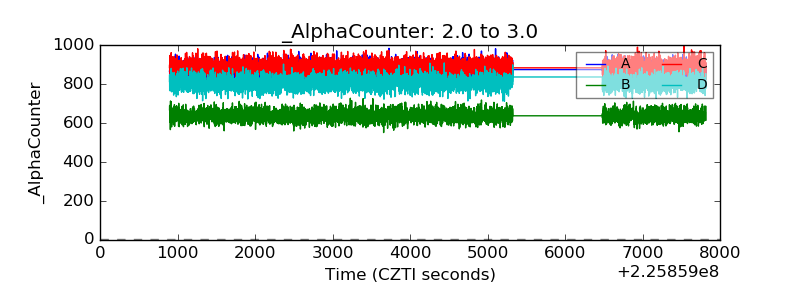 |
| _CPM_Rate | 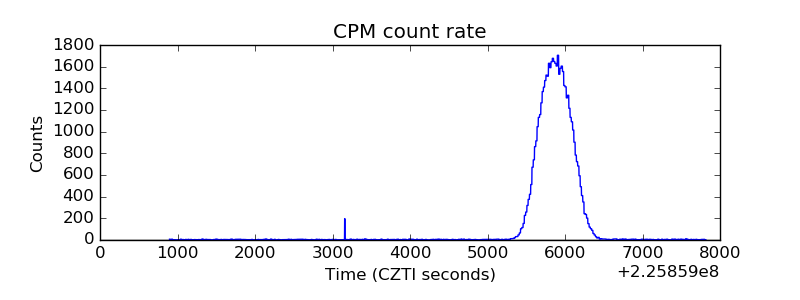 |
| CZT Counter |  |
| +2.5 Volts monitor |  |
| +5 Volts monitor | 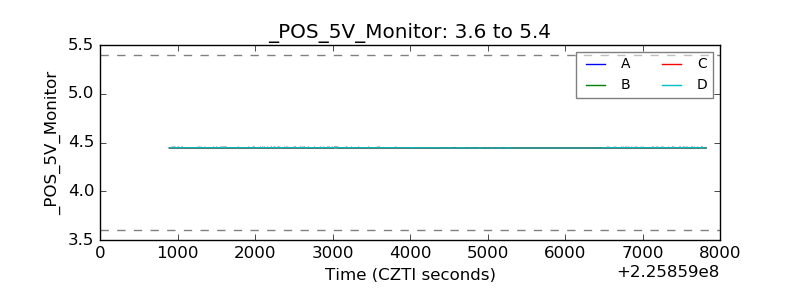 |
| _ROLL_ROT | 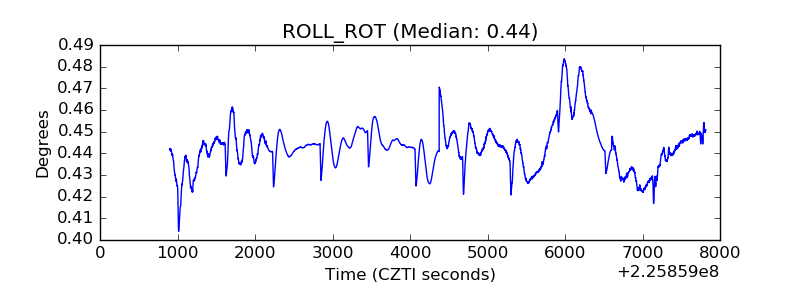 |
| _Roll_DEC | 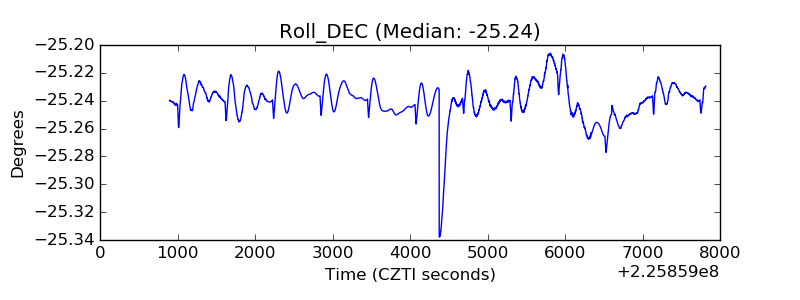 |
| _Roll_RA | 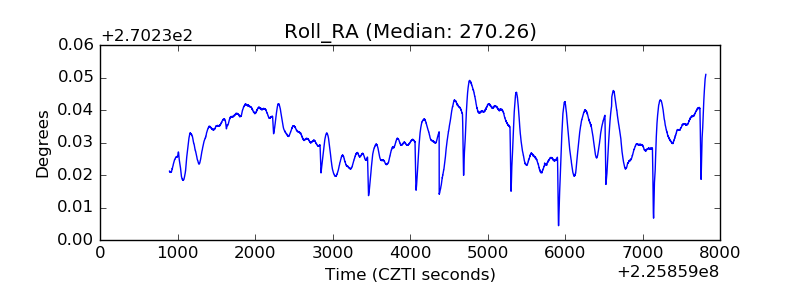 |
| Veto Counter | 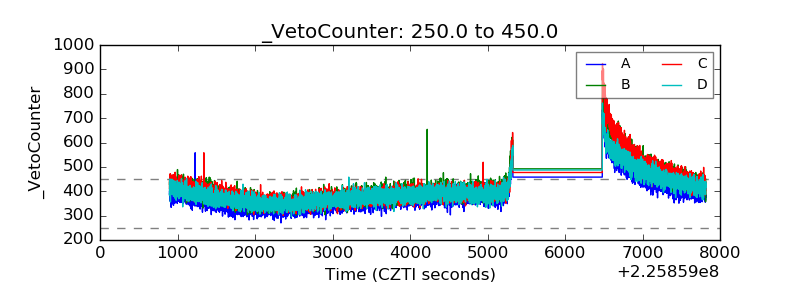 |