| Param | Original file | Final file |
|---|---|---|
| Filename | modeM0/AS1G06_114T01_9000001056_07669cztM0_level2.evt | modeM0/AS1G06_114T01_9000001056_07669cztM0_level2_quad_clean.evt |
| Size (bytes) | 454,268,160 | 85,844,160 |
| Size | 433.2 MB | 81.9 MB |
| Events in quadrant A | 2,902,807 | 545,417 |
| Events in quadrant B | 3,087,150 | 554,742 |
| Events in quadrant C | 2,982,563 | 551,648 |
| Events in quadrant D | 4,366,401 | 517,922 |
| Mode SS | |||
|---|---|---|---|
| Quadrant | BADHDUFLAG | Total packets | Discarded packets |
| A | 0 | 126 | 0 |
| B | 0 | 126 | 0 |
| C | 0 | 126 | 0 |
| D | 0 | 126 | 0 |
| Mode M9 | |||
|---|---|---|---|
| Quadrant | BADHDUFLAG | Total packets | Discarded packets |
| A | 0 | 12 | 0 |
| B | 0 | 12 | 0 |
| C | 0 | 12 | 0 |
| D | 0 | 12 | 0 |
| Mode M0 | |||
|---|---|---|---|
| Quadrant | BADHDUFLAG | Total packets | Discarded packets |
| A | 0 | 12616 | 2 |
| B | 0 | 13029 | 1 |
| C | 0 | 12837 | 1 |
| D | 0 | 17131 | 1 |
| Quadrant | Total seconds | Saturated seconds | Saturation percentage |
|---|---|---|---|
| A | 6155 | 21 | 0.341186% |
| B | 6155 | 41 | 0.666125% |
| C | 6155 | 30 | 0.487409% |
| D | 6155 | 574 | 9.325751% |
Noise dominated data is calculated using 1-second bins in cleaned event files. If a bin has >2000 counts, and if more than 50% of those come from <1% of pixels, then it is considered to be noise-dominated and hence unusable.
| Quadrant | # 1 sec bins | Bins with >0 counts | Bins with >2000 counts | High rate bins dominated by noise | Noise dominated (total time) | Noise dominated (detector-on time) | Marked lightcurve |
|---|---|---|---|---|---|---|---|
| A | 7370 | 6156 | 0 | 0 | 0.00% | 0.00% | 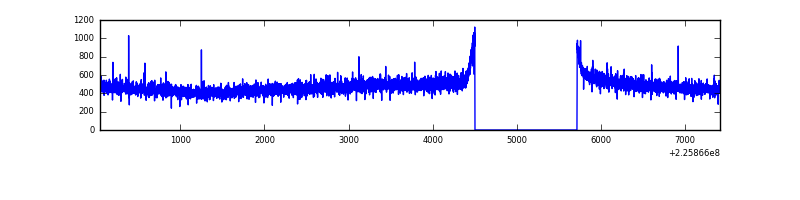 |
| B | 7370 | 6156 | 3 | 3 | 0.04% | 0.05% | 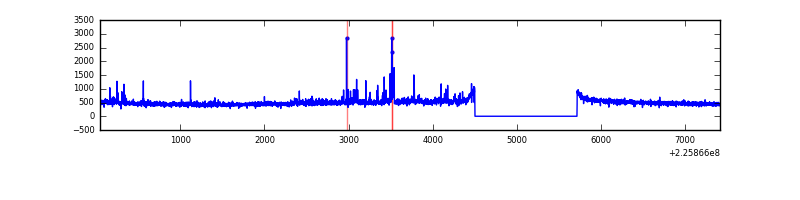 |
| C | 7370 | 6156 | 6 | 6 | 0.08% | 0.10% | 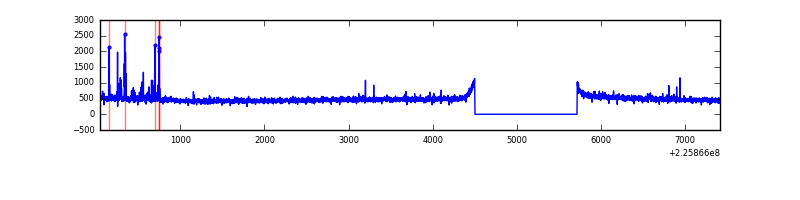 |
| D | 7370 | 6156 | 618 | 618 | 8.39% | 10.04% | 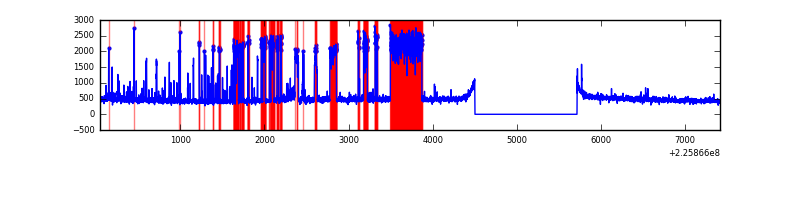 |
Top three noisy pixels from each quadrant. If the there are fewer than three noisy pixels in the level2.evt file, extra rows are filled as -1
| Pixel properties | Quadrant properties | ||||||
|---|---|---|---|---|---|---|---|
| Quadrant | DetID | PixID | Counts | Sigma | Mean | Median | Sigma |
| A | 0 | 226 | 7136 | 41.58 | 754 | 738 | 153.9 |
| A | 12 | 194 | 6696 | 38.72 | 754 | 738 | 153.9 |
| A | 13 | 254 | 3021 | 14.84 | 754 | 738 | 153.9 |
| B | 4 | 239 | 53539 | 367.42 | 758 | 741 | 143.7 |
| B | 10 | 245 | 24220 | 163.39 | 758 | 741 | 143.7 |
| B | 0 | 214 | 23228 | 156.49 | 758 | 741 | 143.7 |
| C | 9 | 68 | 73199 | 415.87 | 744 | 751 | 174.2 |
| C | 13 | 61 | 5716 | 28.5 | 744 | 751 | 174.2 |
| C | 12 | 4 | 4599 | 22.09 | 744 | 751 | 174.2 |
| D | 1 | 20 | 1506486 | 8457.55 | 730 | 710 | 178.0 |
| D | 2 | 152 | 37462 | 206.43 | 730 | 710 | 178.0 |
| D | 13 | 104 | 20378 | 110.47 | 730 | 710 | 178.0 |
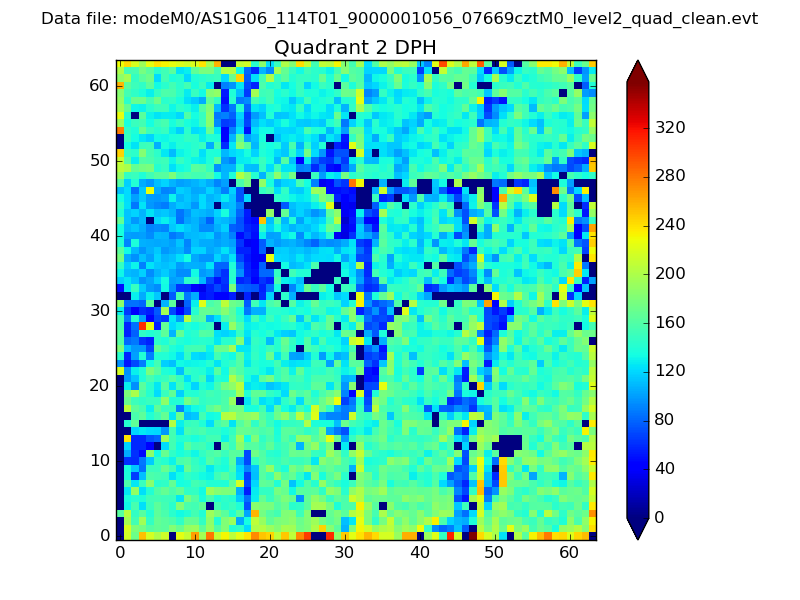
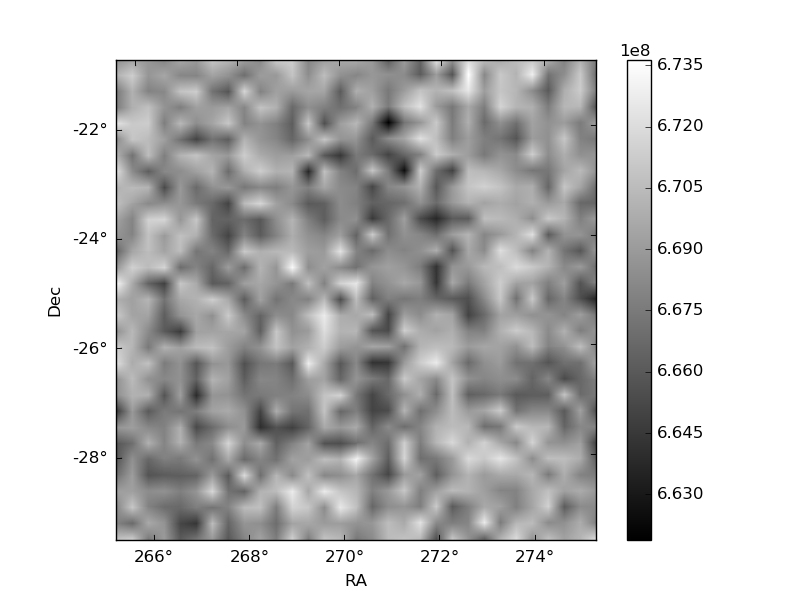
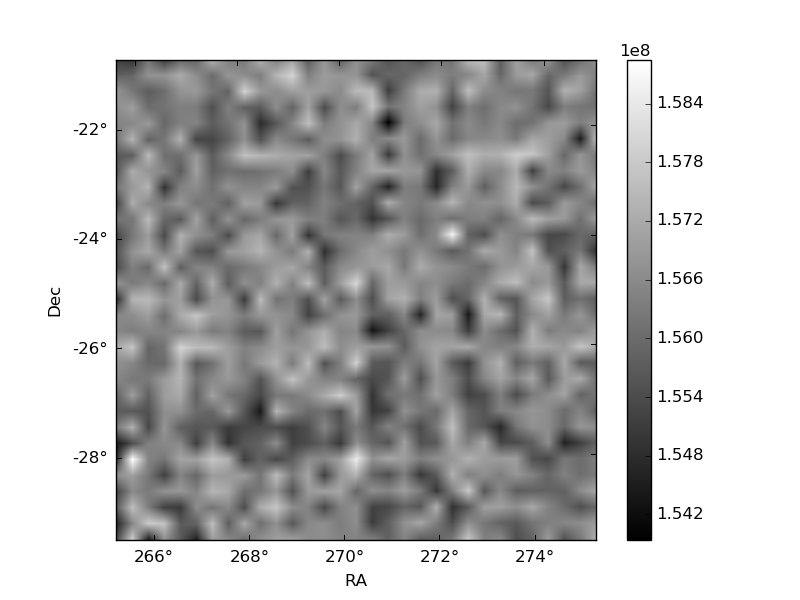
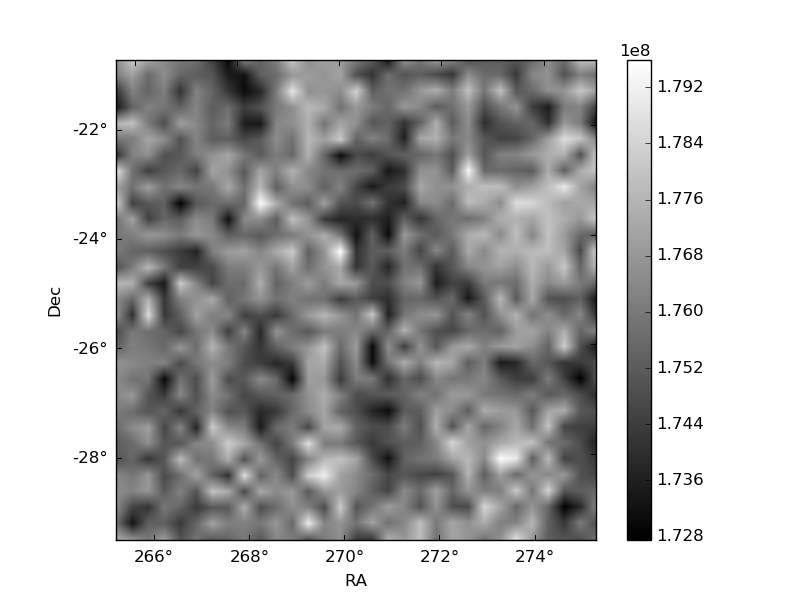
Histogram calculated using DETX and DETY for each event in the final _common_clean file
| Quadrant A | 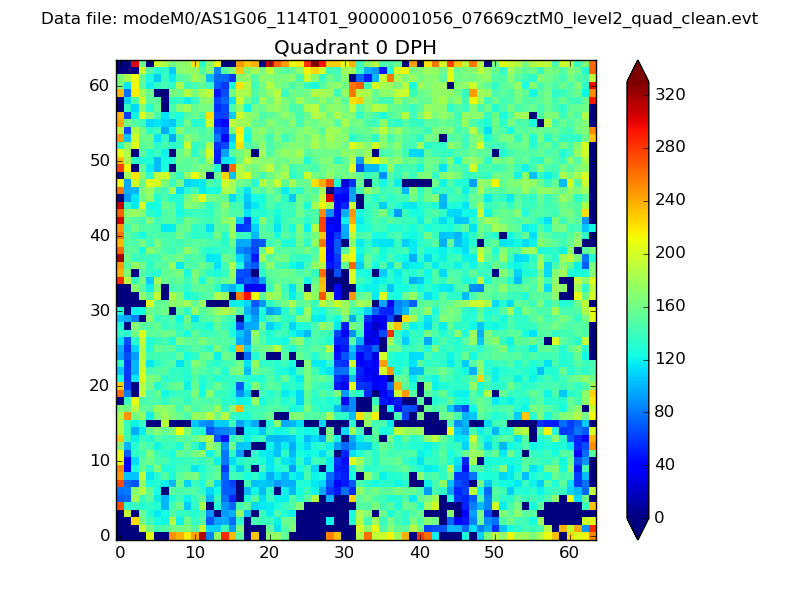 |
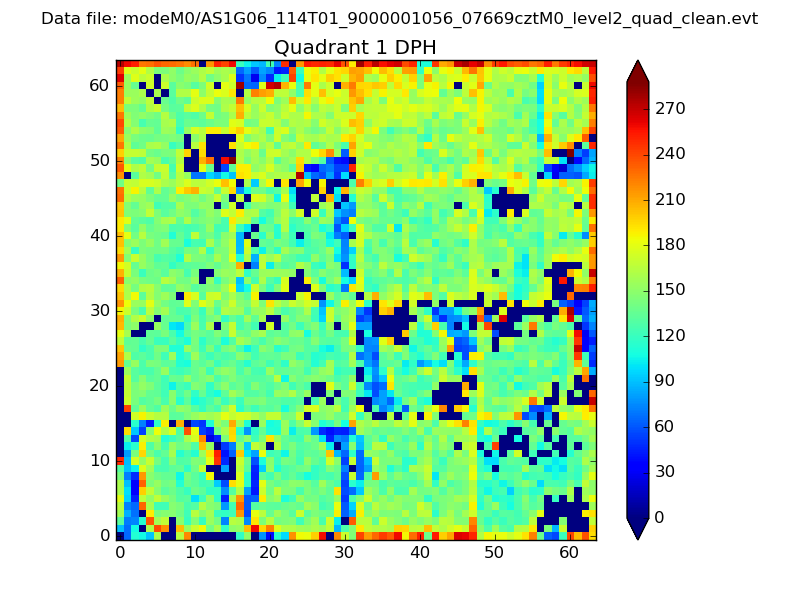 |
Quadrant B |
|---|---|---|---|
| Quadrant D | 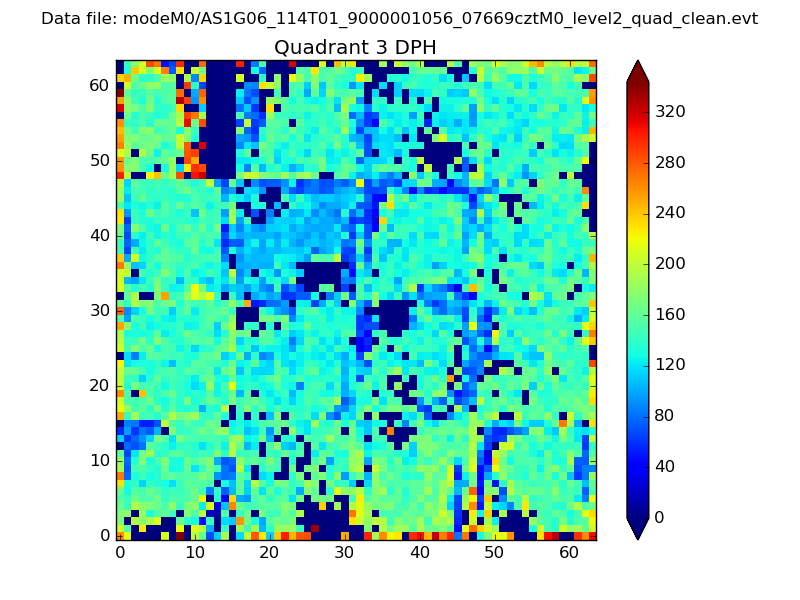 |
 |
Quadrant C |
| Plot type | Count rate plots | Images |
|---|---|---|
| Comparison with Poisson distribution Blue bars denote a histogram of data divided into 1 sec bins. Red curve is a Poisson curve with rate = median count rate of data. |
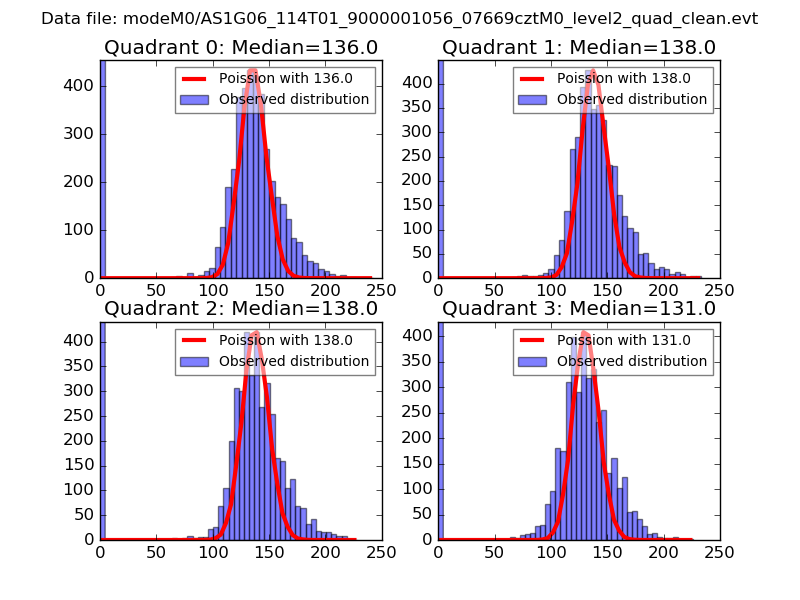 |
 |
| Quadrant-wise count rates Data is divided into 100 sec bins |
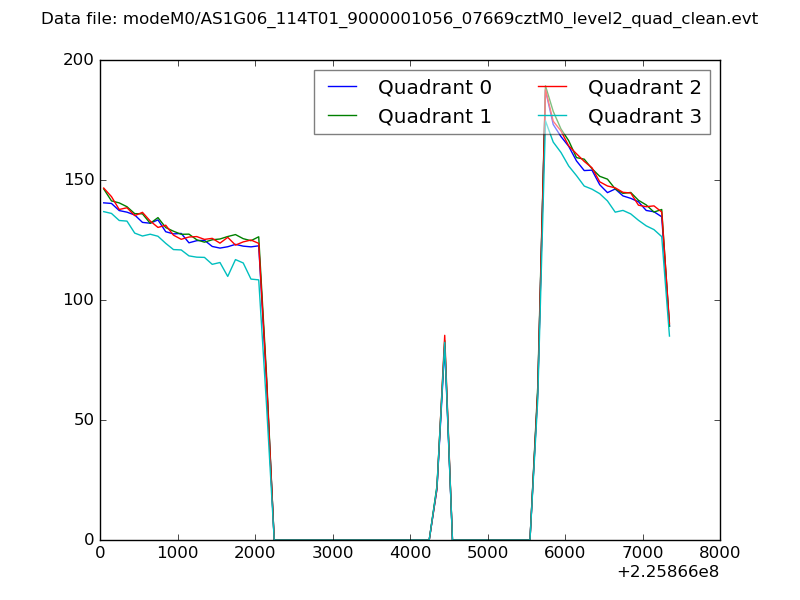 |
|
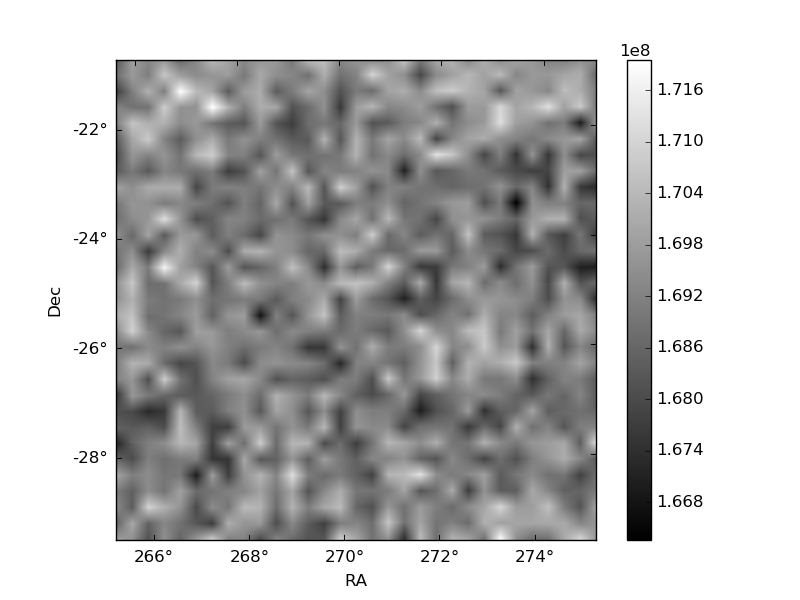
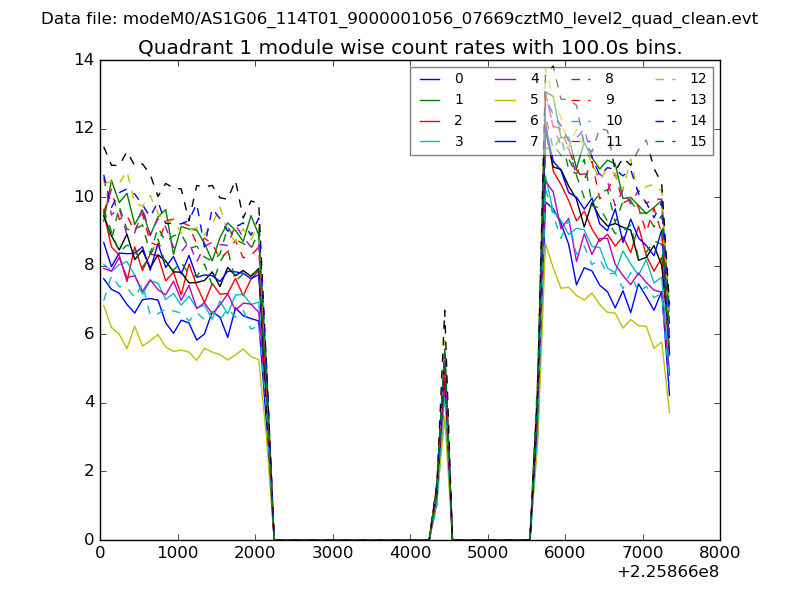
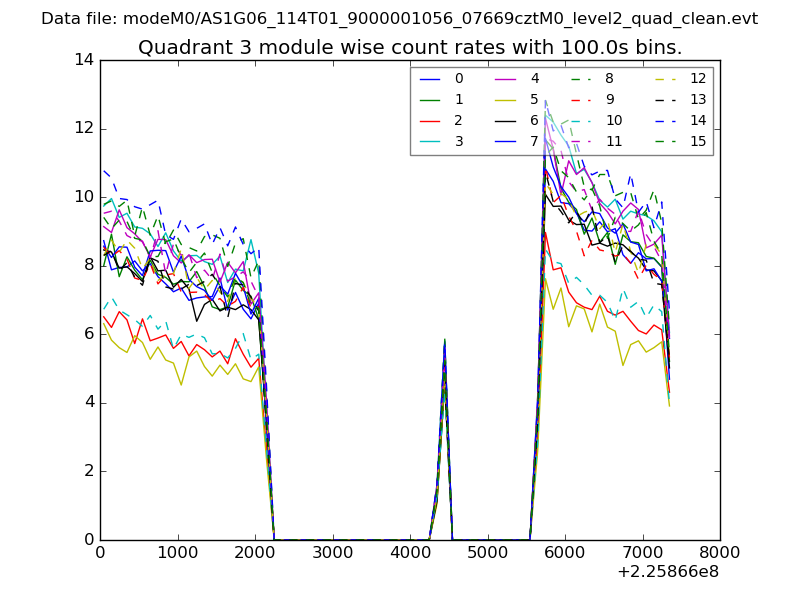
| Module-wise count rates for Quadrant A Data is divided into 100 sec bins |
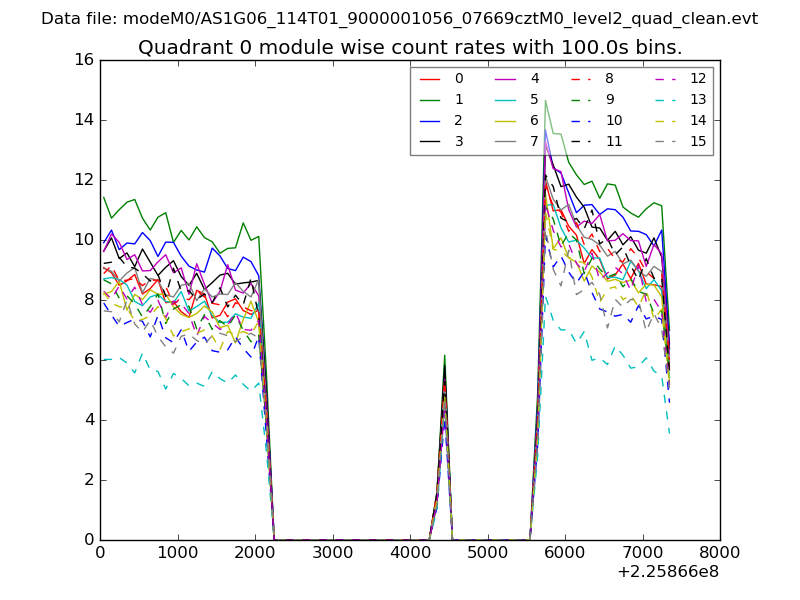 |
 |
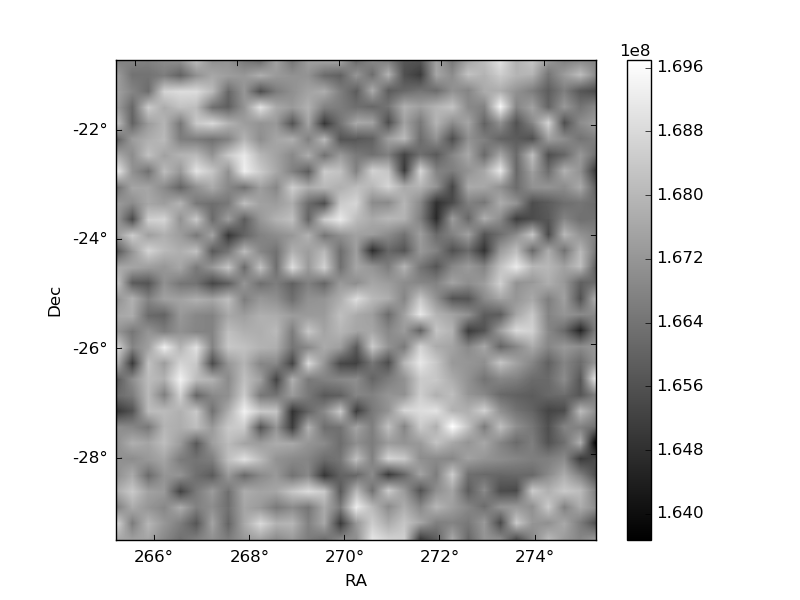
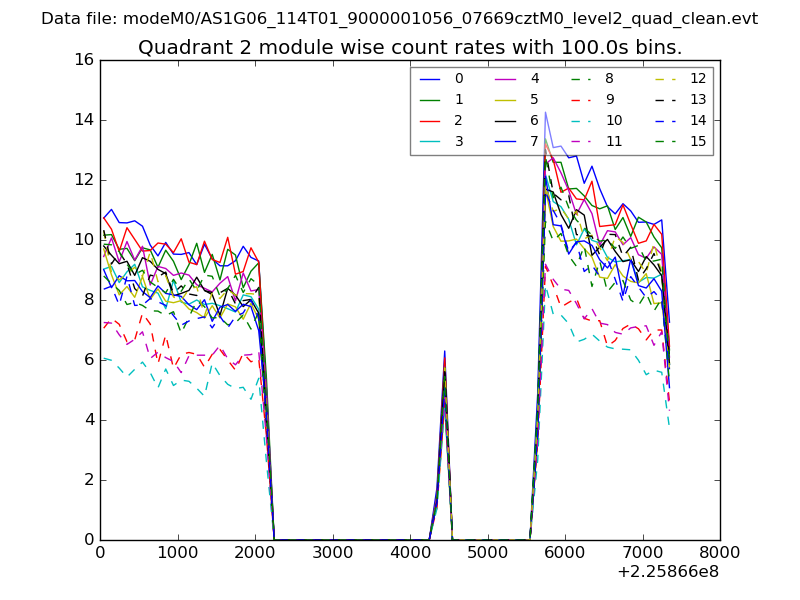
| Module-wise count rates for Quadrant B Data is divided into 100 sec bins |
 |
 |
| Module-wise count rates for Quadrant C Data is divided into 100 sec bins |
 |
 |
| Module-wise count rates for Quadrant D Data is divided into 100 sec bins |
 |
 |
| Parameter | Plot |
|---|---|
| CZT HV Monitor | 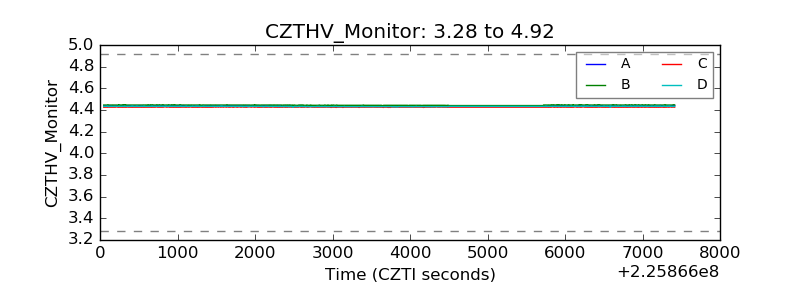 |
| D_VDD | 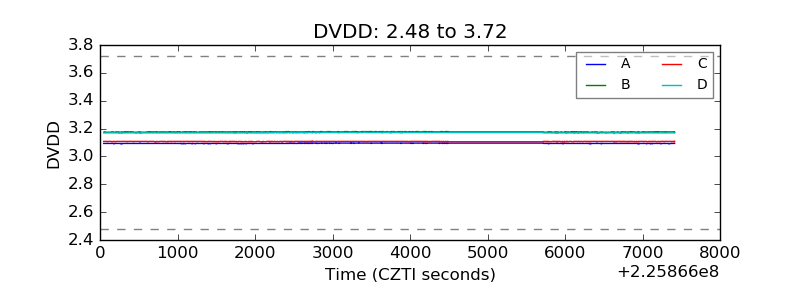 |
| Temperature 1 | 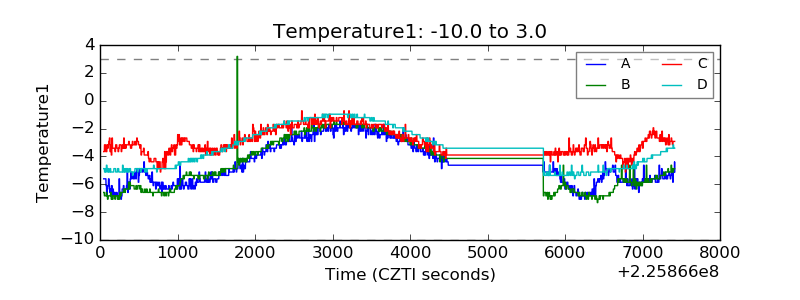 |
| Veto HV Monitor | 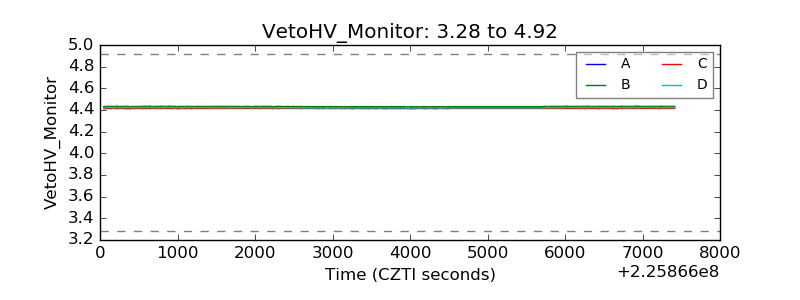 |
| Veto LLD | 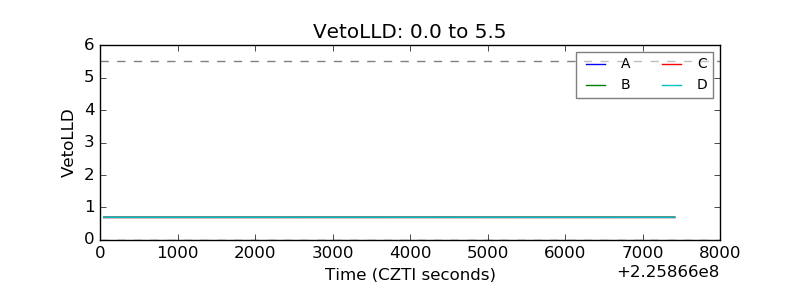 |
| Alpha Counter | 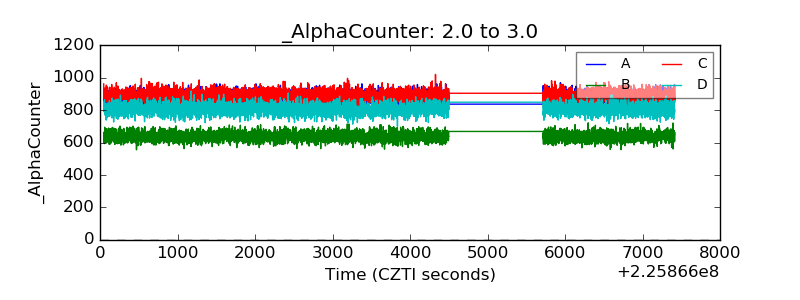 |
| _CPM_Rate | 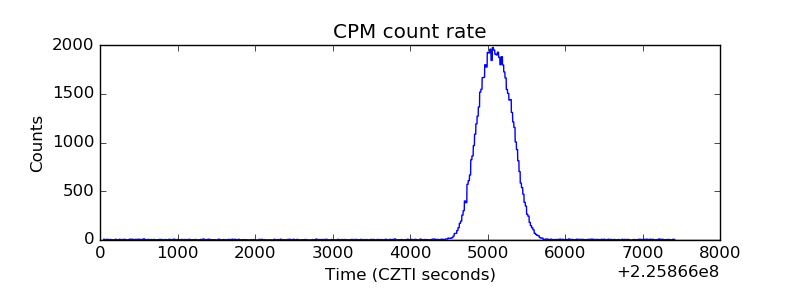 |
| CZT Counter | 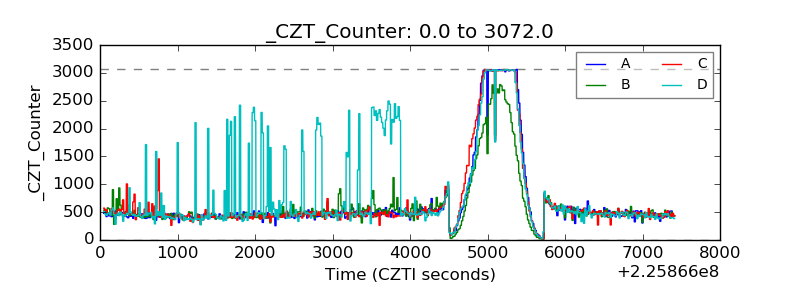 |
| +2.5 Volts monitor |  |
| +5 Volts monitor | 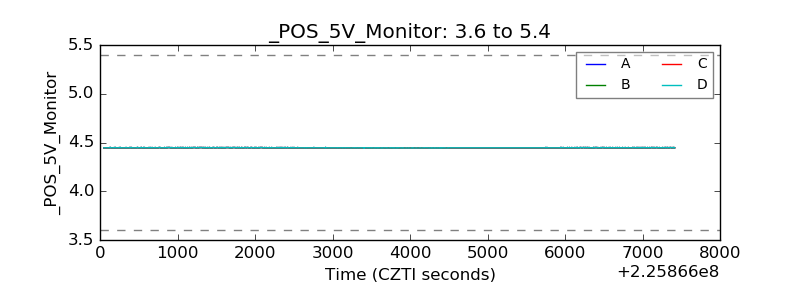 |
| _ROLL_ROT | 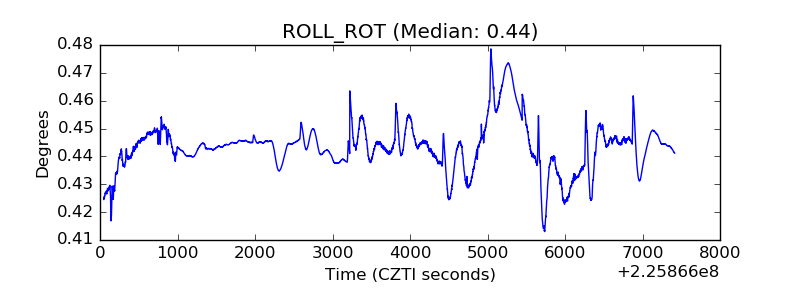 |
| _Roll_DEC | 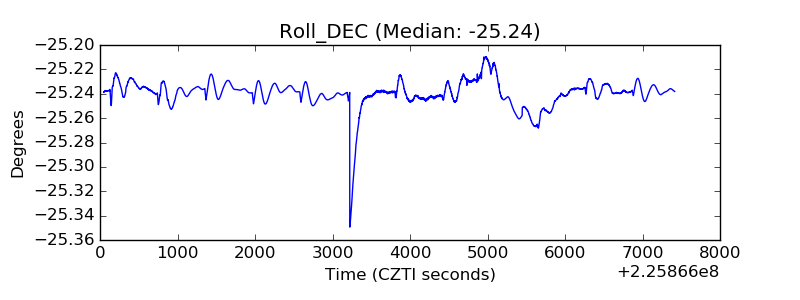 |
| _Roll_RA | 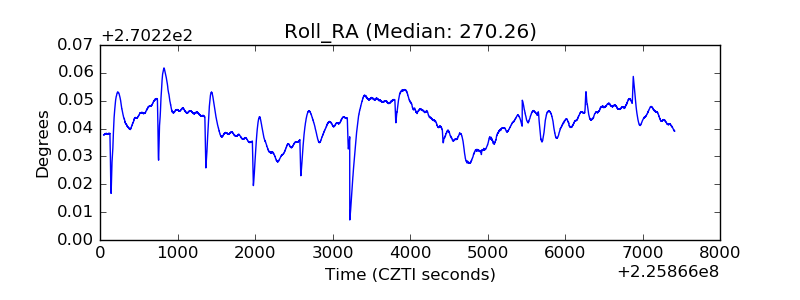 |
| Veto Counter | 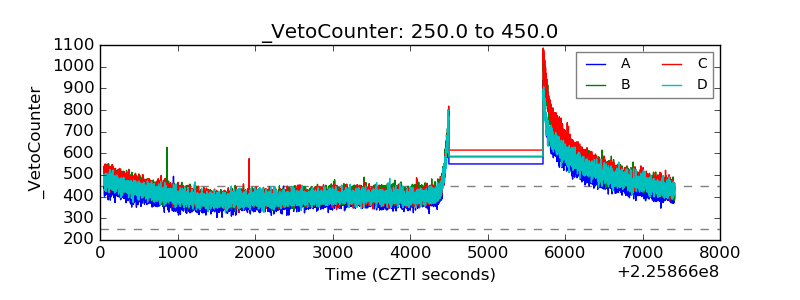 |