| Param | Original file | Final file |
|---|---|---|
| Filename | modeM0/AS1G06_114T01_9000001056_07670cztM0_level2.evt | modeM0/AS1G06_114T01_9000001056_07670cztM0_level2_quad_clean.evt |
| Size (bytes) | 69,168,960 | 22,754,880 |
| Size | 66.0 MB | 21.7 MB |
| Events in quadrant A | 501,979 | 150,996 |
| Events in quadrant B | 501,391 | 154,565 |
| Events in quadrant C | 506,293 | 152,699 |
| Events in quadrant D | 504,762 | 144,226 |
| Mode SS | |||
|---|---|---|---|
| Quadrant | BADHDUFLAG | Total packets | Discarded packets |
| A | 0 | 24 | 0 |
| B | 0 | 24 | 0 |
| C | 0 | 24 | 0 |
| D | 0 | 24 | 0 |
| Mode M0 | |||
|---|---|---|---|
| Quadrant | BADHDUFLAG | Total packets | Discarded packets |
| A | 0 | 2260 | 0 |
| B | 0 | 2259 | 0 |
| C | 0 | 2264 | 0 |
| D | 0 | 2309 | 0 |
| Quadrant | Total seconds | Saturated seconds | Saturation percentage |
|---|---|---|---|
| A | 1128 | 1 | 0.088652% |
| B | 1128 | 0 | 0.000000% |
| C | 1128 | 0 | 0.000000% |
| D | 1128 | 5 | 0.443262% |
Noise dominated data is calculated using 1-second bins in cleaned event files. If a bin has >2000 counts, and if more than 50% of those come from <1% of pixels, then it is considered to be noise-dominated and hence unusable.
| Quadrant | # 1 sec bins | Bins with >0 counts | Bins with >2000 counts | High rate bins dominated by noise | Noise dominated (total time) | Noise dominated (detector-on time) | Marked lightcurve |
|---|---|---|---|---|---|---|---|
| A | 1128 | 1128 | 0 | 0 | 0.00% | 0.00% | 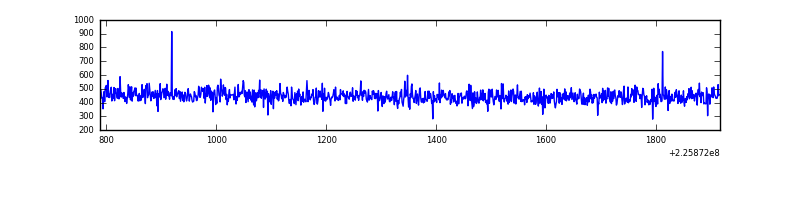 |
| B | 1128 | 1128 | 0 | 0 | 0.00% | 0.00% | 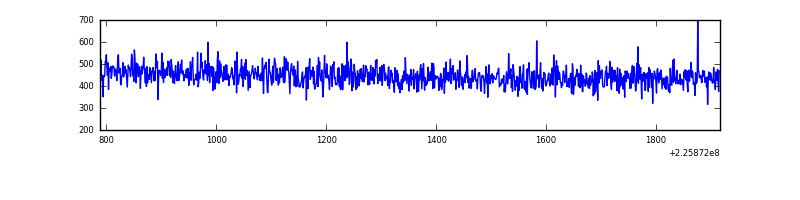 |
| C | 1128 | 1128 | 0 | 0 | 0.00% | 0.00% | 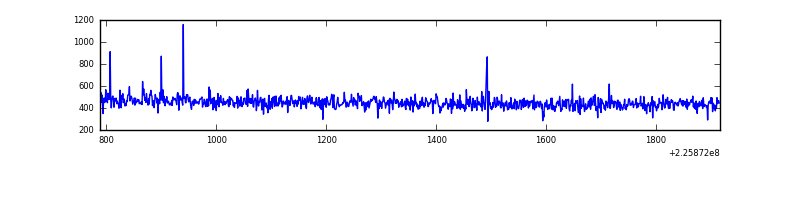 |
| D | 1128 | 1128 | 3 | 3 | 0.27% | 0.27% | 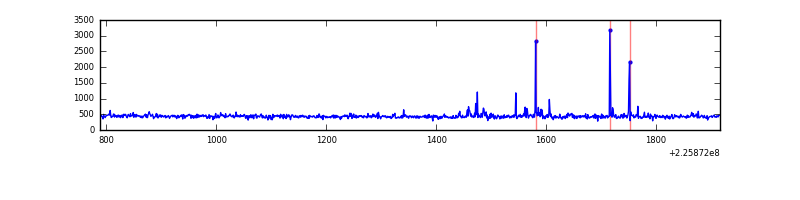 |
Top three noisy pixels from each quadrant. If the there are fewer than three noisy pixels in the level2.evt file, extra rows are filled as -1
| Pixel properties | Quadrant properties | ||||||
|---|---|---|---|---|---|---|---|
| Quadrant | DetID | PixID | Counts | Sigma | Mean | Median | Sigma |
| A | 0 | 226 | 1207 | 38.01 | 130 | 127 | 28.4 |
| A | 12 | 194 | 1137 | 35.55 | 130 | 127 | 28.4 |
| A | 3 | 137 | 481 | 12.46 | 130 | 127 | 28.4 |
| B | 12 | 111 | 2468 | 88.59 | 129 | 127 | 26.4 |
| B | 11 | 111 | 1899 | 67.06 | 129 | 127 | 26.4 |
| B | 14 | 111 | 1392 | 47.87 | 129 | 127 | 26.4 |
| C | 12 | 4 | 3095 | 94.13 | 128 | 129 | 31.5 |
| C | 13 | 61 | 981 | 27.04 | 128 | 129 | 31.5 |
| C | 8 | 222 | 409 | 8.89 | 128 | 129 | 31.5 |
| D | 13 | 104 | 23609 | 714.9 | 127 | 124 | 32.9 |
| D | 5 | 233 | 3330 | 97.59 | 127 | 124 | 32.9 |
| D | 14 | 226 | 1342 | 37.08 | 127 | 124 | 32.9 |
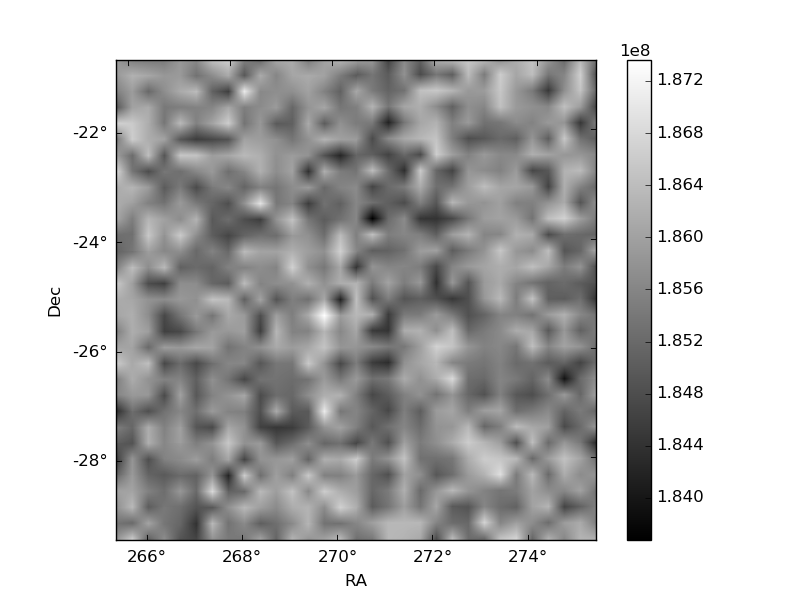
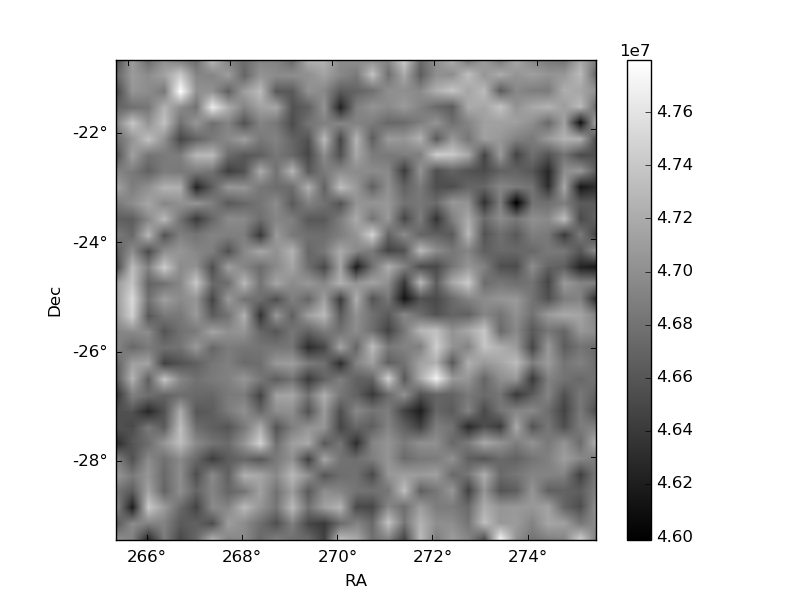
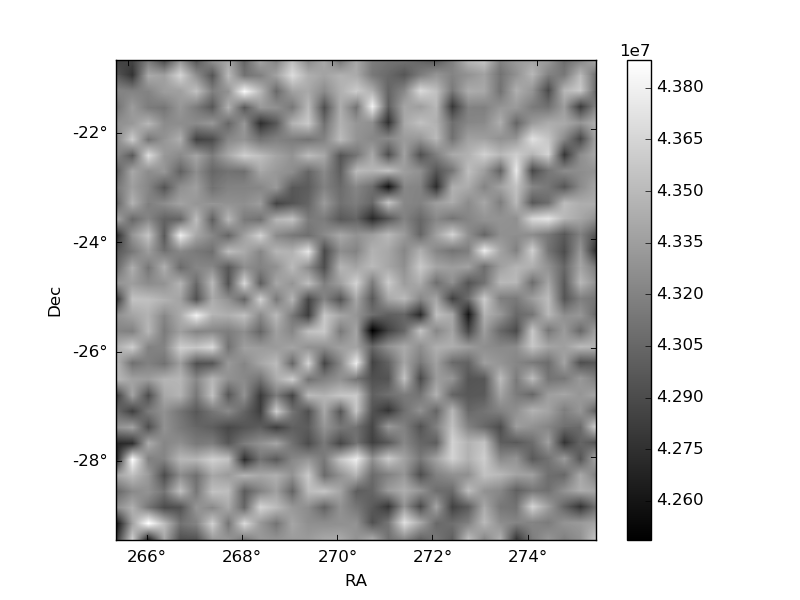
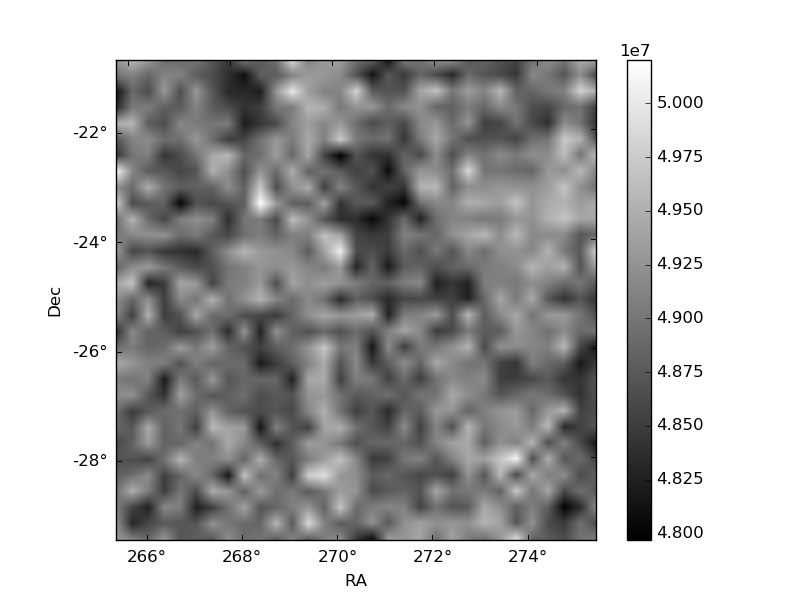
Histogram calculated using DETX and DETY for each event in the final _common_clean file
| Quadrant A | 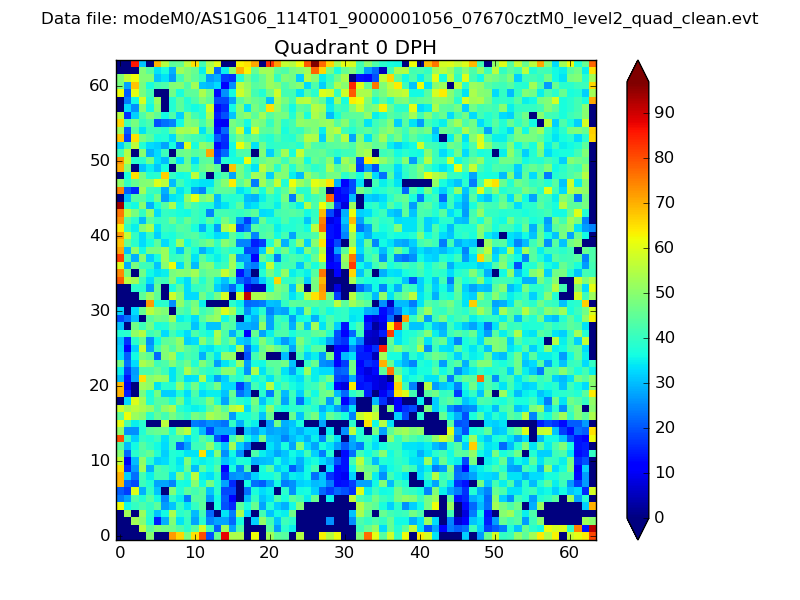 |
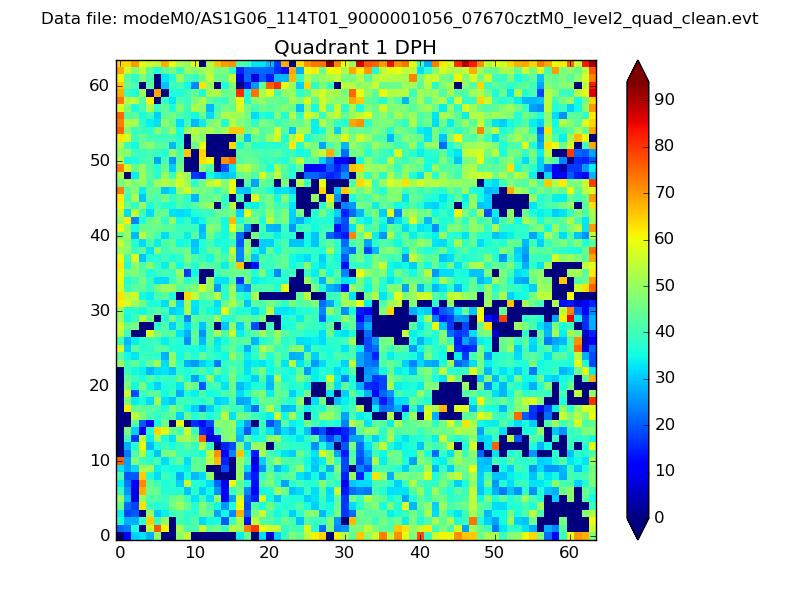 |
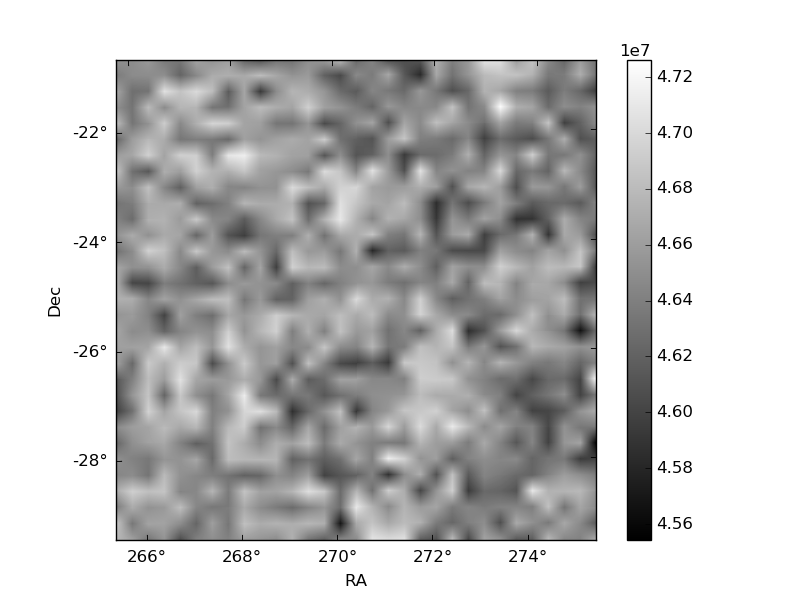
Quadrant B |
|---|---|---|---|
| Quadrant D | 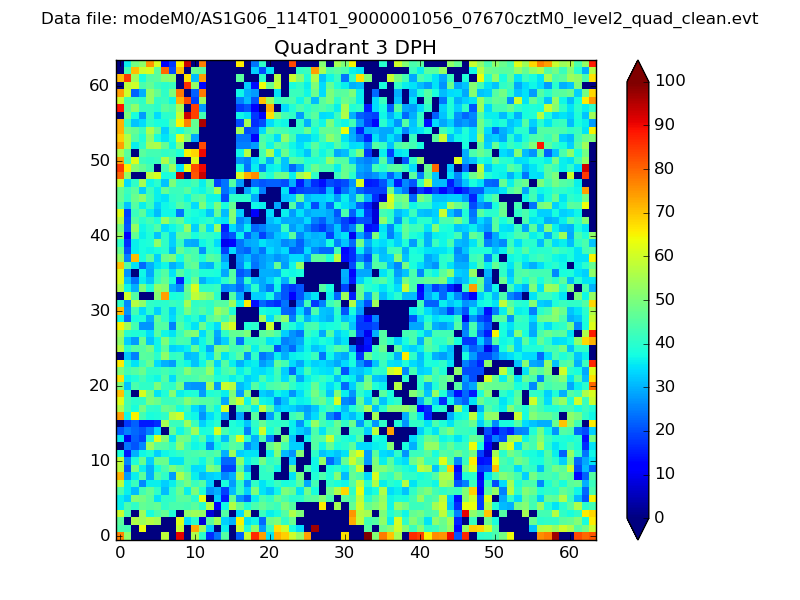 |
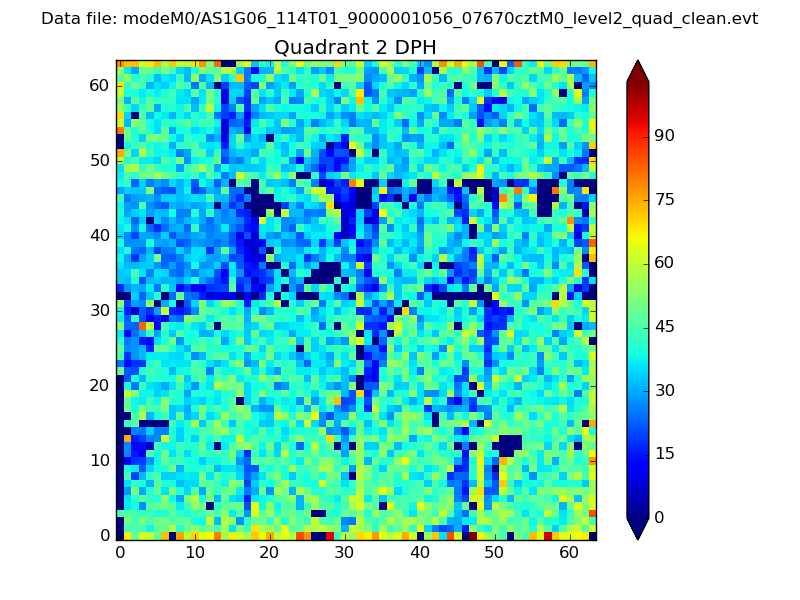 |
Quadrant C |
| Plot type | Count rate plots | Images |
|---|---|---|
| Comparison with Poisson distribution Blue bars denote a histogram of data divided into 1 sec bins. Red curve is a Poisson curve with rate = median count rate of data. |
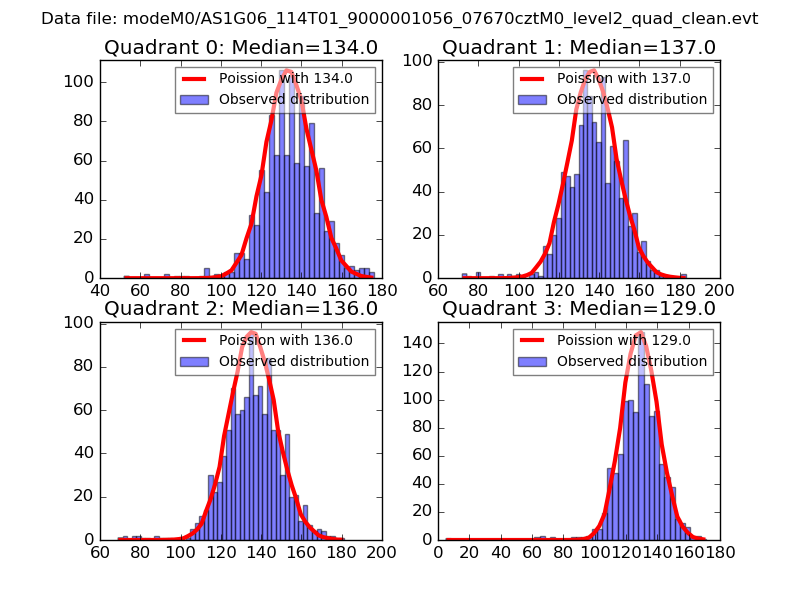 |
 |
| Quadrant-wise count rates Data is divided into 100 sec bins |
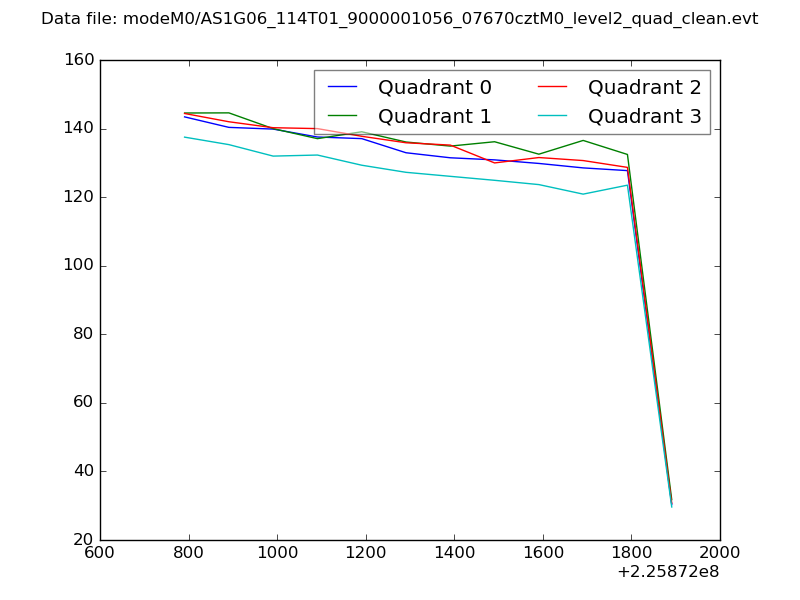 |
|
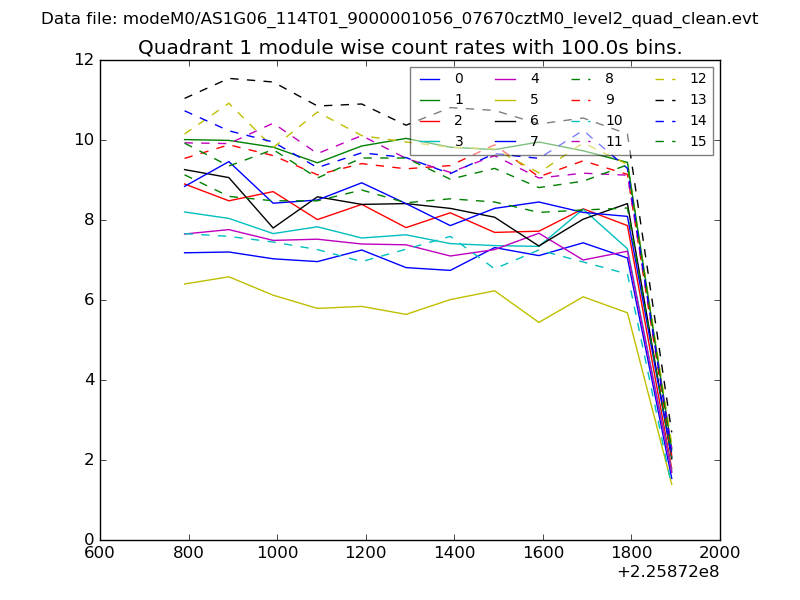
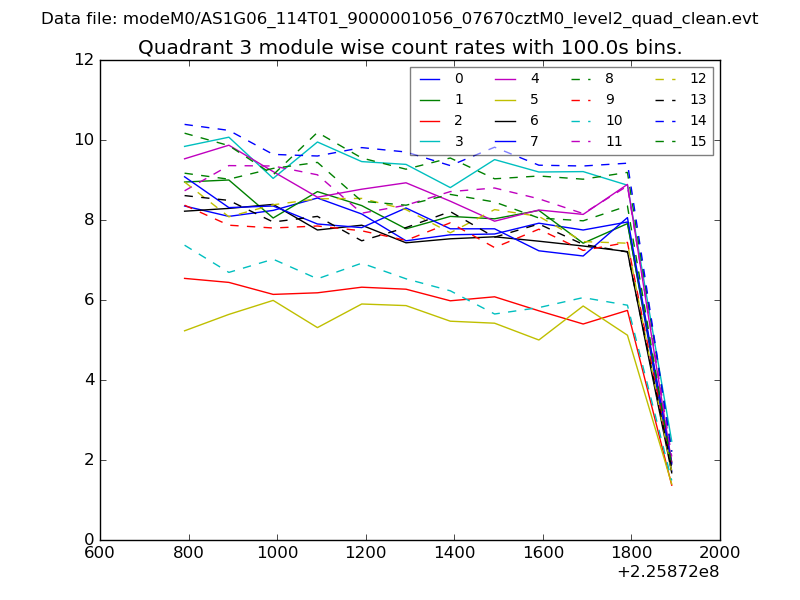
| Module-wise count rates for Quadrant A Data is divided into 100 sec bins |
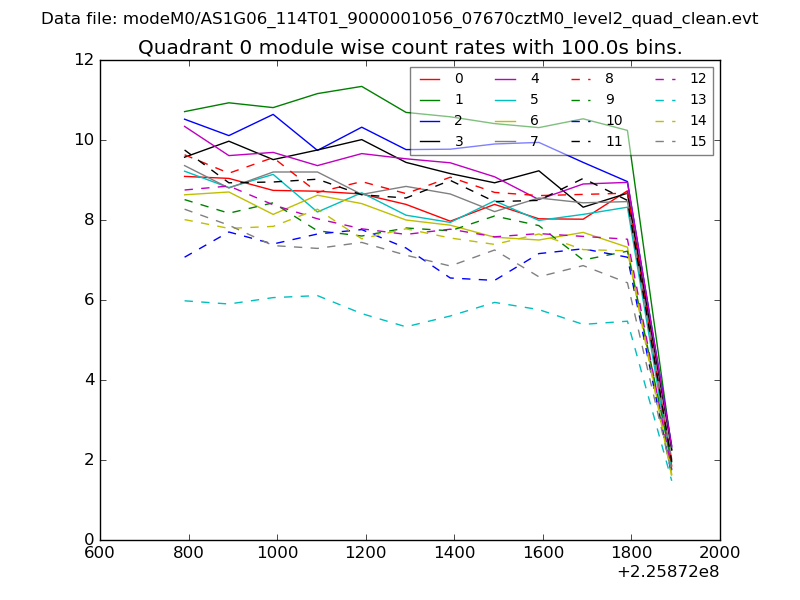 |
 |
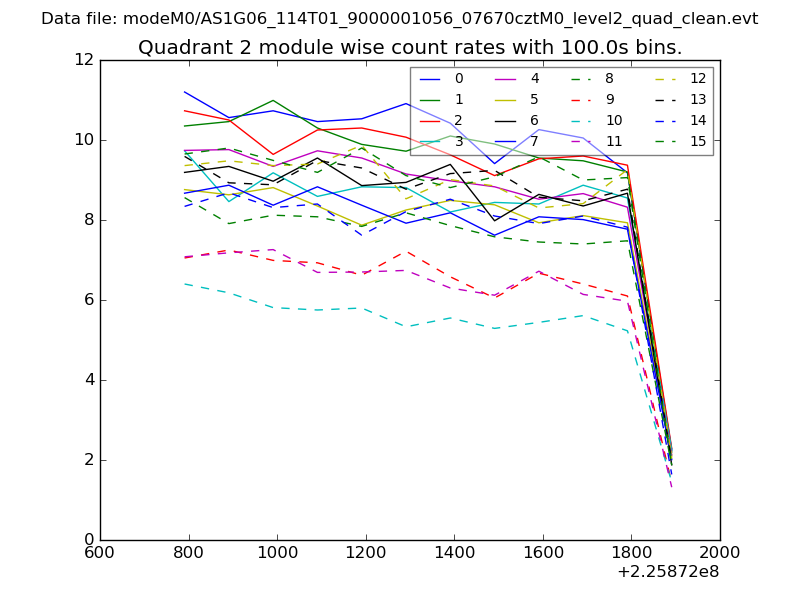
| Module-wise count rates for Quadrant B Data is divided into 100 sec bins |
 |
 |
| Module-wise count rates for Quadrant C Data is divided into 100 sec bins |
 |
 |
| Module-wise count rates for Quadrant D Data is divided into 100 sec bins |
 |
 |
| Parameter | Plot |
|---|---|
| CZT HV Monitor | 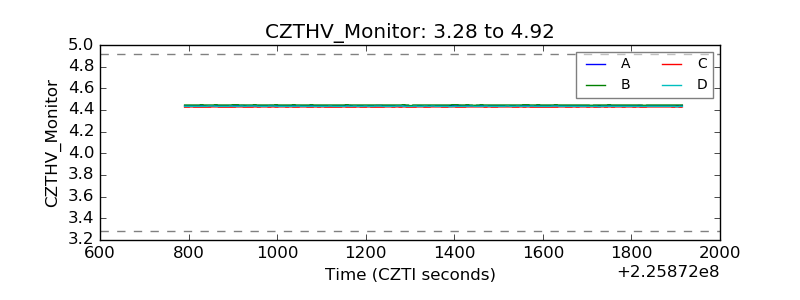 |
| D_VDD | 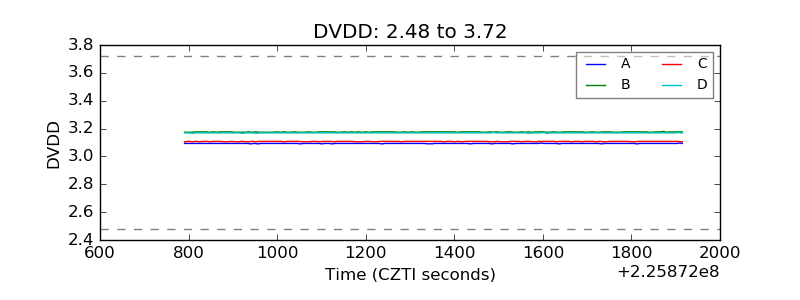 |
| Temperature 1 |  |
| Veto HV Monitor | 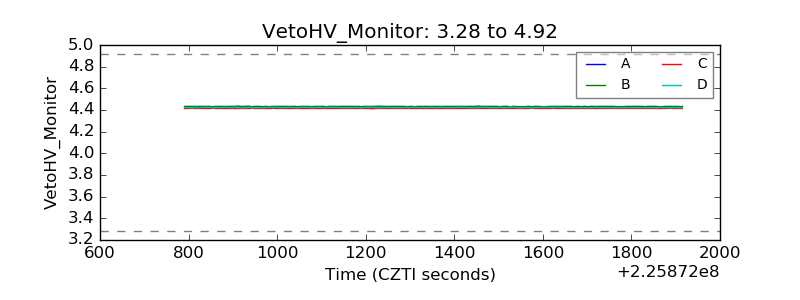 |
| Veto LLD | 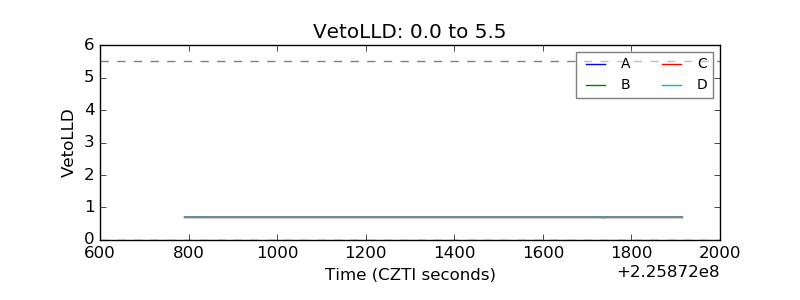 |
| Alpha Counter | 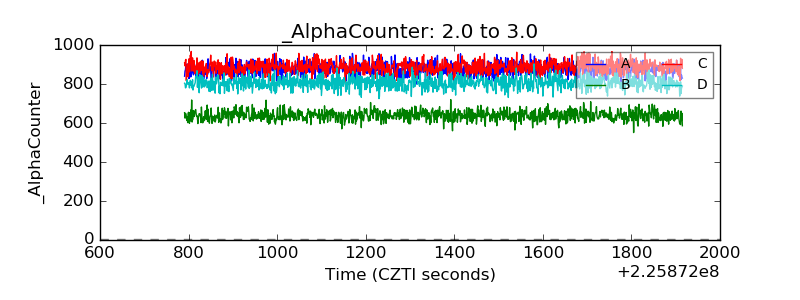 |
| _CPM_Rate | 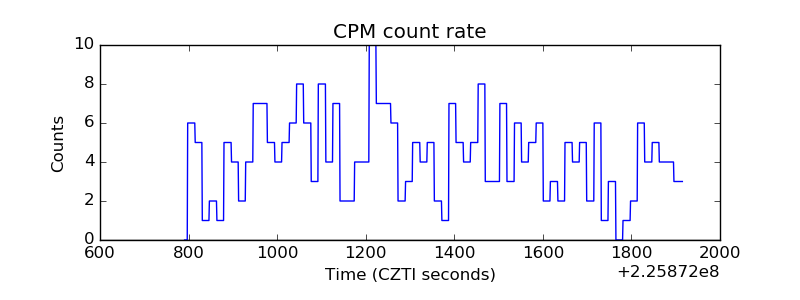 |
| CZT Counter | 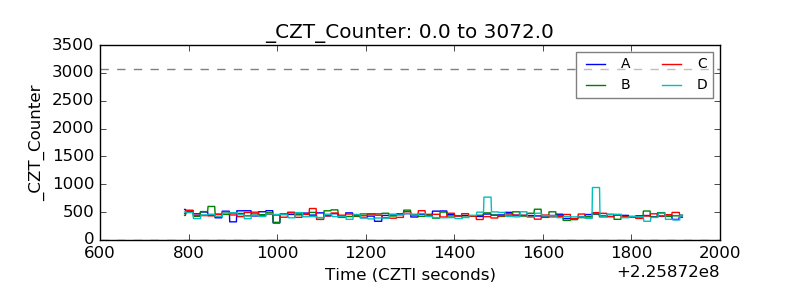 |
| +2.5 Volts monitor |  |
| +5 Volts monitor | 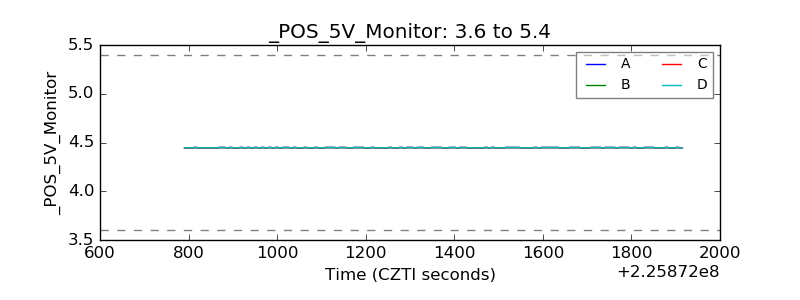 |
| _ROLL_ROT | 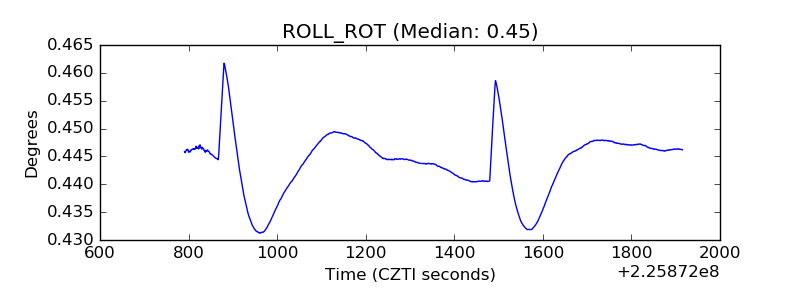 |
| _Roll_DEC | 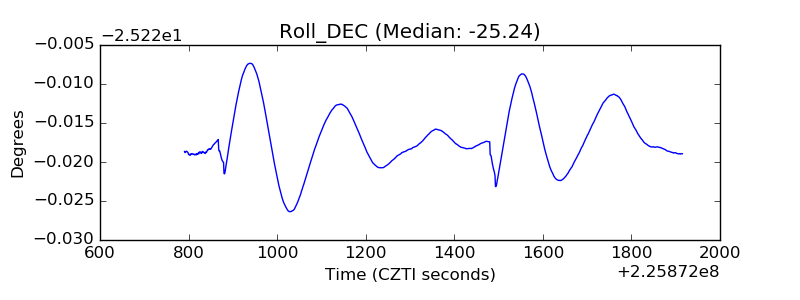 |
| _Roll_RA | 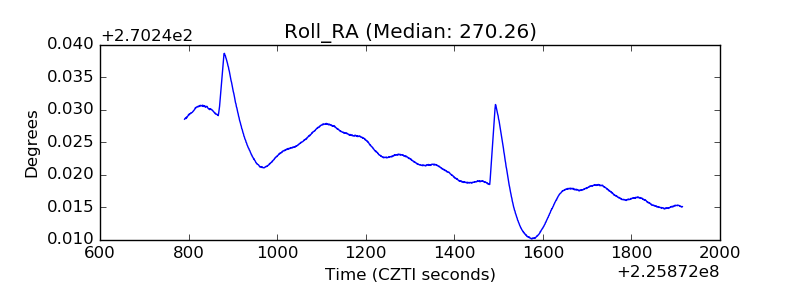 |
| Veto Counter | 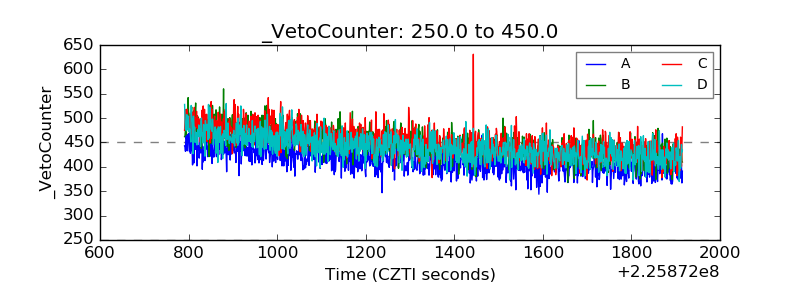 |