| Param | Original file | Final file |
|---|---|---|
| Filename | modeM0/AS1A02_029T01_9000001058cztM0_level2.fits | modeM0/AS1A02_029T01_9000001058cztM0_level2_quad_clean.evt |
| Size (bytes) | 494,043,840 | 414,838,080 |
| Size | 471.2 MB | 395.6 MB |
| Events in quadrant A | 3,074,994 | 2,537,229 |
| Events in quadrant B | 2,965,994 | 2,531,725 |
| Events in quadrant C | 2,597,324 | 1,615,813 |
| Events in quadrant D | 2,621,844 | 2,183,037 |
| Mode M9 | |||
|---|---|---|---|
| Quadrant | BADHDUFLAG | Total packets | Discarded packets |
| A | 0 | 76 | 0 |
| B | 0 | 76 | 0 |
| C | 0 | 76 | 0 |
| D | 0 | 76 | 0 |
| Mode M0 | |||
|---|---|---|---|
| Quadrant | BADHDUFLAG | Total packets | Discarded packets |
| A | 0 | 111129 | 0 |
| B | 0 | 116568 | 0 |
| C | 0 | 234369 | 0 |
| D | 0 | 133081 | 0 |
| Mode SS | |||
|---|---|---|---|
| Quadrant | BADHDUFLAG | Total packets | Discarded packets |
| A | 0 | 1098 | 0 |
| B | 0 | 1098 | 0 |
| C | 0 | 1098 | 0 |
| D | 0 | 1098 | 0 |
| Quadrant | Total seconds | Saturated seconds | Saturation percentage |
|---|---|---|---|
| A | 53837 | 807 | 1.498969% |
| B | 53837 | 1174 | 2.180656% |
| C | 53837 | 15927 | 29.583744% |
| D | 53837 | 1809 | 3.360143% |
Noise dominated data is calculated using 1-second bins in cleaned event files. If a bin has >2000 counts, and if more than 50% of those come from <1% of pixels, then it is considered to be noise-dominated and hence unusable.
| Quadrant | # 1 sec bins | Bins with >0 counts | Bins with >2000 counts | High rate bins dominated by noise | Noise dominated (total time) | Noise dominated (detector-on time) | Marked lightcurve |
|---|---|---|---|---|---|---|---|
| A | 61377 | 53836 | 0 | 0 | 0.00% | 0.00% | 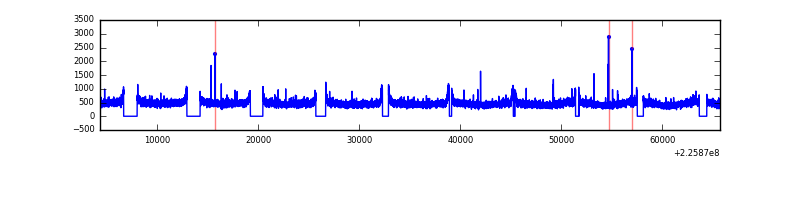 |
| B | 61377 | 53831 | 0 | 0 | 0.00% | 0.00% |  |
| C | 61377 | 53722 | 0 | 0 | 0.00% | 0.00% | 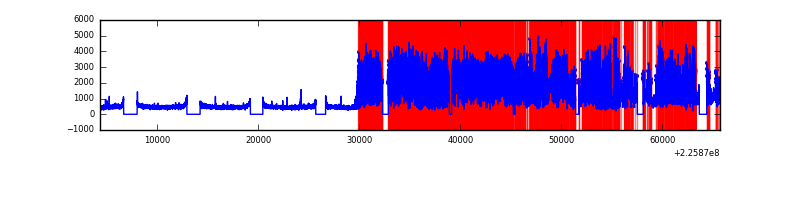 |
| D | 61377 | 53831 | 0 | 0 | 0.00% | 0.00% | 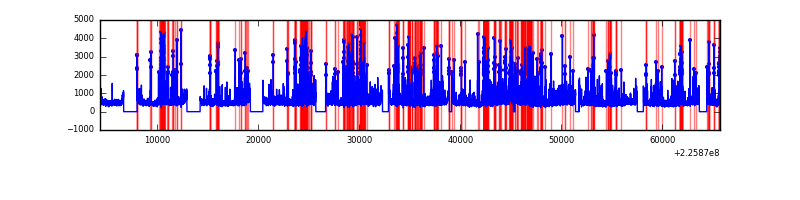 |
Top three noisy pixels from each quadrant. If the there are fewer than three noisy pixels in the level2.evt file, extra rows are filled as -1
| Pixel properties | Quadrant properties | ||||||
|---|---|---|---|---|---|---|---|
| Quadrant | DetID | PixID | Counts | Sigma | Mean | Median | Sigma |
| A | 0 | 29 | 3007 | 11.13 | 800 | 746 | 203.1 |
| A | 7 | 110 | 2586 | 9.06 | 800 | 746 | 203.1 |
| A | 0 | 30 | 2376 | 8.03 | 800 | 746 | 203.1 |
| B | 2 | 9 | 2528 | 11.41 | 781 | 741 | 156.6 |
| B | 14 | 254 | 2041 | 8.3 | 781 | 741 | 156.6 |
| B | 12 | 226 | 1995 | 8.01 | 781 | 741 | 156.6 |
| C | 1 | 80 | 1936 | 7.19 | 686 | 636 | 180.8 |
| C | 1 | 81 | 1915 | 7.08 | 686 | 636 | 180.8 |
| C | 12 | 241 | 1807 | 6.48 | 686 | 636 | 180.8 |
| D | 1 | 19 | 1865 | 5.92 | 748 | 679 | 200.3 |
| D | 7 | 3 | 1838 | 5.79 | 748 | 679 | 200.3 |
| D | 15 | 47 | 1824 | 5.72 | 748 | 679 | 200.3 |
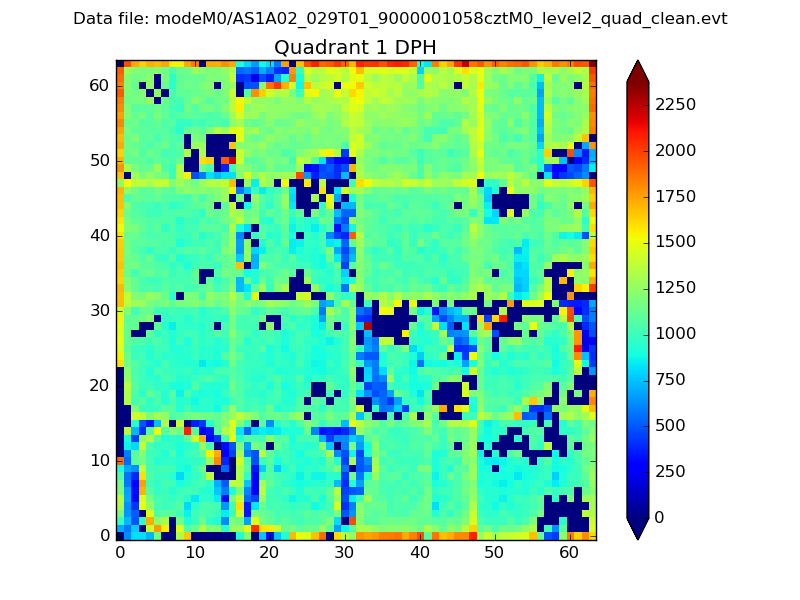
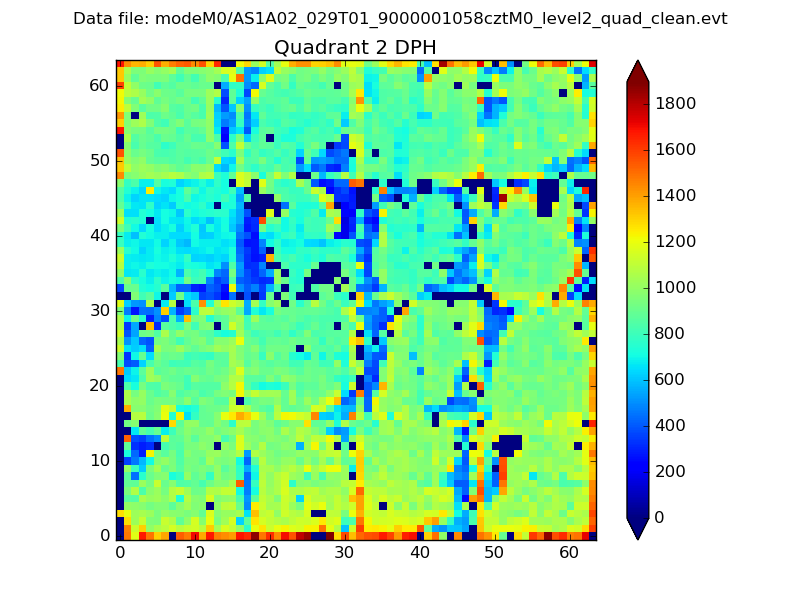
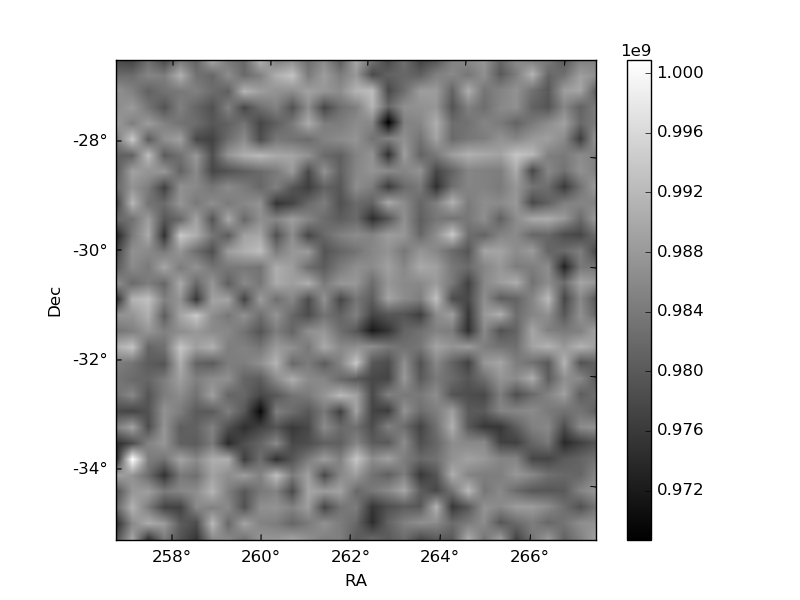
Histogram calculated using DETX and DETY for each event in the final _common_clean file
| Quadrant A |  |
 |
Quadrant B |
|---|---|---|---|
| Quadrant D | 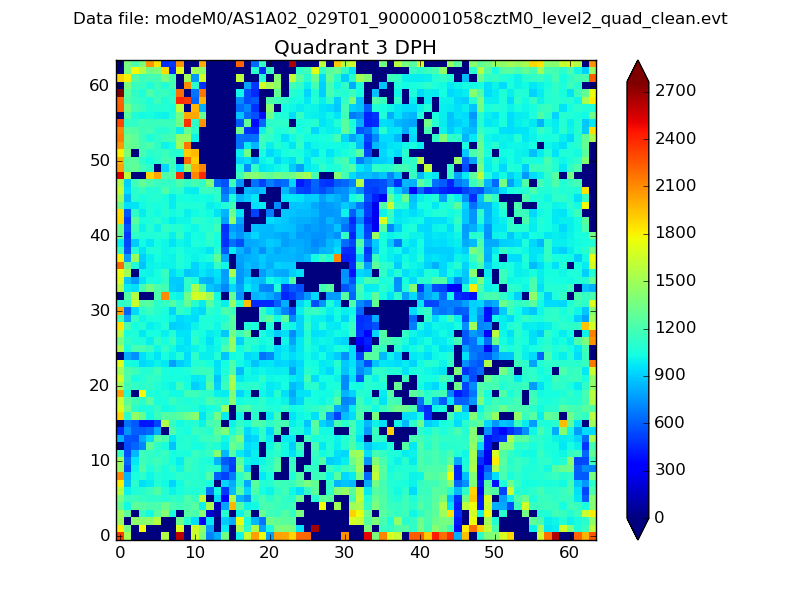 |
 |
Quadrant C |
| Plot type | Count rate plots | Images |
|---|---|---|
| Comparison with Poisson distribution Blue bars denote a histogram of data divided into 1 sec bins. Red curve is a Poisson curve with rate = median count rate of data. |
 |
 |
| Quadrant-wise count rates Data is divided into 100 sec bins |
 |
|
| Module-wise count rates for Quadrant A Data is divided into 100 sec bins |
 |
 |
| Module-wise count rates for Quadrant B Data is divided into 100 sec bins |
 |
 |
| Module-wise count rates for Quadrant C Data is divided into 100 sec bins |
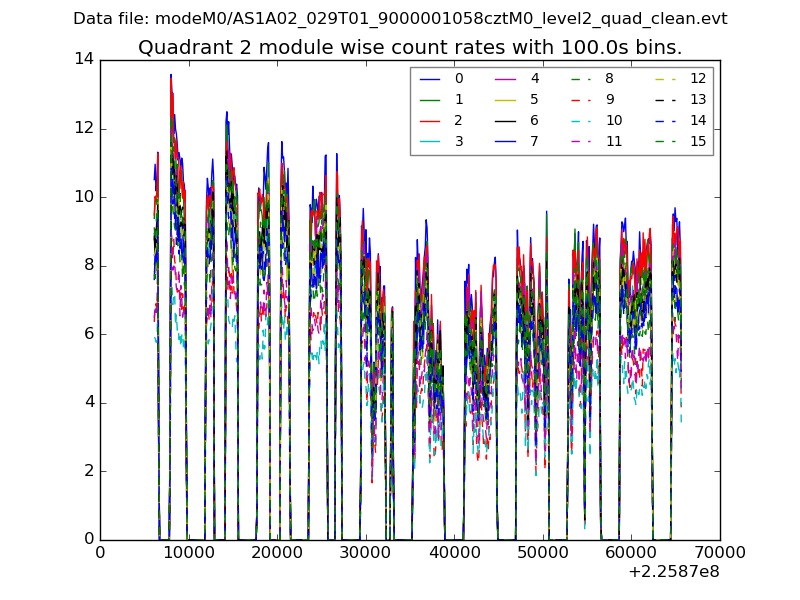 |
 |
| Module-wise count rates for Quadrant D Data is divided into 100 sec bins |
 |
 |
| Parameter | Plot |
|---|---|
| CZT HV Monitor |  |
| D_VDD |  |
| Temperature 1 |  |
| Veto HV Monitor |  |
| Veto LLD | 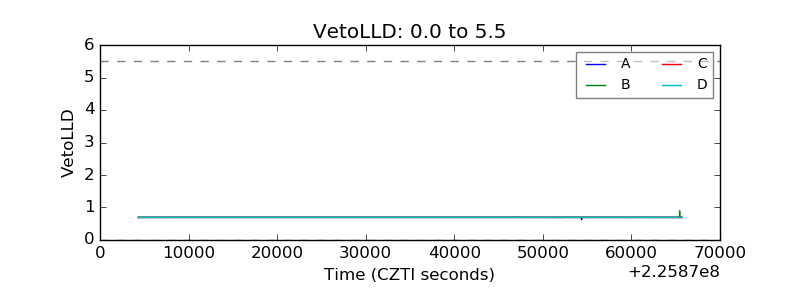 |
| Alpha Counter |  |
| _CPM_Rate |  |
| CZT Counter |  |
| +2.5 Volts monitor |  |
| +5 Volts monitor |  |
| _ROLL_ROT |  |
| _Roll_DEC |  |
| _Roll_RA |  |
| Veto Counter |  |