| Param | Original file | Final file |
|---|---|---|
| Filename | modeM0/AS1A02_029T01_9000001058_07671cztM0_level2.evt | modeM0/AS1A02_029T01_9000001058_07671cztM0_level2_quad_clean.evt |
| Size (bytes) | 606,585,600 | 107,199,360 |
| Size | 578.5 MB | 102.2 MB |
| Events in quadrant A | 4,265,215 | 671,349 |
| Events in quadrant B | 4,526,399 | 680,572 |
| Events in quadrant C | 4,204,755 | 667,045 |
| Events in quadrant D | 4,796,663 | 635,894 |
| Mode M9 | |||
|---|---|---|---|
| Quadrant | BADHDUFLAG | Total packets | Discarded packets |
| A | 0 | 27 | 0 |
| B | 0 | 27 | 0 |
| C | 0 | 27 | 0 |
| D | 0 | 27 | 0 |
| Mode M0 | |||
|---|---|---|---|
| Quadrant | BADHDUFLAG | Total packets | Discarded packets |
| A | 0 | 17712 | 3 |
| B | 0 | 18458 | 2 |
| C | 0 | 17706 | 2 |
| D | 0 | 19547 | 2 |
| Mode SS | |||
|---|---|---|---|
| Quadrant | BADHDUFLAG | Total packets | Discarded packets |
| A | 0 | 174 | 0 |
| B | 0 | 174 | 0 |
| C | 0 | 174 | 0 |
| D | 0 | 174 | 0 |
| Quadrant | Total seconds | Saturated seconds | Saturation percentage |
|---|---|---|---|
| A | 8520 | 74 | 0.868545% |
| B | 8520 | 129 | 1.514085% |
| C | 8520 | 59 | 0.692488% |
| D | 8520 | 153 | 1.795775% |
Noise dominated data is calculated using 1-second bins in cleaned event files. If a bin has >2000 counts, and if more than 50% of those come from <1% of pixels, then it is considered to be noise-dominated and hence unusable.
| Quadrant | # 1 sec bins | Bins with >0 counts | Bins with >2000 counts | High rate bins dominated by noise | Noise dominated (total time) | Noise dominated (detector-on time) | Marked lightcurve |
|---|---|---|---|---|---|---|---|
| A | 11175 | 8522 | 0 | 0 | 0.00% | 0.00% |  |
| B | 11175 | 8522 | 12 | 12 | 0.11% | 0.14% | 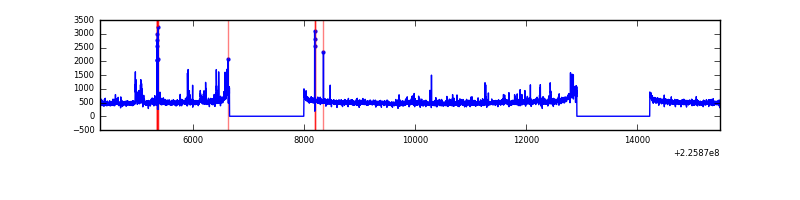 |
| C | 11175 | 8522 | 0 | 0 | 0.00% | 0.00% | 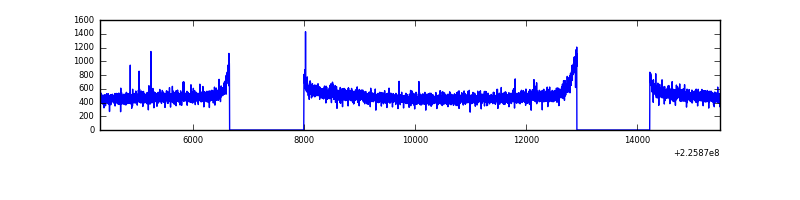 |
| D | 11175 | 8522 | 78 | 78 | 0.70% | 0.92% | 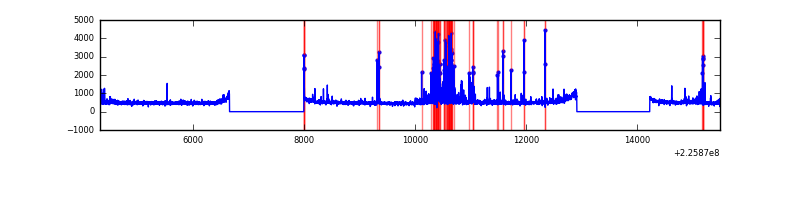 |
Top three noisy pixels from each quadrant. If the there are fewer than three noisy pixels in the level2.evt file, extra rows are filled as -1
| Pixel properties | Quadrant properties | ||||||
|---|---|---|---|---|---|---|---|
| Quadrant | DetID | PixID | Counts | Sigma | Mean | Median | Sigma |
| A | 0 | 226 | 10766 | 43.3 | 1107 | 1086 | 223.6 |
| A | 12 | 194 | 9796 | 38.96 | 1107 | 1086 | 223.6 |
| A | 15 | 234 | 4867 | 16.91 | 1107 | 1086 | 223.6 |
| B | 4 | 239 | 56955 | 271.35 | 1101 | 1077 | 205.9 |
| B | 10 | 245 | 42647 | 201.87 | 1101 | 1077 | 205.9 |
| B | 0 | 214 | 41044 | 194.09 | 1101 | 1077 | 205.9 |
| C | 13 | 61 | 8232 | 28.73 | 1074 | 1082 | 248.9 |
| C | 9 | 68 | 5923 | 19.45 | 1074 | 1082 | 248.9 |
| C | 8 | 222 | 5069 | 16.02 | 1074 | 1082 | 248.9 |
| D | 12 | 0 | 318456 | 1210.14 | 1079 | 1050 | 262.3 |
| D | 5 | 233 | 91105 | 343.34 | 1079 | 1050 | 262.3 |
| D | 2 | 152 | 88963 | 335.18 | 1079 | 1050 | 262.3 |
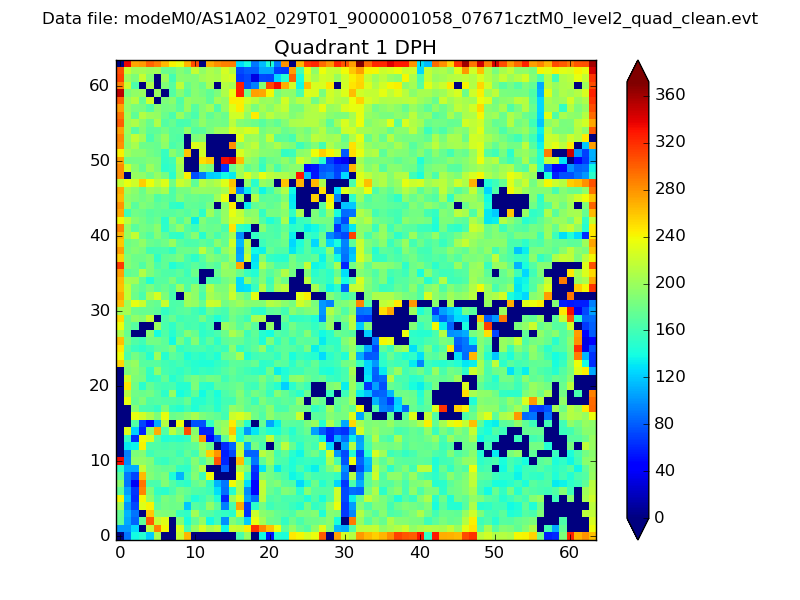
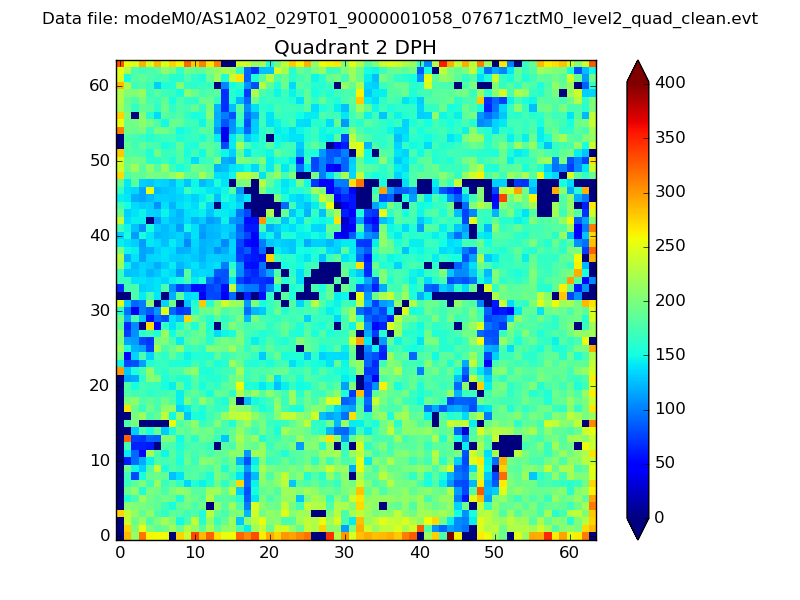
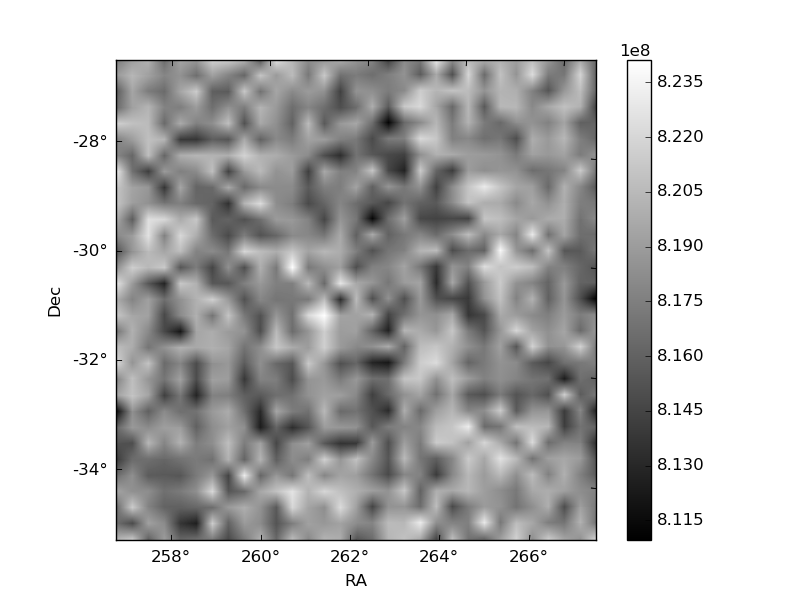
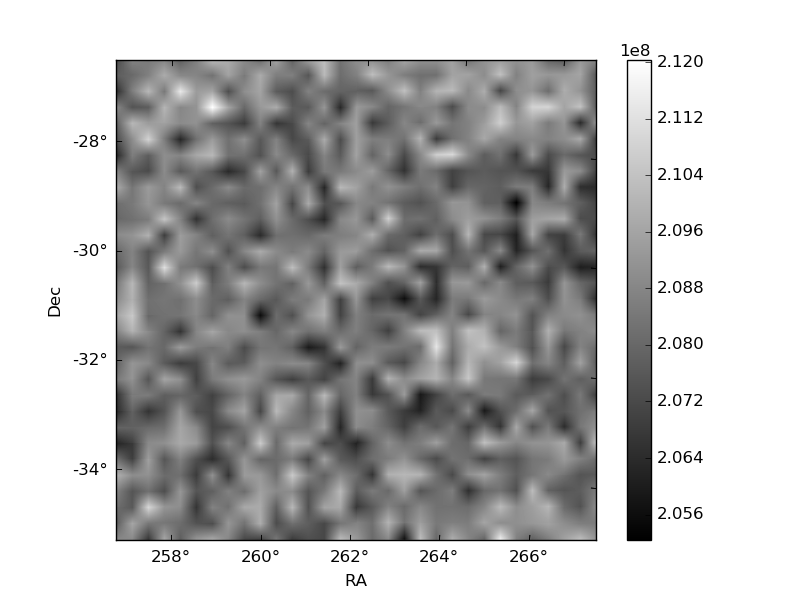
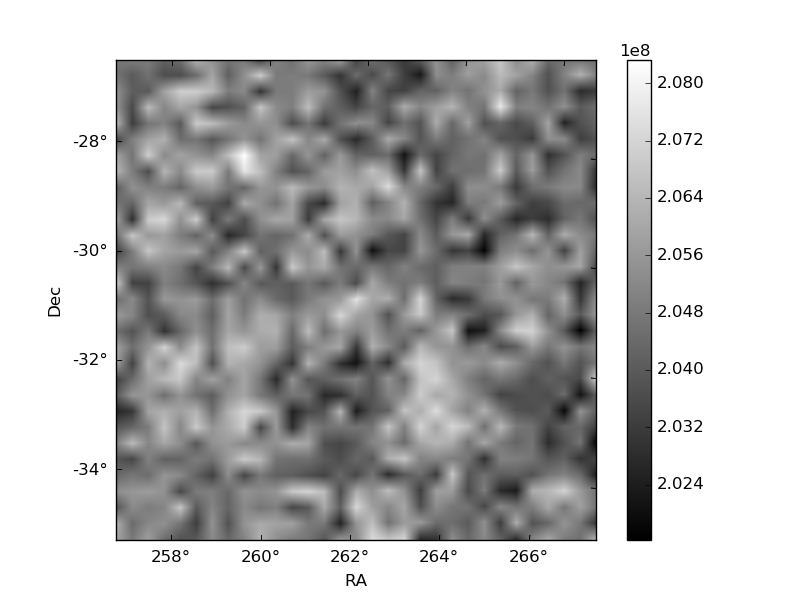
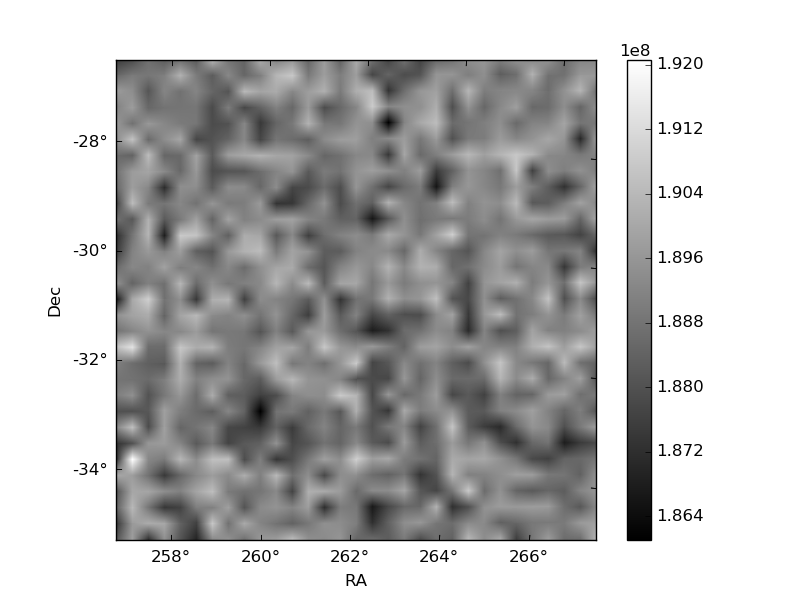
Histogram calculated using DETX and DETY for each event in the final _common_clean file
| Quadrant A | 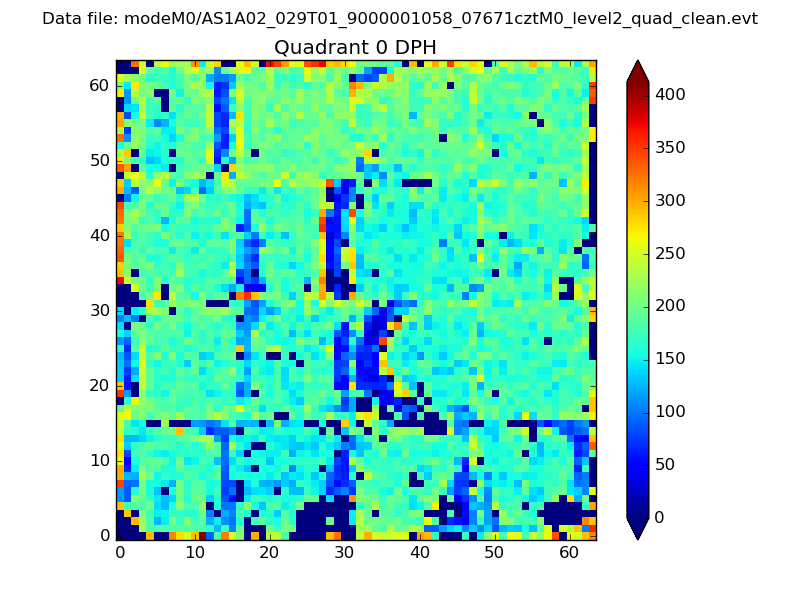 |
 |
Quadrant B |
|---|---|---|---|
| Quadrant D | 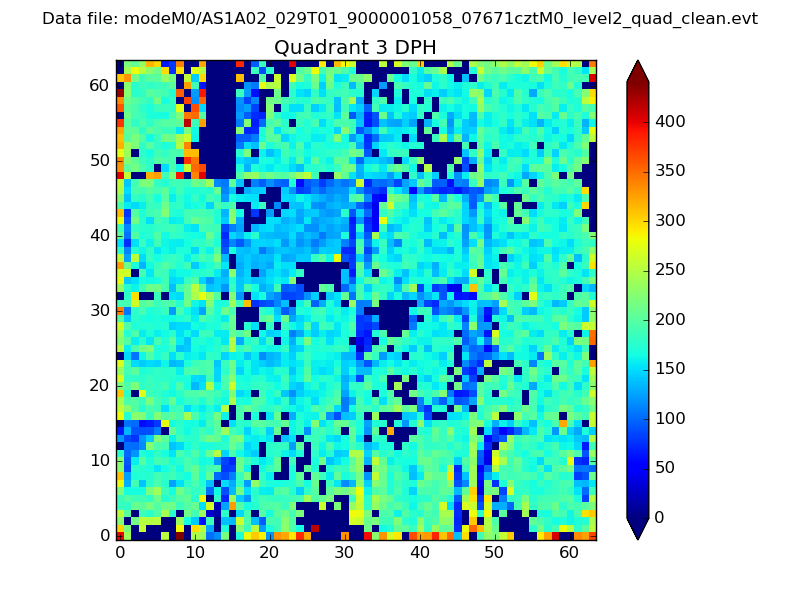 |
 |
Quadrant C |
| Plot type | Count rate plots | Images |
|---|---|---|
| Comparison with Poisson distribution Blue bars denote a histogram of data divided into 1 sec bins. Red curve is a Poisson curve with rate = median count rate of data. |
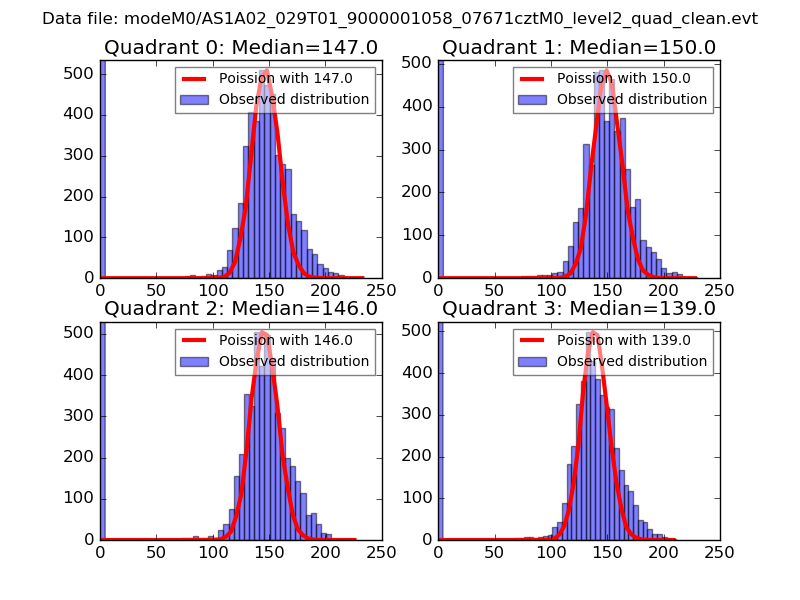 |
 |
| Quadrant-wise count rates Data is divided into 100 sec bins |
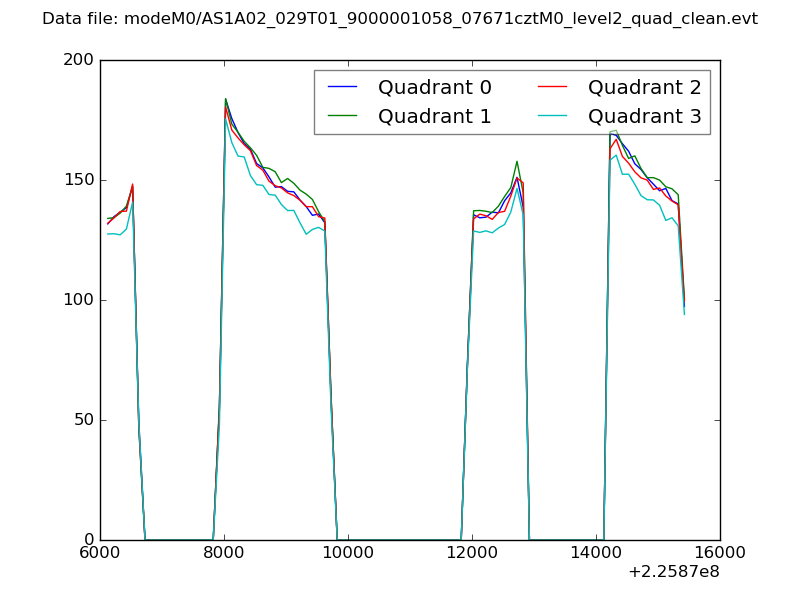 |
|
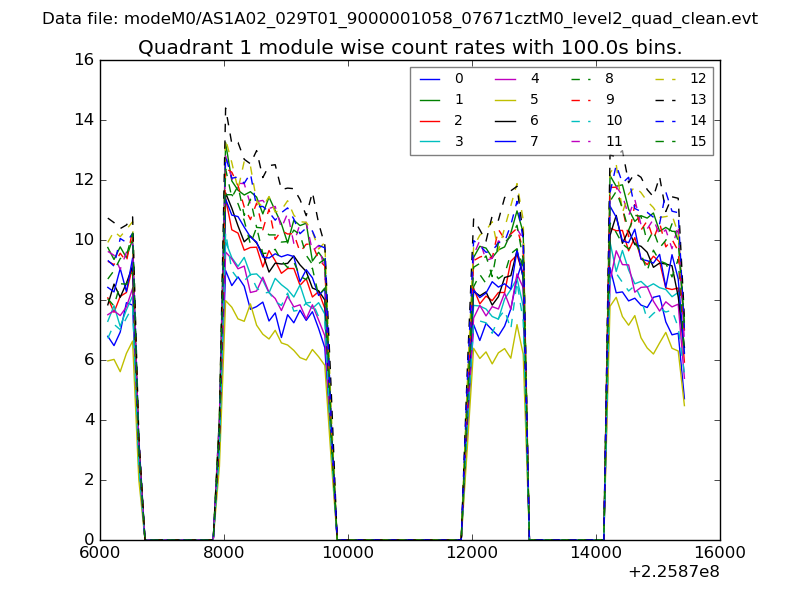
| Module-wise count rates for Quadrant A Data is divided into 100 sec bins |
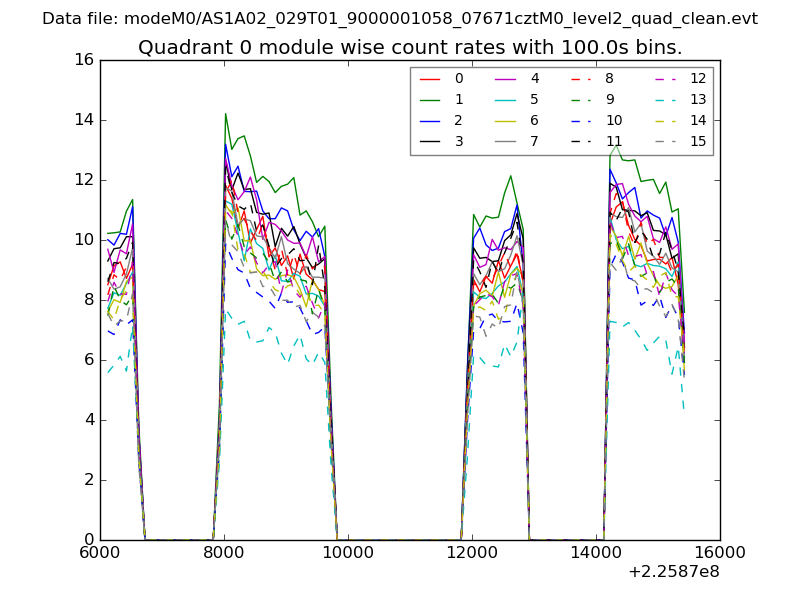 |
 |
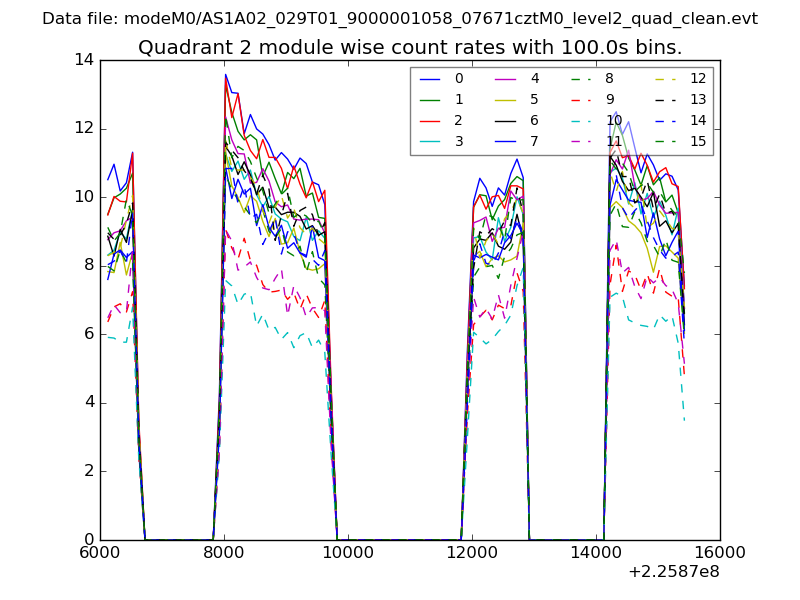
| Module-wise count rates for Quadrant B Data is divided into 100 sec bins |
 |
 |
| Module-wise count rates for Quadrant C Data is divided into 100 sec bins |
 |
 |
| Module-wise count rates for Quadrant D Data is divided into 100 sec bins |
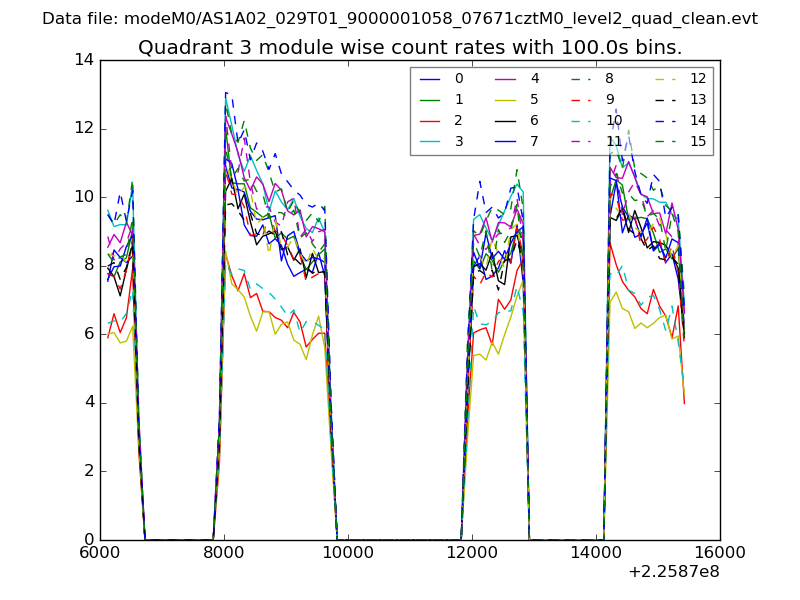 |
 |
| Parameter | Plot |
|---|---|
| CZT HV Monitor | 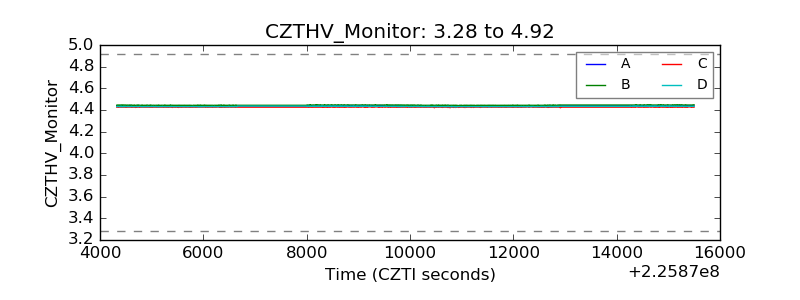 |
| D_VDD | 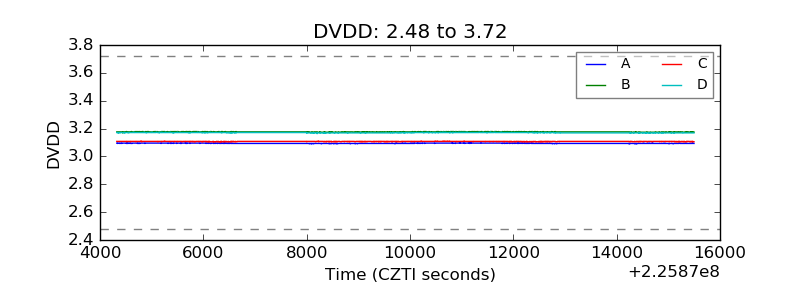 |
| Temperature 1 | 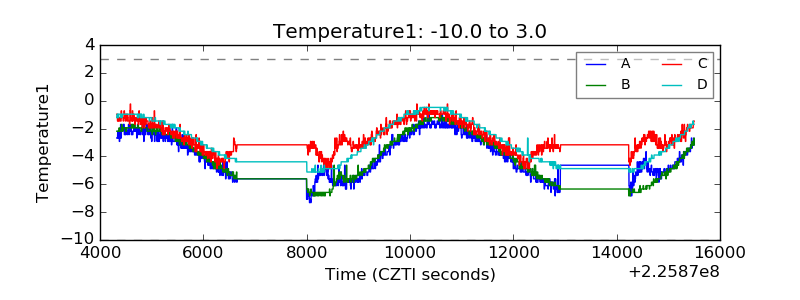 |
| Veto HV Monitor | 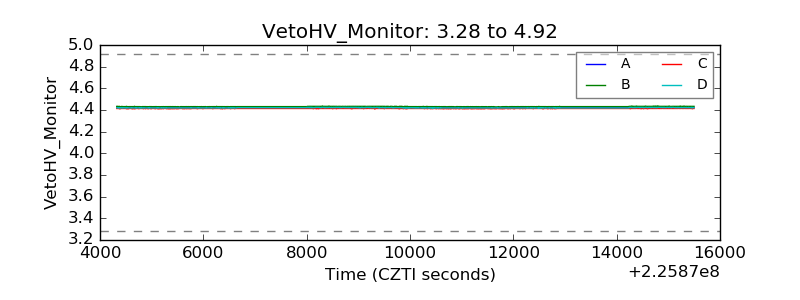 |
| Veto LLD | 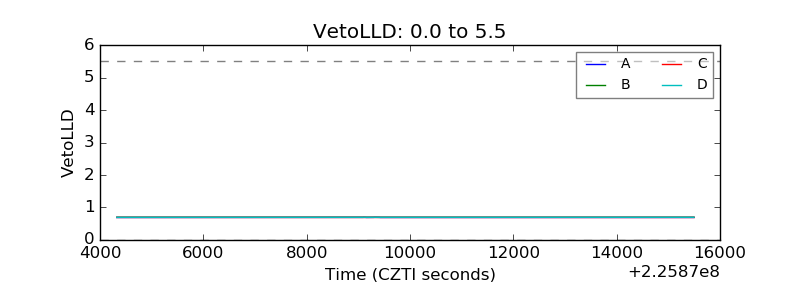 |
| Alpha Counter | 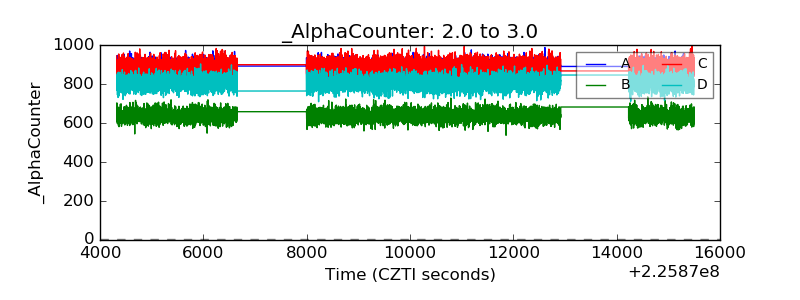 |
| _CPM_Rate | 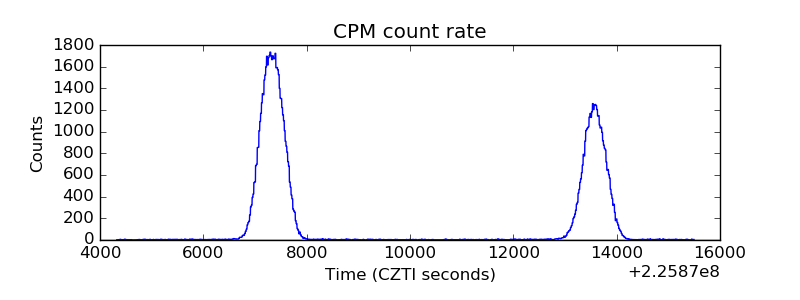 |
| CZT Counter | 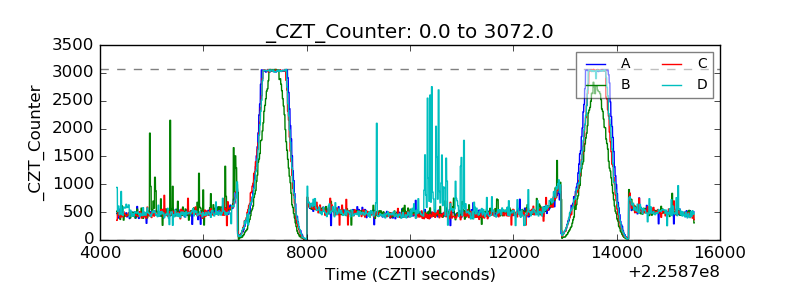 |
| +2.5 Volts monitor |  |
| +5 Volts monitor |  |
| _ROLL_ROT | 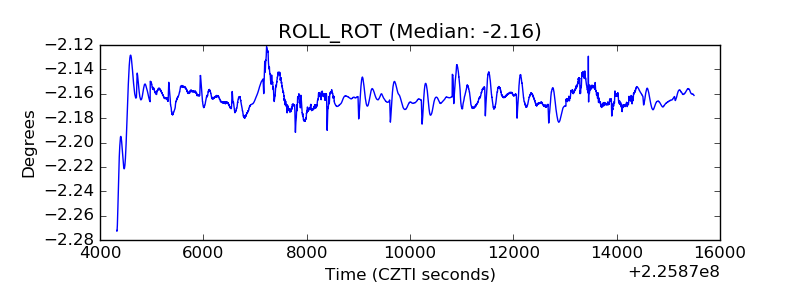 |
| _Roll_DEC | 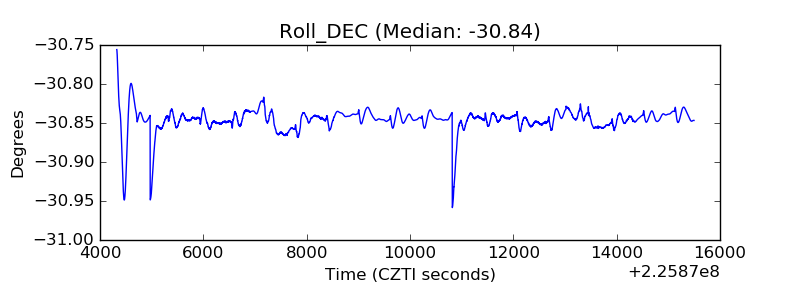 |
| _Roll_RA | 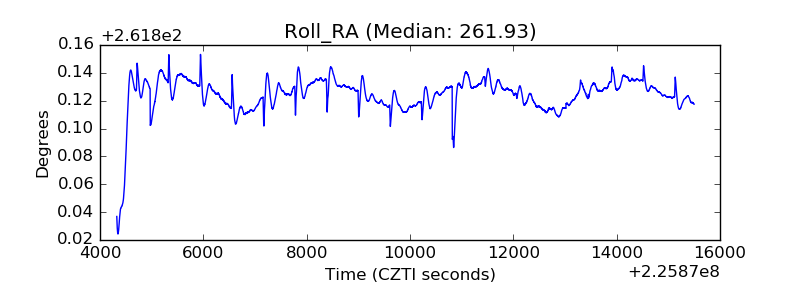 |
| Veto Counter | 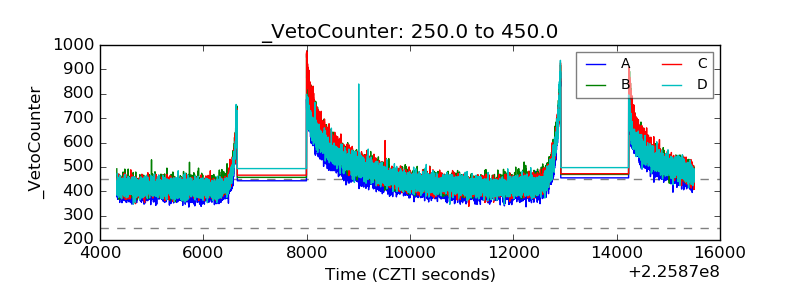 |