| Param | Original file | Final file |
|---|---|---|
| Filename | modeM0/AS1A02_029T01_9000001058_07672cztM0_level2.evt | modeM0/AS1A02_029T01_9000001058_07672cztM0_level2_quad_clean.evt |
| Size (bytes) | 448,920,000 | 86,276,160 |
| Size | 428.1 MB | 82.3 MB |
| Events in quadrant A | 3,176,105 | 549,231 |
| Events in quadrant B | 3,336,296 | 556,061 |
| Events in quadrant C | 3,121,933 | 545,171 |
| Events in quadrant D | 3,527,726 | 517,036 |
| Mode M9 | |||
|---|---|---|---|
| Quadrant | BADHDUFLAG | Total packets | Discarded packets |
| A | 0 | 15 | 0 |
| B | 0 | 15 | 0 |
| C | 0 | 15 | 0 |
| D | 0 | 16 | 0 |
| Mode M0 | |||
|---|---|---|---|
| Quadrant | BADHDUFLAG | Total packets | Discarded packets |
| A | 0 | 13276 | 3 |
| B | 0 | 13694 | 2 |
| C | 0 | 13235 | 2 |
| D | 0 | 14500 | 2 |
| Mode SS | |||
|---|---|---|---|
| Quadrant | BADHDUFLAG | Total packets | Discarded packets |
| A | 0 | 130 | 0 |
| B | 0 | 130 | 0 |
| C | 0 | 130 | 0 |
| D | 0 | 130 | 0 |
| Quadrant | Total seconds | Saturated seconds | Saturation percentage |
|---|---|---|---|
| A | 6378 | 89 | 1.395422% |
| B | 6378 | 88 | 1.379743% |
| C | 6378 | 49 | 0.768266% |
| D | 6378 | 114 | 1.787394% |
Noise dominated data is calculated using 1-second bins in cleaned event files. If a bin has >2000 counts, and if more than 50% of those come from <1% of pixels, then it is considered to be noise-dominated and hence unusable.
| Quadrant | # 1 sec bins | Bins with >0 counts | Bins with >2000 counts | High rate bins dominated by noise | Noise dominated (total time) | Noise dominated (detector-on time) | Marked lightcurve |
|---|---|---|---|---|---|---|---|
| A | 7618 | 6379 | 1 | 1 | 0.01% | 0.02% | 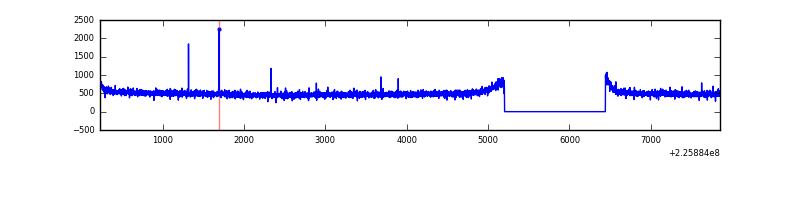 |
| B | 7618 | 6379 | 7 | 7 | 0.09% | 0.11% |  |
| C | 7618 | 6379 | 0 | 0 | 0.00% | 0.00% | 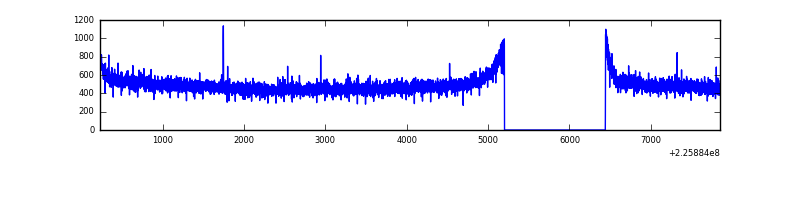 |
| D | 7618 | 6379 | 28 | 28 | 0.37% | 0.44% | 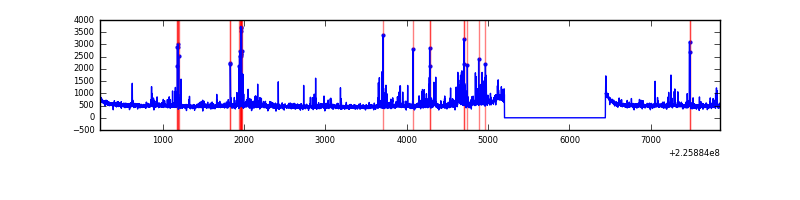 |
Top three noisy pixels from each quadrant. If the there are fewer than three noisy pixels in the level2.evt file, extra rows are filled as -1
| Pixel properties | Quadrant properties | ||||||
|---|---|---|---|---|---|---|---|
| Quadrant | DetID | PixID | Counts | Sigma | Mean | Median | Sigma |
| A | 0 | 226 | 8073 | 43.78 | 822 | 807 | 166.0 |
| A | 12 | 194 | 7373 | 39.56 | 822 | 807 | 166.0 |
| A | 13 | 170 | 5639 | 29.11 | 822 | 807 | 166.0 |
| B | 5 | 255 | 82212 | 529.23 | 816 | 798 | 153.8 |
| B | 0 | 214 | 29509 | 186.63 | 816 | 798 | 153.8 |
| B | 12 | 111 | 14337 | 88.01 | 816 | 798 | 153.8 |
| C | 13 | 61 | 6137 | 28.94 | 797 | 801 | 184.4 |
| C | 10 | 22 | 5531 | 25.65 | 797 | 801 | 184.4 |
| C | 9 | 68 | 5082 | 23.22 | 797 | 801 | 184.4 |
| D | 2 | 152 | 143945 | 742.76 | 800 | 780 | 192.7 |
| D | 12 | 0 | 125237 | 645.7 | 800 | 780 | 192.7 |
| D | 13 | 104 | 75272 | 386.47 | 800 | 780 | 192.7 |
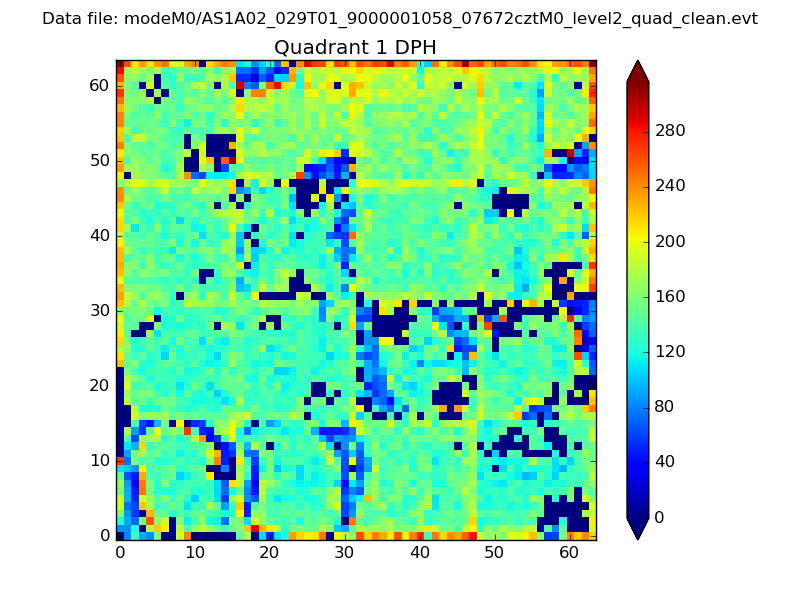
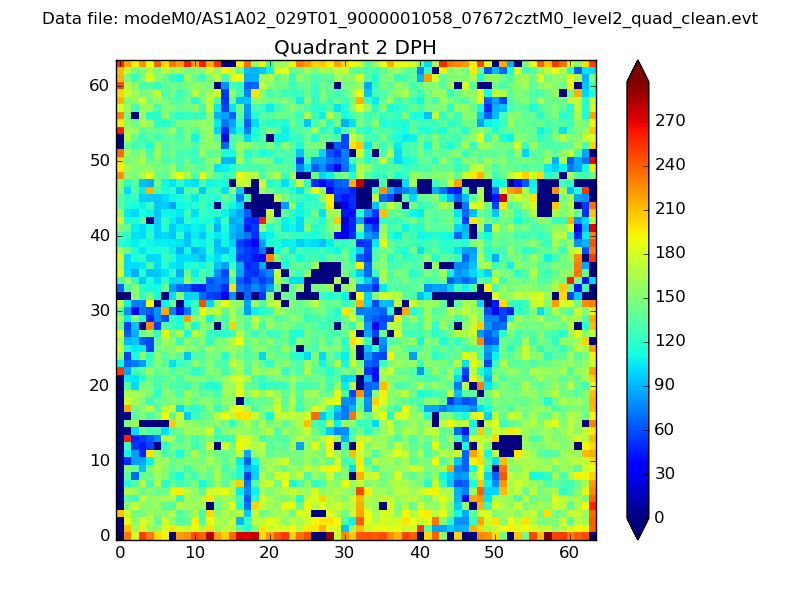
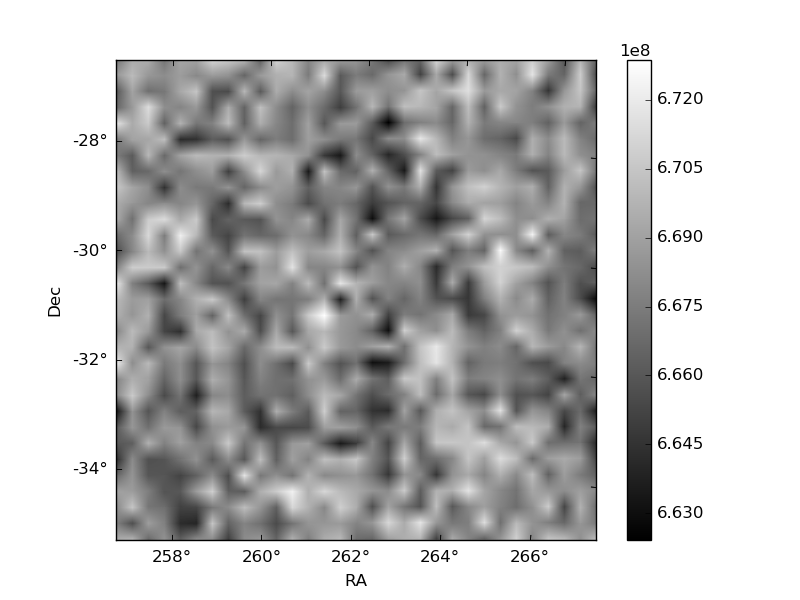
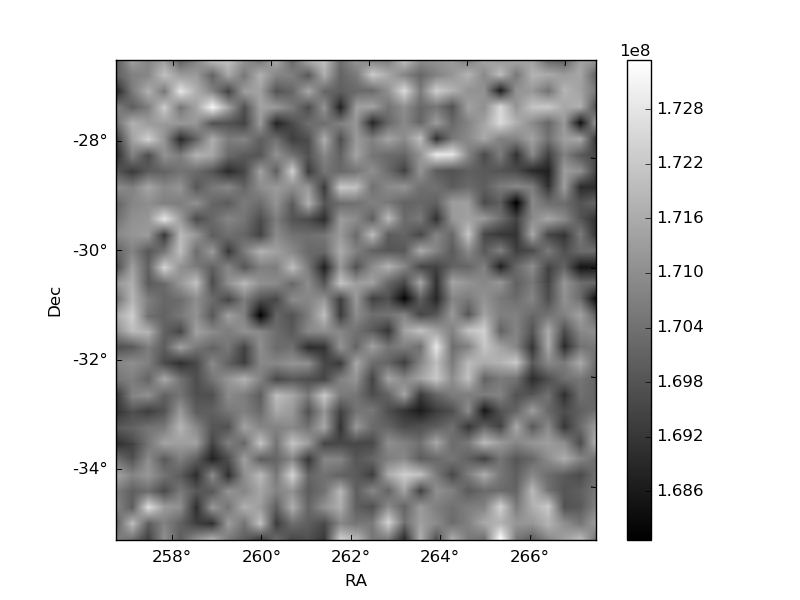
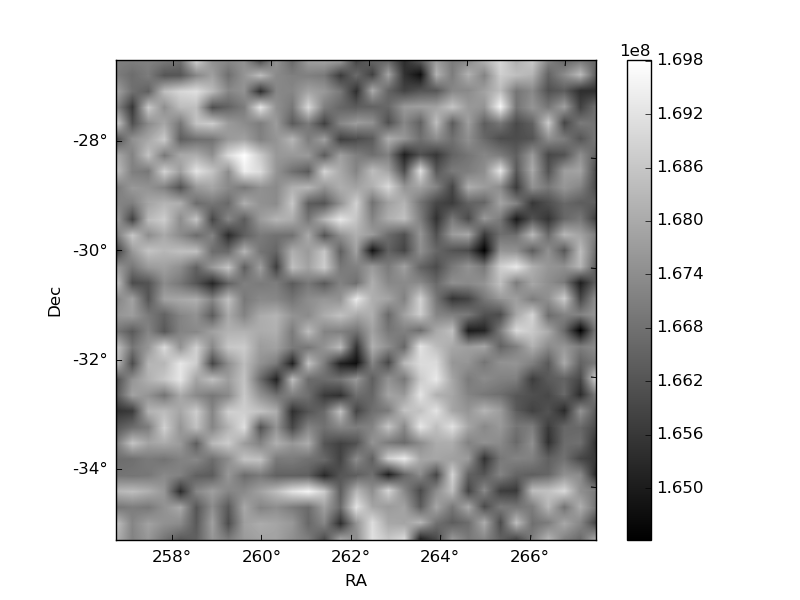
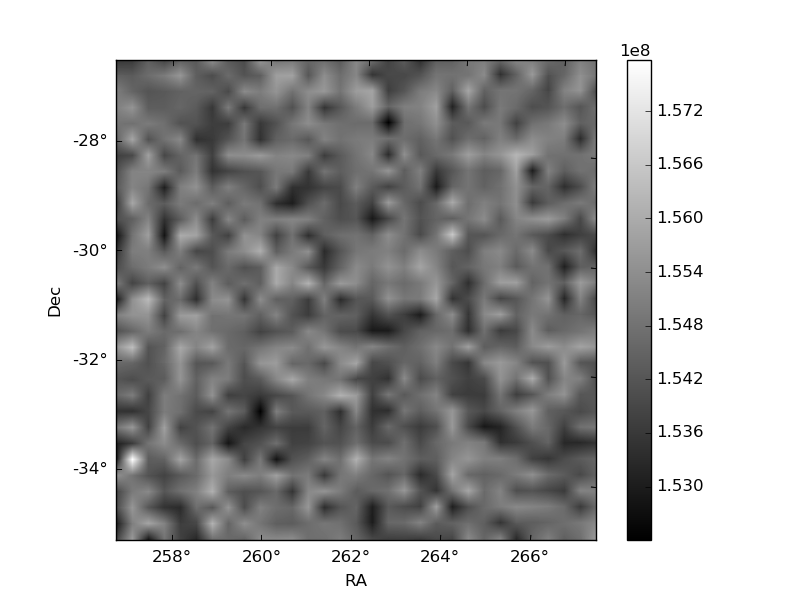
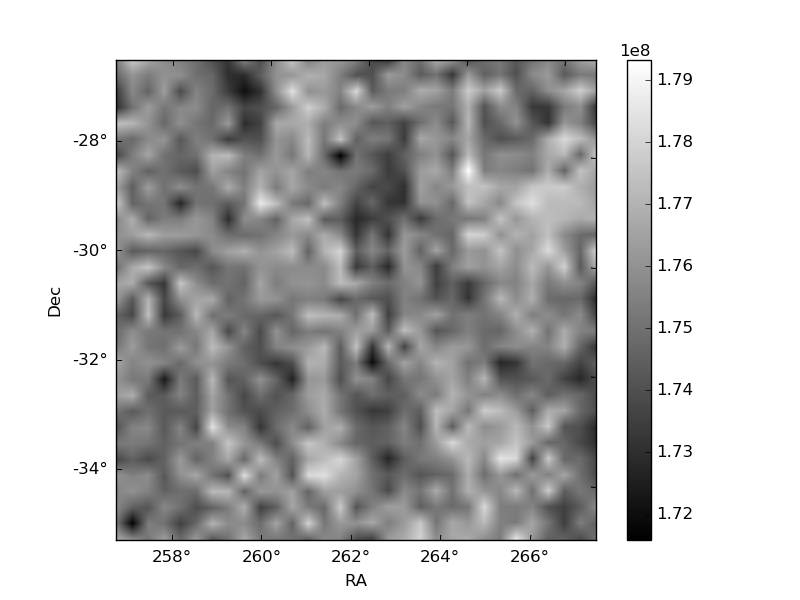
Histogram calculated using DETX and DETY for each event in the final _common_clean file
| Quadrant A | 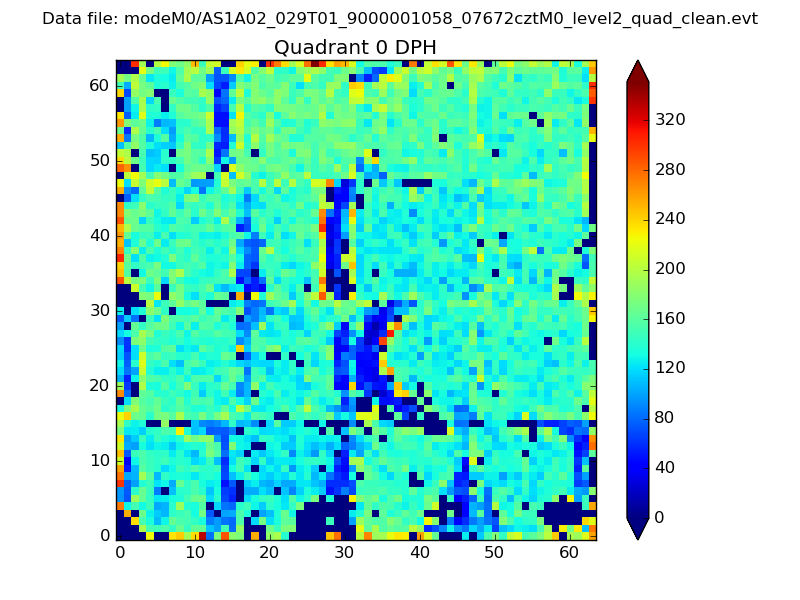 |
 |
Quadrant B |
|---|---|---|---|
| Quadrant D | 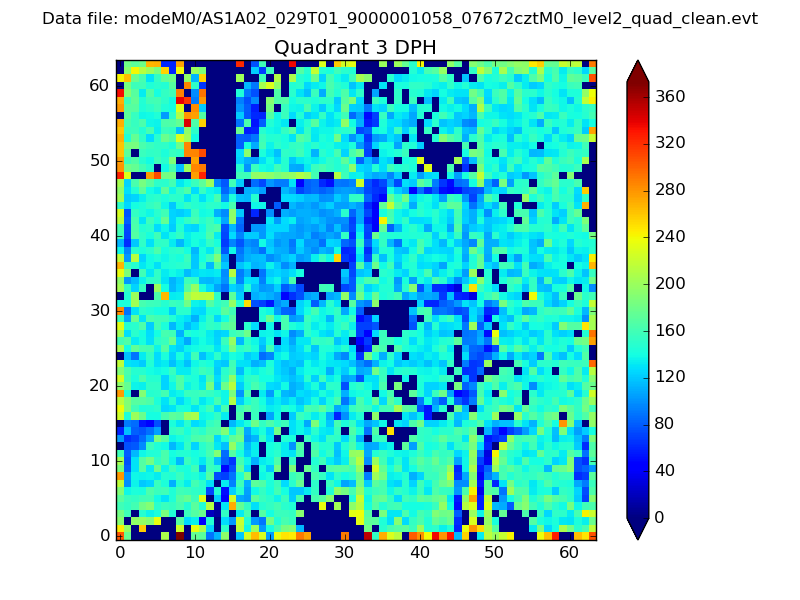 |
 |
Quadrant C |
| Plot type | Count rate plots | Images |
|---|---|---|
| Comparison with Poisson distribution Blue bars denote a histogram of data divided into 1 sec bins. Red curve is a Poisson curve with rate = median count rate of data. |
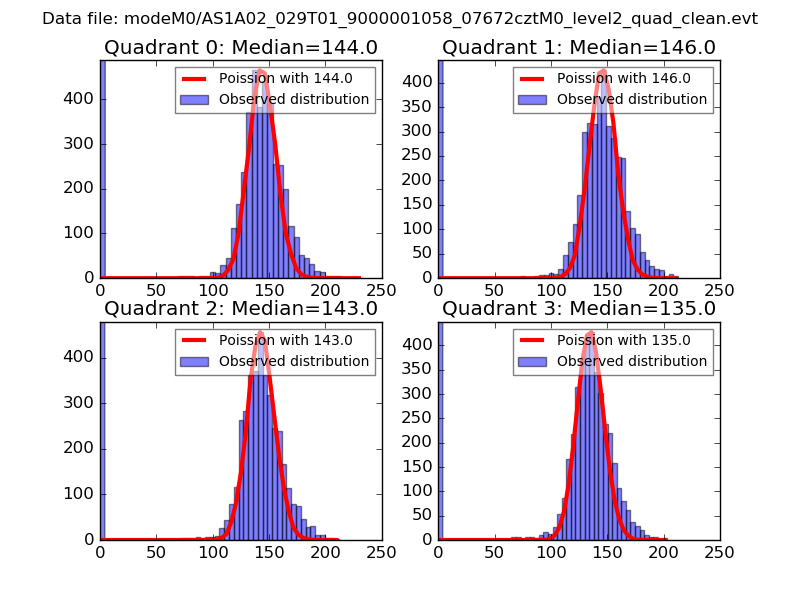 |
 |
| Quadrant-wise count rates Data is divided into 100 sec bins |
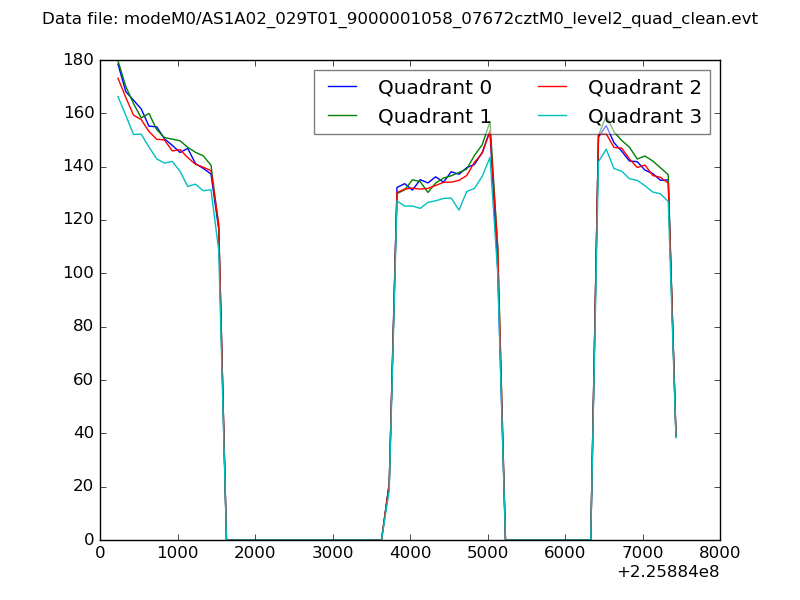 |
|
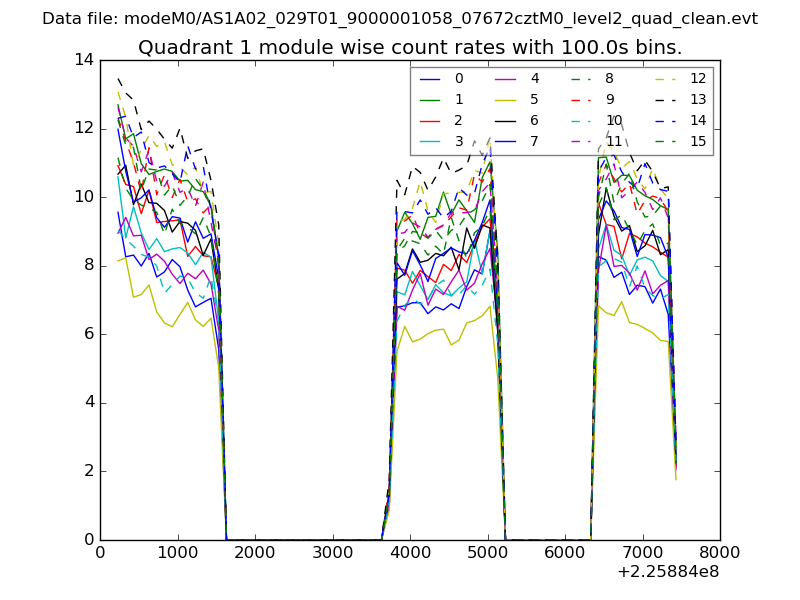
| Module-wise count rates for Quadrant A Data is divided into 100 sec bins |
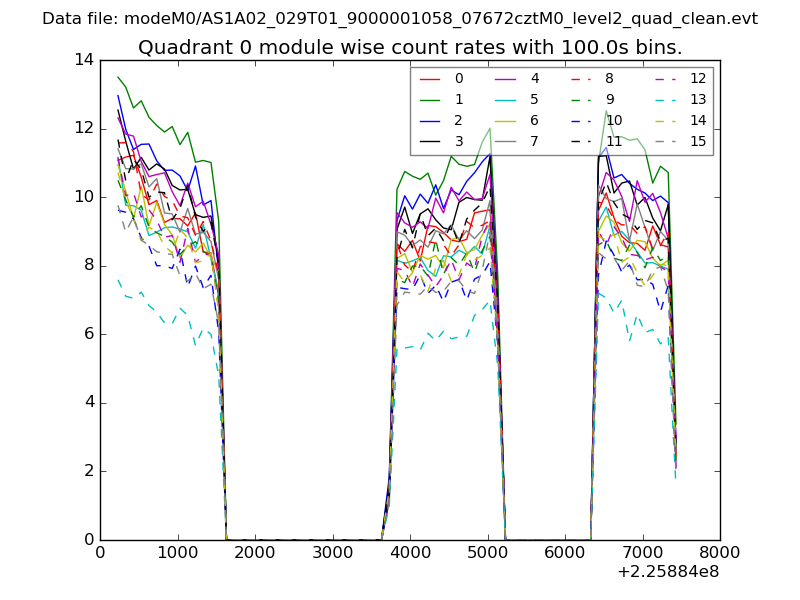 |
 |
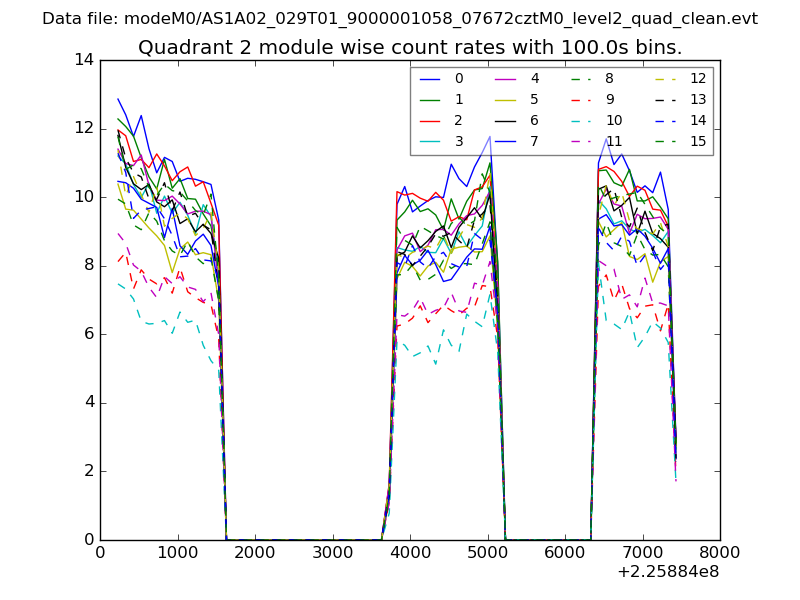
| Module-wise count rates for Quadrant B Data is divided into 100 sec bins |
 |
 |
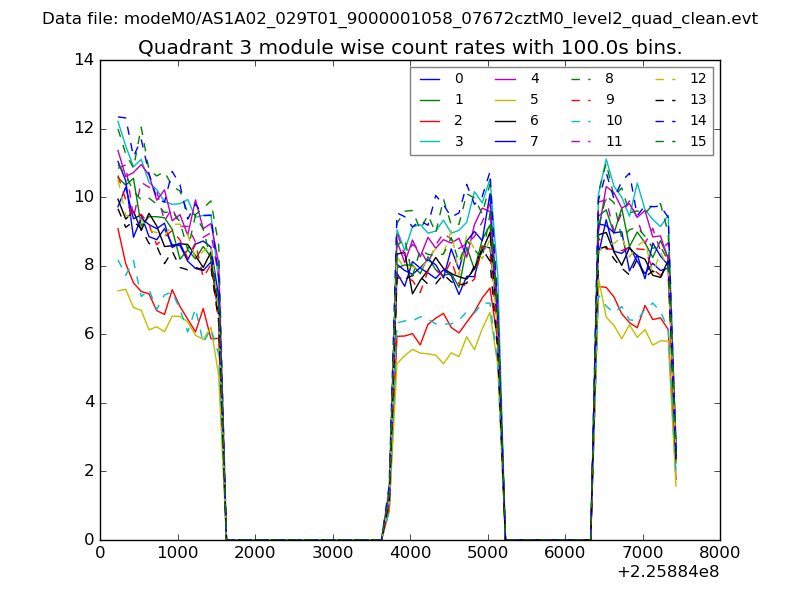
| Module-wise count rates for Quadrant C Data is divided into 100 sec bins |
 |
 |
| Module-wise count rates for Quadrant D Data is divided into 100 sec bins |
 |
 |
| Parameter | Plot |
|---|---|
| CZT HV Monitor | 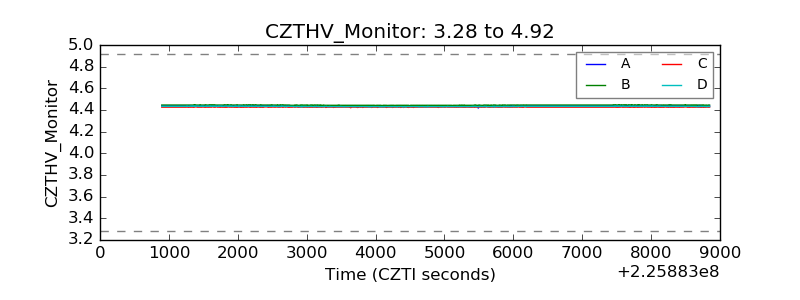 |
| D_VDD | 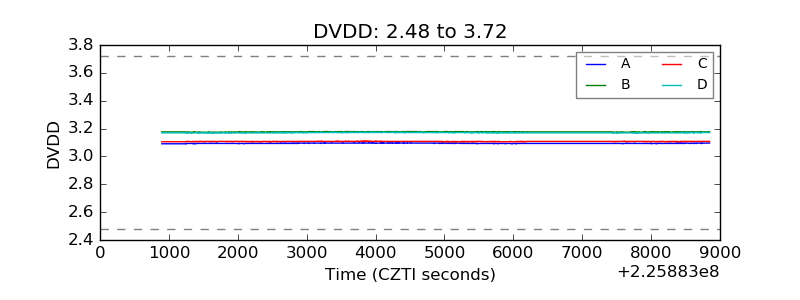 |
| Temperature 1 | 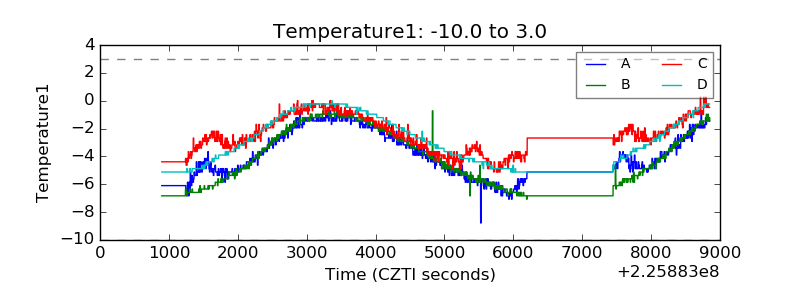 |
| Veto HV Monitor | 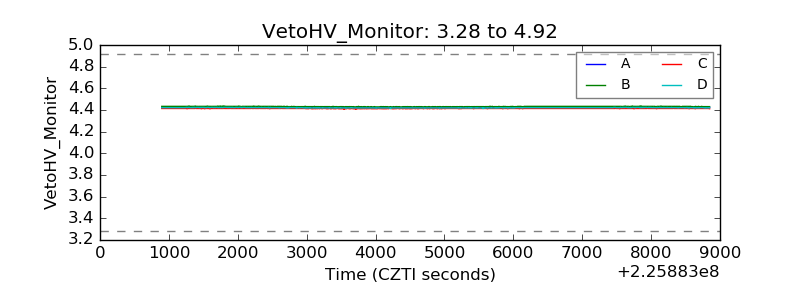 |
| Veto LLD | 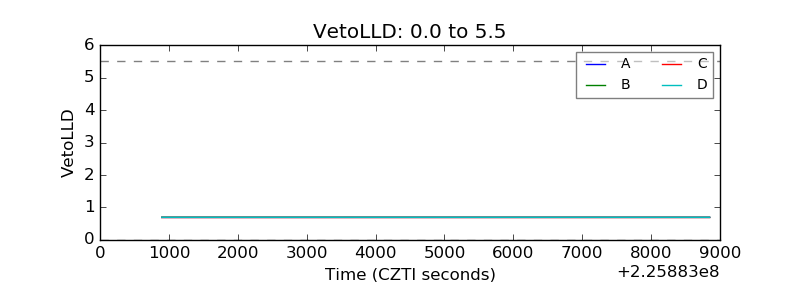 |
| Alpha Counter | 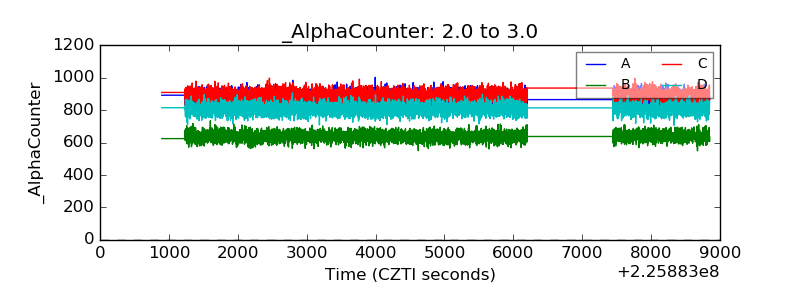 |
| _CPM_Rate | 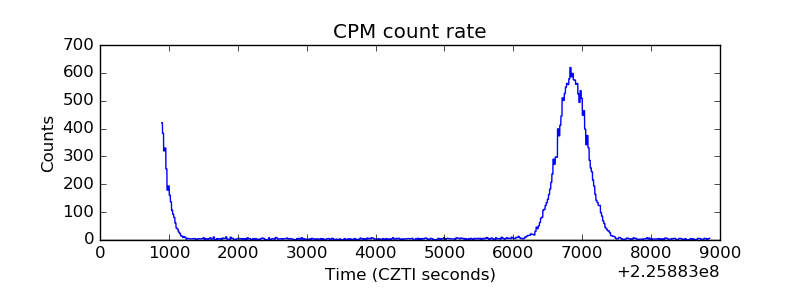 |
| CZT Counter | 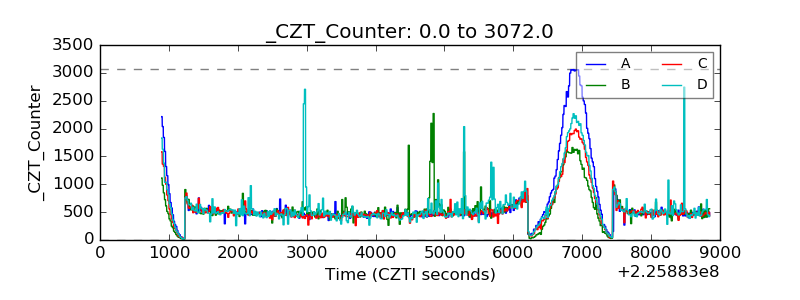 |
| +2.5 Volts monitor |  |
| +5 Volts monitor |  |
| _ROLL_ROT | 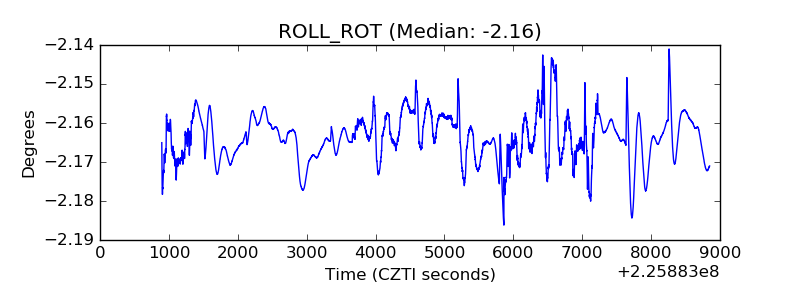 |
| _Roll_DEC | 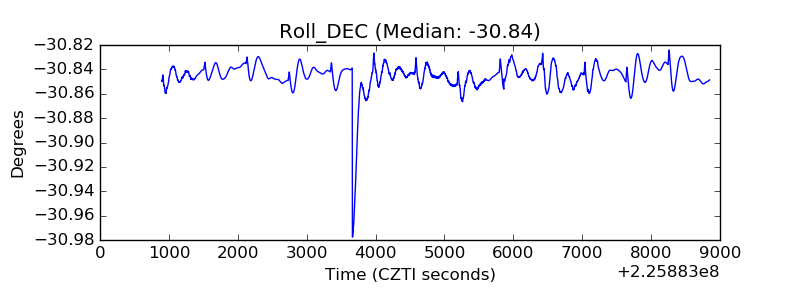 |
| _Roll_RA | 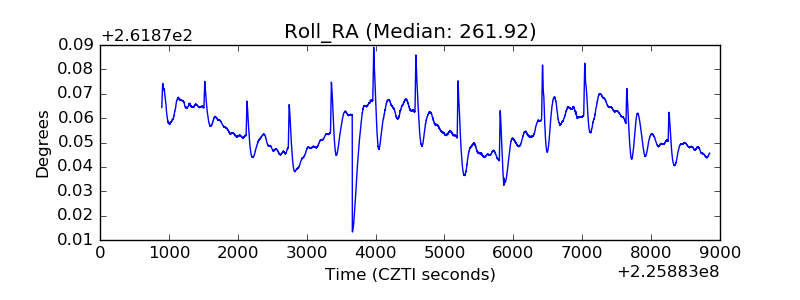 |
| Veto Counter | 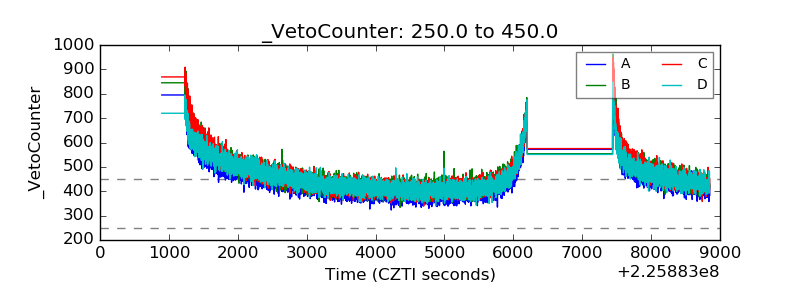 |