| Param | Original file | Final file |
|---|---|---|
| Filename | modeM0/AS1A02_029T01_9000001058_07673cztM0_level2.evt | modeM0/AS1A02_029T01_9000001058_07673cztM0_level2_quad_clean.evt |
| Size (bytes) | 505,601,280 | 81,406,080 |
| Size | 482.2 MB | 77.6 MB |
| Events in quadrant A | 3,396,357 | 501,164 |
| Events in quadrant B | 3,668,603 | 509,160 |
| Events in quadrant C | 3,350,223 | 500,545 |
| Events in quadrant D | 4,419,775 | 464,613 |
| Mode M9 | |||
|---|---|---|---|
| Quadrant | BADHDUFLAG | Total packets | Discarded packets |
| A | 0 | 20 | 0 |
| B | 0 | 20 | 0 |
| C | 0 | 20 | 0 |
| D | 0 | 21 | 0 |
| Mode M0 | |||
|---|---|---|---|
| Quadrant | BADHDUFLAG | Total packets | Discarded packets |
| A | 0 | 14552 | 3 |
| B | 0 | 15231 | 2 |
| C | 0 | 14557 | 2 |
| D | 0 | 17614 | 2 |
| Mode SS | |||
|---|---|---|---|
| Quadrant | BADHDUFLAG | Total packets | Discarded packets |
| A | 0 | 142 | 0 |
| B | 0 | 142 | 0 |
| C | 0 | 142 | 0 |
| D | 0 | 142 | 0 |
| Quadrant | Total seconds | Saturated seconds | Saturation percentage |
|---|---|---|---|
| A | 7027 | 152 | 2.163085% |
| B | 7027 | 160 | 2.276932% |
| C | 7027 | 124 | 1.764622% |
| D | 7027 | 339 | 4.824249% |
Noise dominated data is calculated using 1-second bins in cleaned event files. If a bin has >2000 counts, and if more than 50% of those come from <1% of pixels, then it is considered to be noise-dominated and hence unusable.
| Quadrant | # 1 sec bins | Bins with >0 counts | Bins with >2000 counts | High rate bins dominated by noise | Noise dominated (total time) | Noise dominated (detector-on time) | Marked lightcurve |
|---|---|---|---|---|---|---|---|
| A | 8002 | 7028 | 0 | 0 | 0.00% | 0.00% | 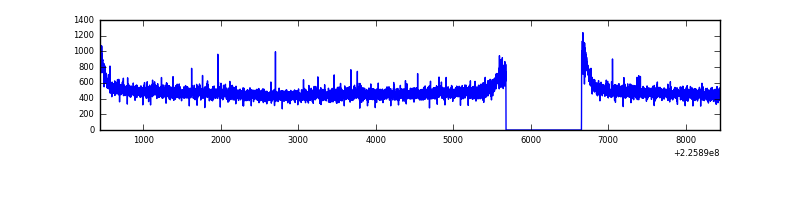 |
| B | 8002 | 7027 | 3 | 3 | 0.04% | 0.04% | 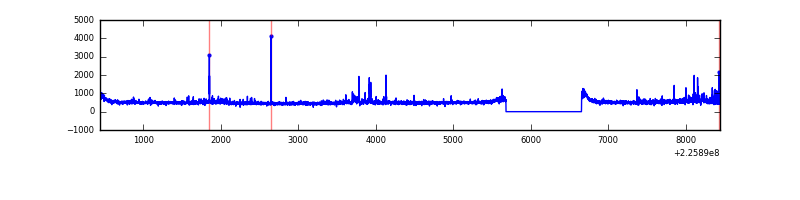 |
| C | 8002 | 7028 | 0 | 0 | 0.00% | 0.00% | 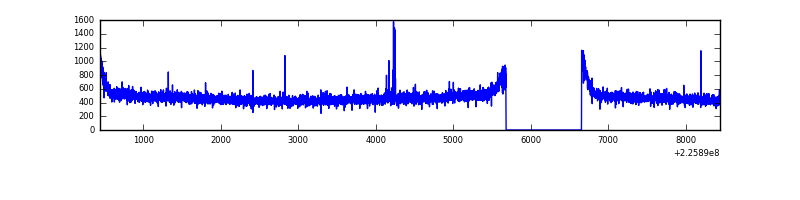 |
| D | 8002 | 7027 | 163 | 163 | 2.04% | 2.32% |  |
Top three noisy pixels from each quadrant. If the there are fewer than three noisy pixels in the level2.evt file, extra rows are filled as -1
| Pixel properties | Quadrant properties | ||||||
|---|---|---|---|---|---|---|---|
| Quadrant | DetID | PixID | Counts | Sigma | Mean | Median | Sigma |
| A | 0 | 226 | 8518 | 42.56 | 880 | 860 | 179.9 |
| A | 12 | 194 | 7695 | 37.99 | 880 | 860 | 179.9 |
| A | 13 | 14 | 6152 | 29.41 | 880 | 860 | 179.9 |
| B | 0 | 214 | 91484 | 542.18 | 876 | 853 | 167.2 |
| B | 0 | 229 | 56567 | 333.3 | 876 | 853 | 167.2 |
| B | 4 | 173 | 34985 | 204.19 | 876 | 853 | 167.2 |
| C | 8 | 208 | 11738 | 54.73 | 853 | 856 | 198.8 |
| C | 13 | 61 | 6638 | 29.08 | 853 | 856 | 198.8 |
| C | 9 | 68 | 6256 | 27.16 | 853 | 856 | 198.8 |
| D | 12 | 0 | 629228 | 3031.28 | 848 | 821 | 207.3 |
| D | 2 | 152 | 275455 | 1324.77 | 848 | 821 | 207.3 |
| D | 13 | 104 | 147631 | 708.18 | 848 | 821 | 207.3 |
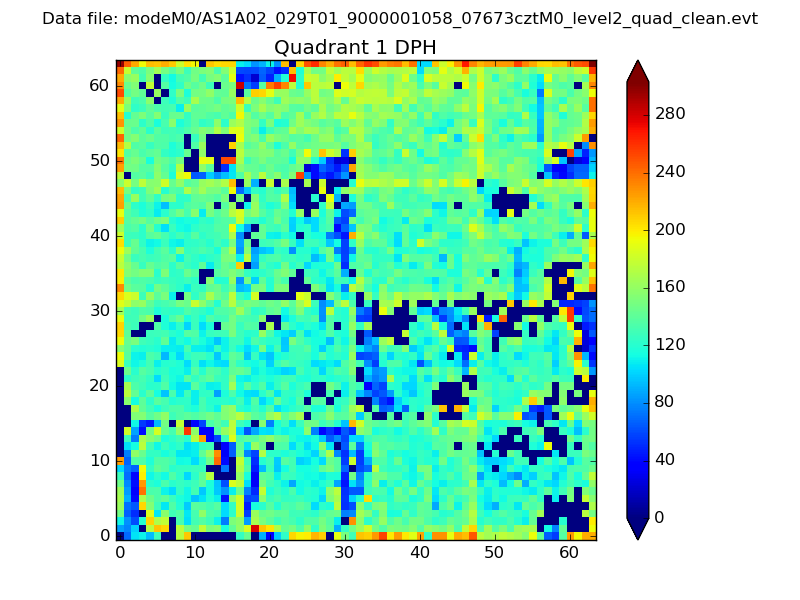
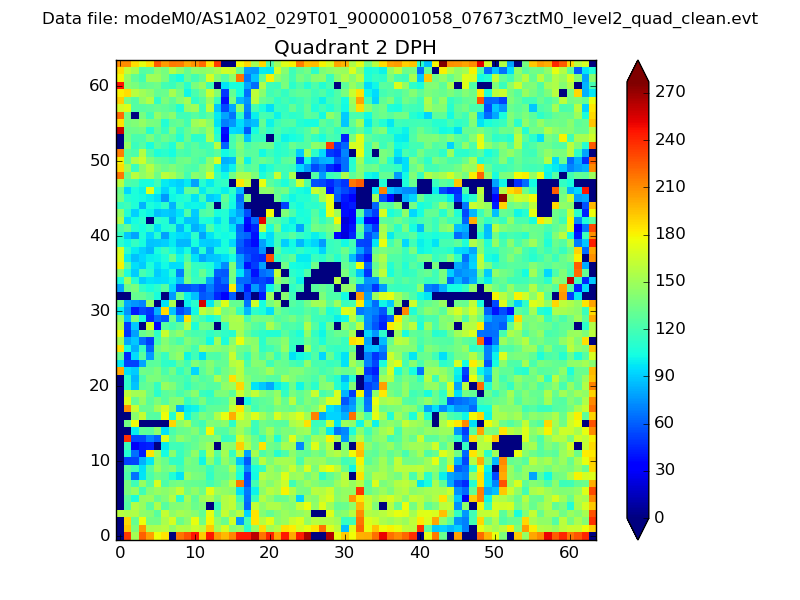
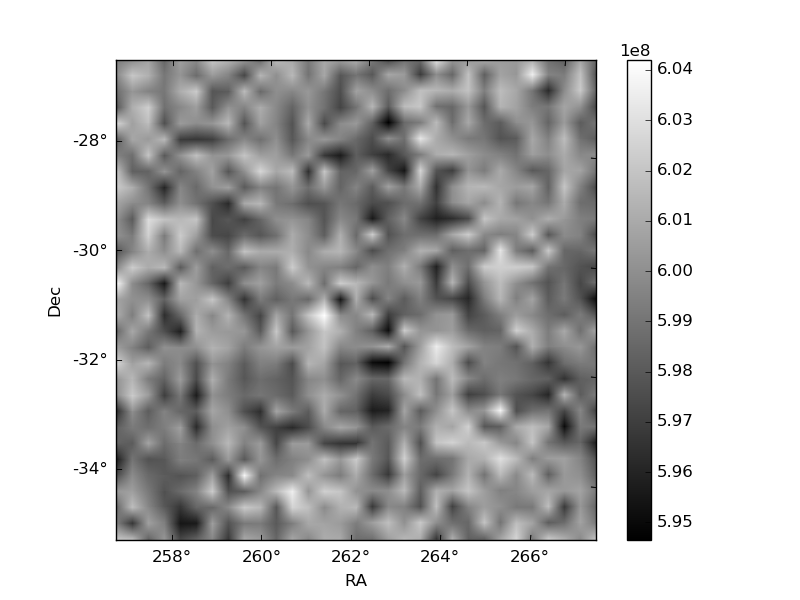
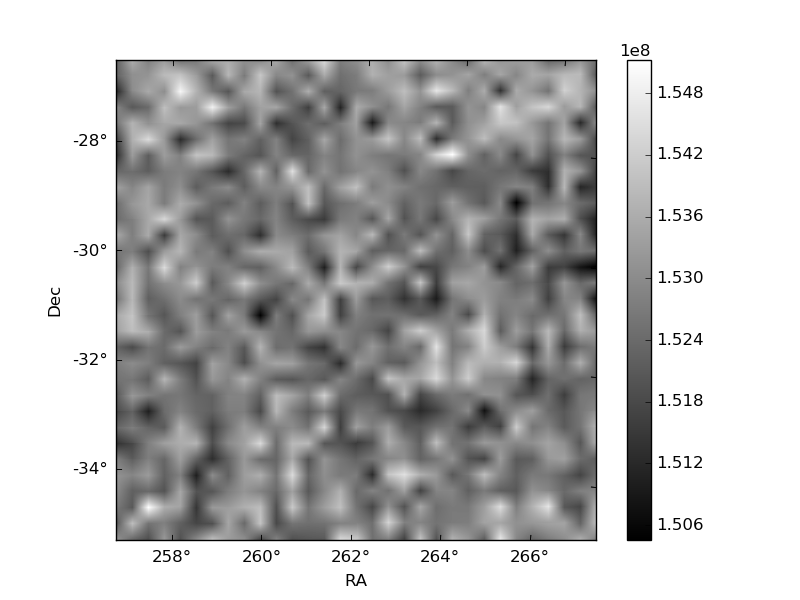
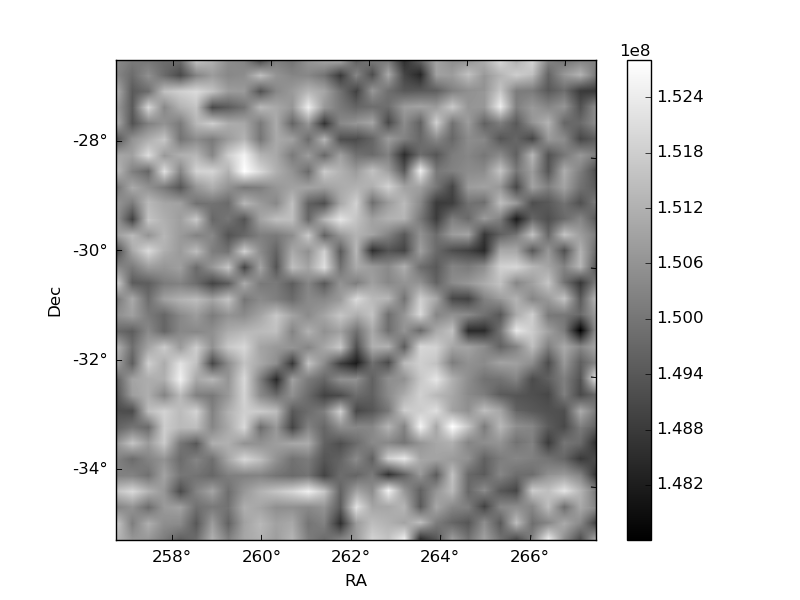
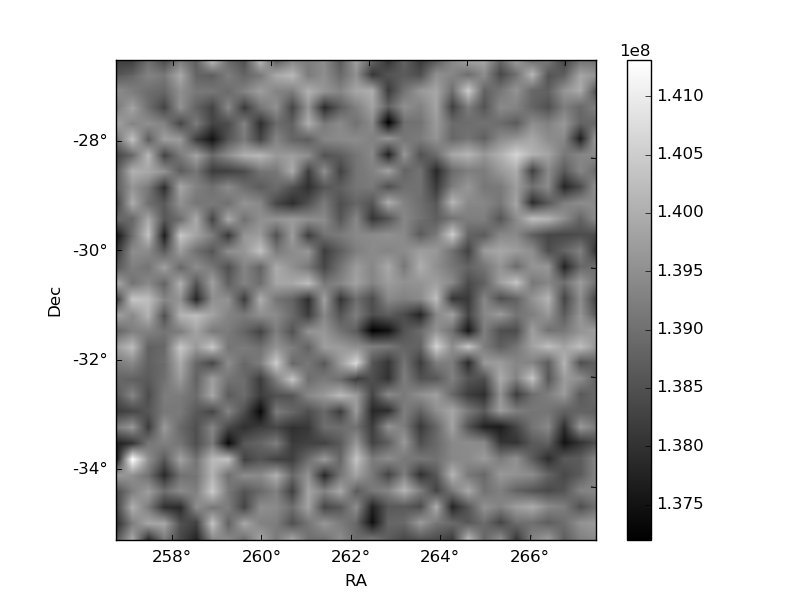
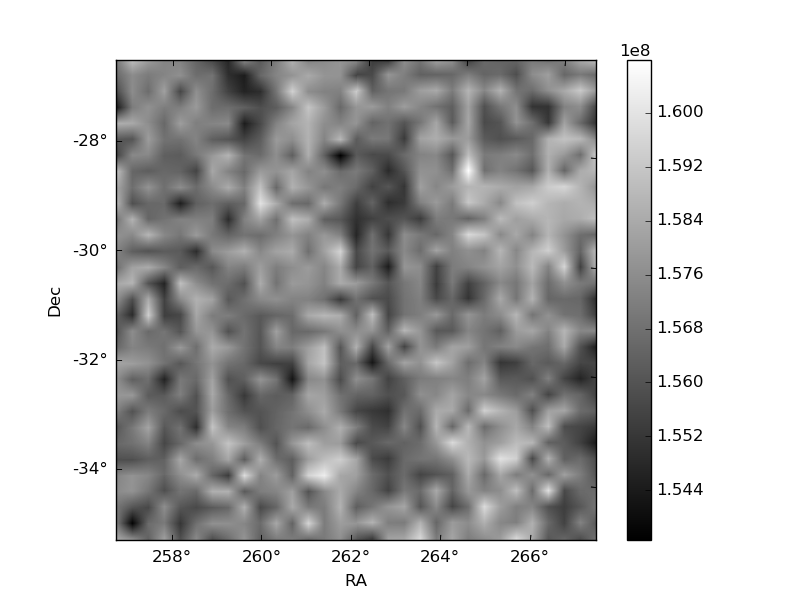
Histogram calculated using DETX and DETY for each event in the final _common_clean file
| Quadrant A | 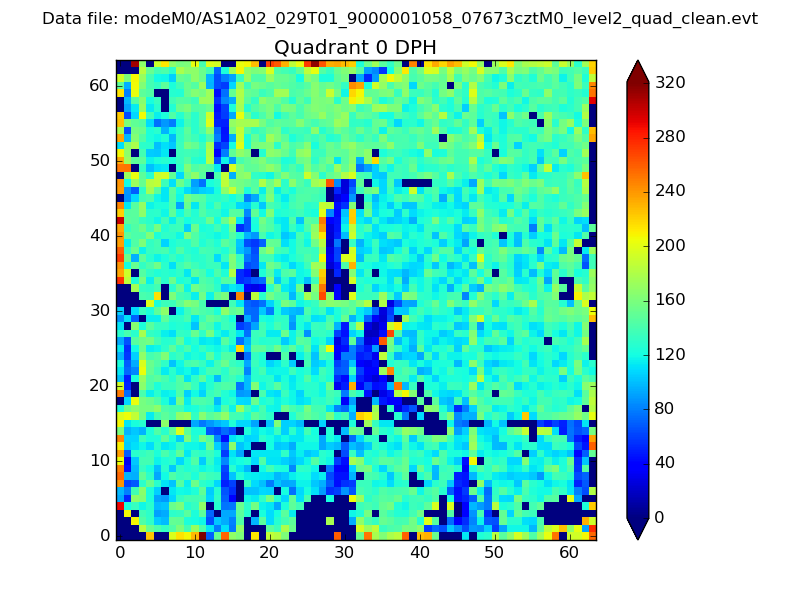 |
 |
Quadrant B |
|---|---|---|---|
| Quadrant D | 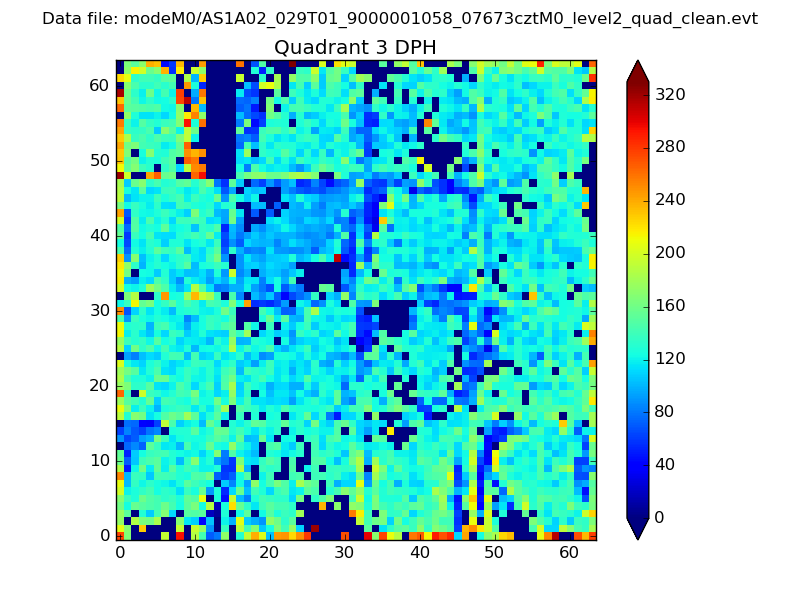 |
 |
Quadrant C |
| Plot type | Count rate plots | Images |
|---|---|---|
| Comparison with Poisson distribution Blue bars denote a histogram of data divided into 1 sec bins. Red curve is a Poisson curve with rate = median count rate of data. |
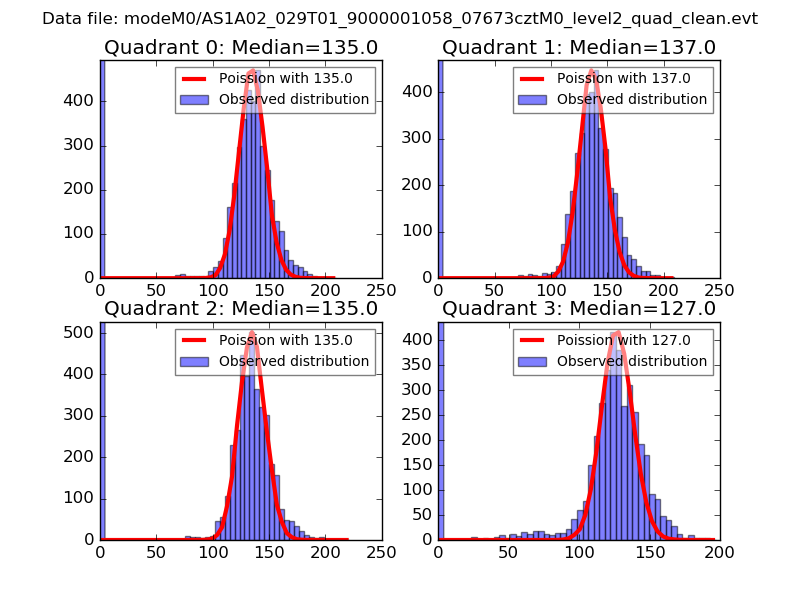 |
 |
| Quadrant-wise count rates Data is divided into 100 sec bins |
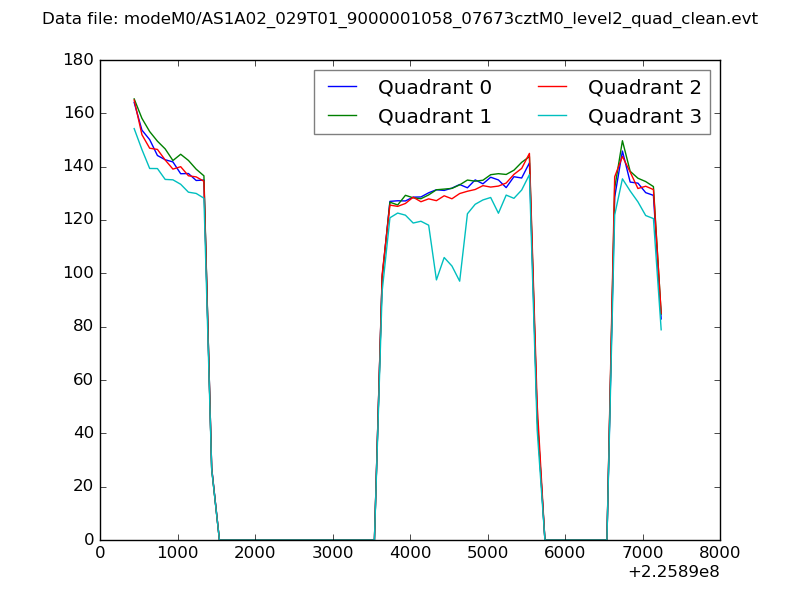 |
|
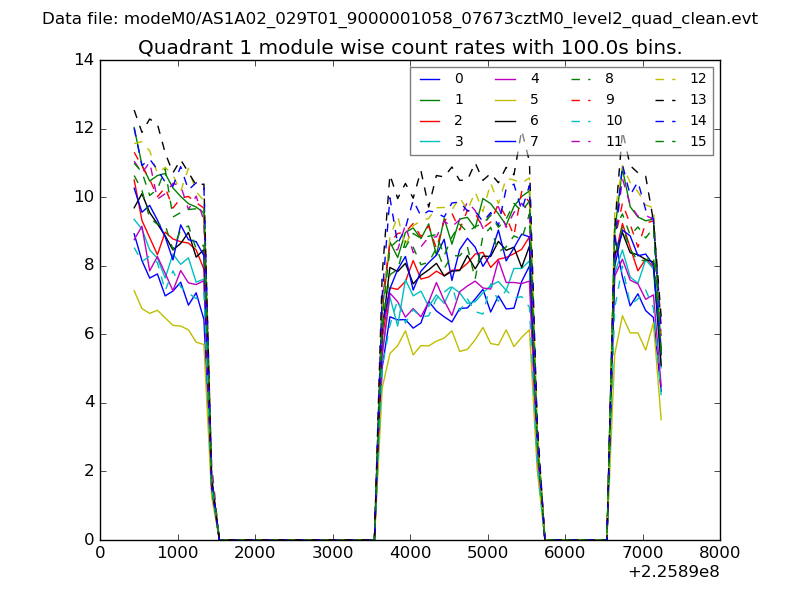
| Module-wise count rates for Quadrant A Data is divided into 100 sec bins |
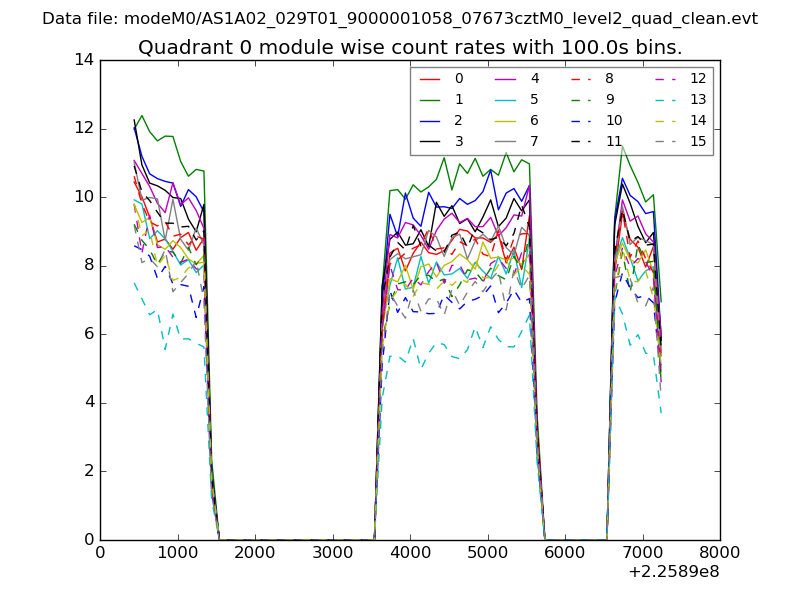 |
 |
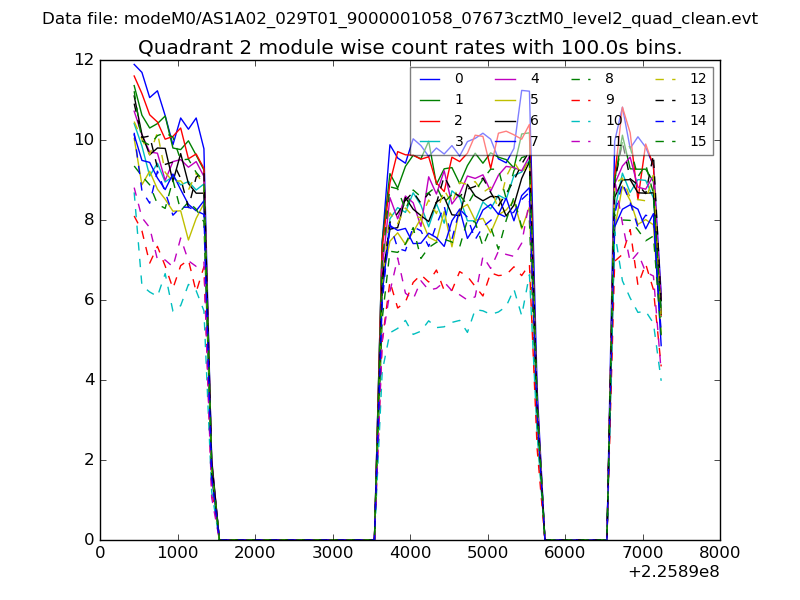
| Module-wise count rates for Quadrant B Data is divided into 100 sec bins |
 |
 |
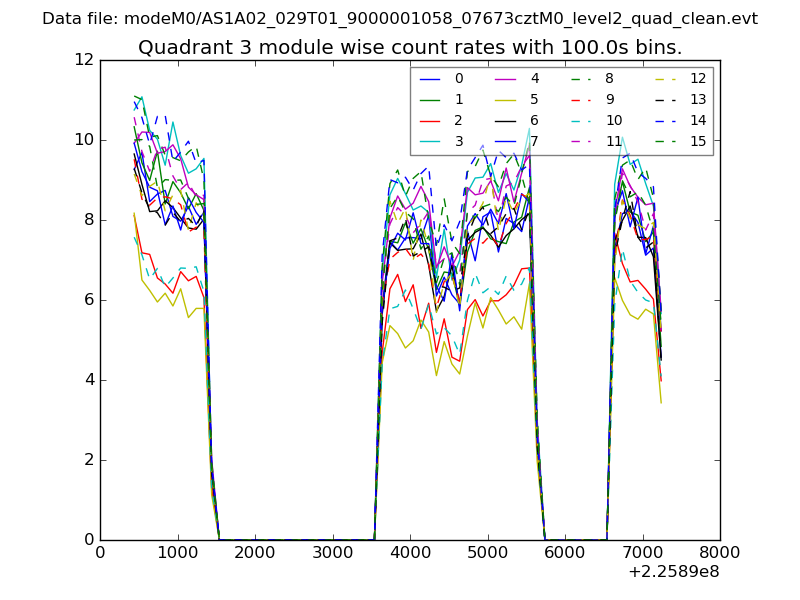
| Module-wise count rates for Quadrant C Data is divided into 100 sec bins |
 |
 |
| Module-wise count rates for Quadrant D Data is divided into 100 sec bins |
 |
 |
| Parameter | Plot |
|---|---|
| CZT HV Monitor | 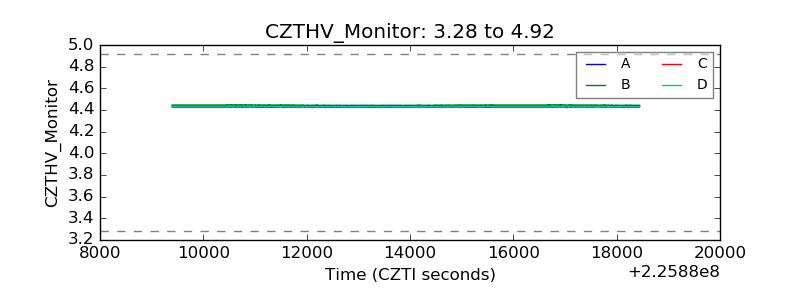 |
| D_VDD | 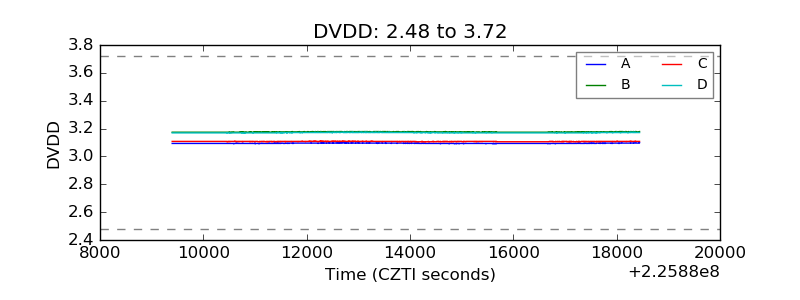 |
| Temperature 1 | 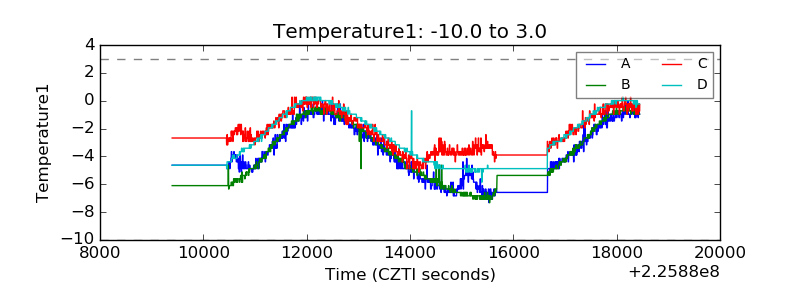 |
| Veto HV Monitor | 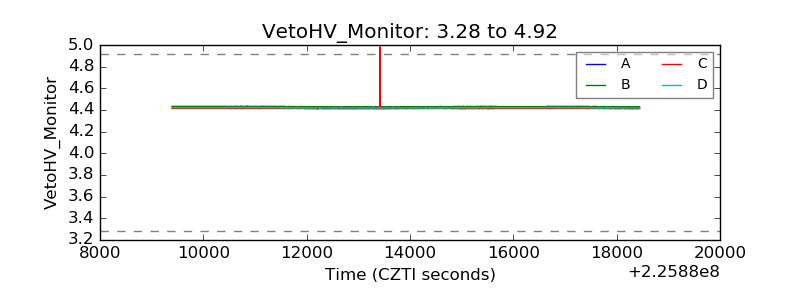 |
| Veto LLD | 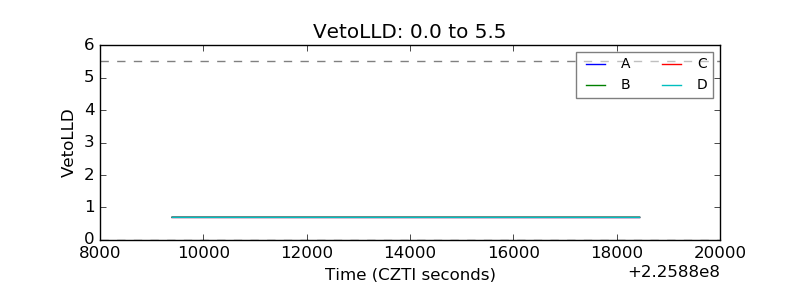 |
| Alpha Counter | 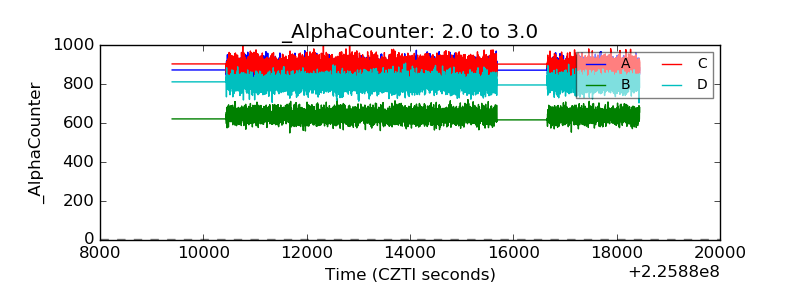 |
| _CPM_Rate | 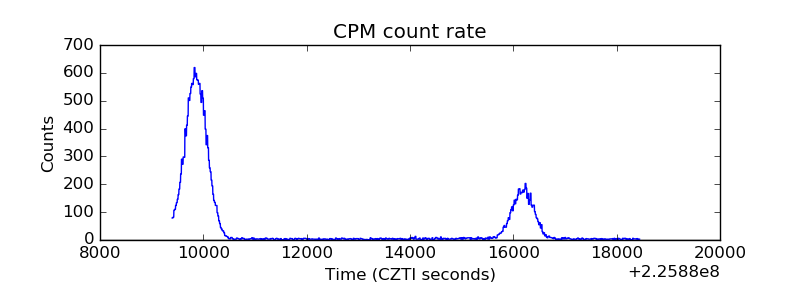 |
| CZT Counter | 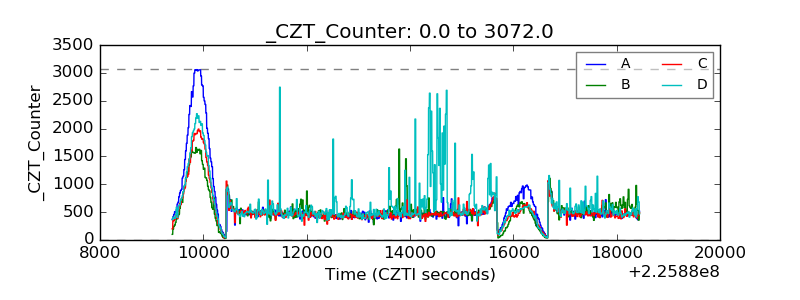 |
| +2.5 Volts monitor |  |
| +5 Volts monitor |  |
| _ROLL_ROT | 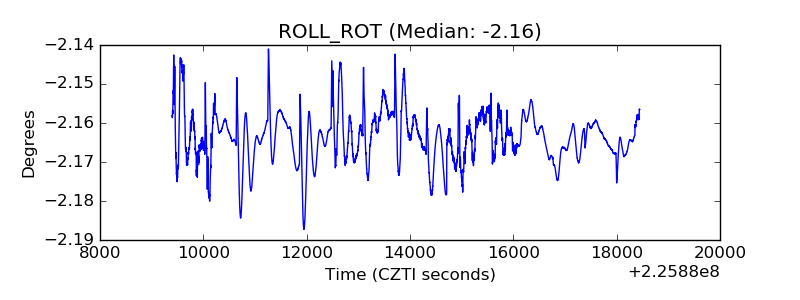 |
| _Roll_DEC | 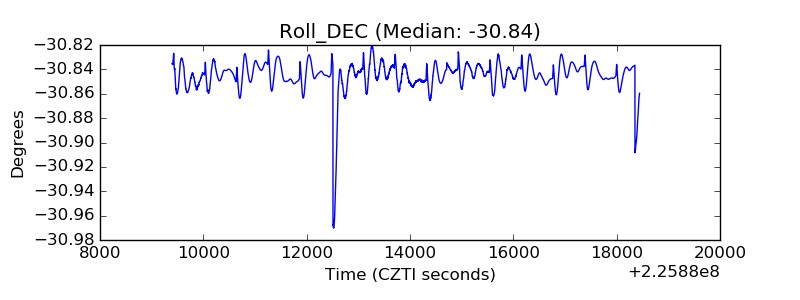 |
| _Roll_RA | 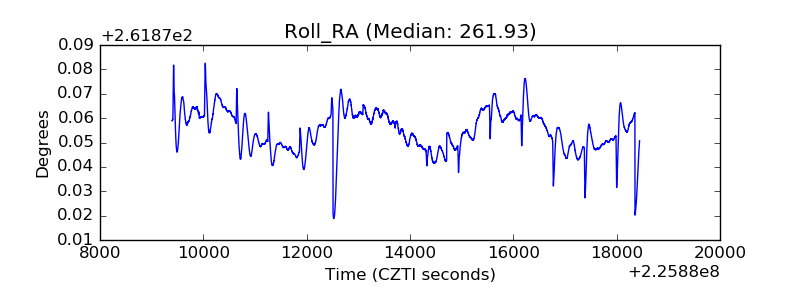 |
| Veto Counter | 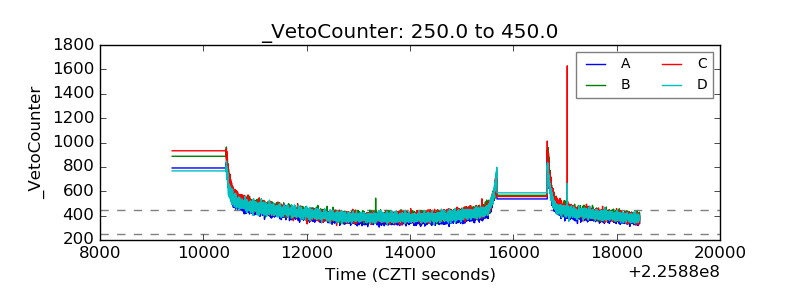 |