| Param | Original file | Final file |
|---|---|---|
| Filename | modeM0/AS1A02_029T01_9000001058_07674cztM0_level2.evt | modeM0/AS1A02_029T01_9000001058_07674cztM0_level2_quad_clean.evt |
| Size (bytes) | 756,705,600 | 76,040,640 |
| Size | 721.7 MB | 72.5 MB |
| Events in quadrant A | 3,521,088 | 478,731 |
| Events in quadrant B | 3,905,220 | 483,034 |
| Events in quadrant C | 10,179,313 | 378,044 |
| Events in quadrant D | 4,812,401 | 448,944 |
| Mode M9 | |||
|---|---|---|---|
| Quadrant | BADHDUFLAG | Total packets | Discarded packets |
| A | 0 | 6 | 0 |
| B | 0 | 6 | 0 |
| C | 0 | 6 | 0 |
| D | 0 | 6 | 0 |
| Mode M0 | |||
|---|---|---|---|
| Quadrant | BADHDUFLAG | Total packets | Discarded packets |
| A | 0 | 15336 | 3 |
| B | 0 | 16328 | 2 |
| C | 0 | 35245 | 2 |
| D | 0 | 19120 | 2 |
| Mode SS | |||
|---|---|---|---|
| Quadrant | BADHDUFLAG | Total packets | Discarded packets |
| A | 0 | 150 | 0 |
| B | 0 | 150 | 0 |
| C | 0 | 150 | 0 |
| D | 0 | 150 | 0 |
| Quadrant | Total seconds | Saturated seconds | Saturation percentage |
|---|---|---|---|
| A | 7363 | 204 | 2.770610% |
| B | 7363 | 258 | 3.504007% |
| C | 7363 | 3073 | 41.735706% |
| D | 7364 | 322 | 4.372624% |
Noise dominated data is calculated using 1-second bins in cleaned event files. If a bin has >2000 counts, and if more than 50% of those come from <1% of pixels, then it is considered to be noise-dominated and hence unusable.
| Quadrant | # 1 sec bins | Bins with >0 counts | Bins with >2000 counts | High rate bins dominated by noise | Noise dominated (total time) | Noise dominated (detector-on time) | Marked lightcurve |
|---|---|---|---|---|---|---|---|
| A | 7958 | 7363 | 0 | 0 | 0.00% | 0.00% | 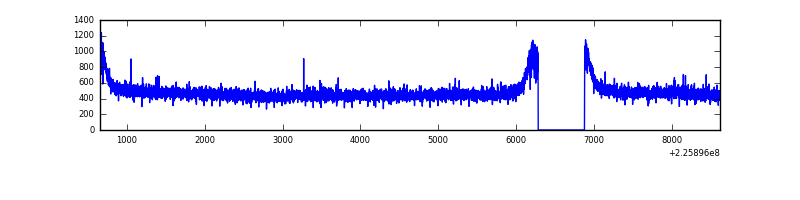 |
| B | 7958 | 7364 | 32 | 32 | 0.40% | 0.43% | 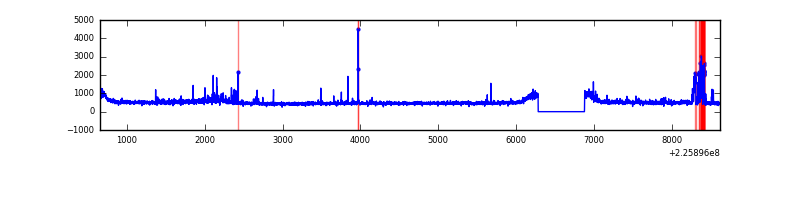 |
| C | 7957 | 7362 | 2449 | 2449 | 30.78% | 33.27% | 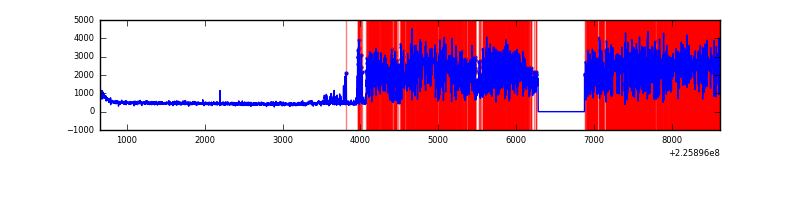 |
| D | 7959 | 7365 | 117 | 117 | 1.47% | 1.59% | 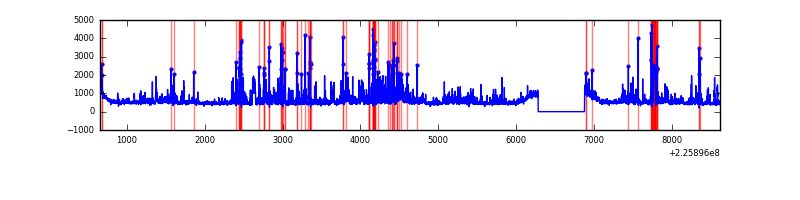 |
Top three noisy pixels from each quadrant. If the there are fewer than three noisy pixels in the level2.evt file, extra rows are filled as -1
| Pixel properties | Quadrant properties | ||||||
|---|---|---|---|---|---|---|---|
| Quadrant | DetID | PixID | Counts | Sigma | Mean | Median | Sigma |
| A | 13 | 14 | 12807 | 63.93 | 909 | 888 | 186.4 |
| A | 0 | 226 | 8663 | 41.7 | 909 | 888 | 186.4 |
| A | 12 | 194 | 8071 | 38.53 | 909 | 888 | 186.4 |
| B | 4 | 173 | 171239 | 964.57 | 909 | 886 | 176.6 |
| B | 0 | 214 | 91316 | 512.03 | 909 | 886 | 176.6 |
| B | 0 | 219 | 36638 | 202.43 | 909 | 886 | 176.6 |
| C | 9 | 68 | 7342213 | 43436.53 | 724 | 728 | 169.0 |
| C | 13 | 61 | 5632 | 29.01 | 724 | 728 | 169.0 |
| C | 8 | 208 | 4693 | 23.46 | 724 | 728 | 169.0 |
| D | 2 | 152 | 878302 | 4018.45 | 882 | 855 | 218.4 |
| D | 13 | 104 | 237921 | 1085.69 | 882 | 855 | 218.4 |
| D | 12 | 0 | 143807 | 654.68 | 882 | 855 | 218.4 |
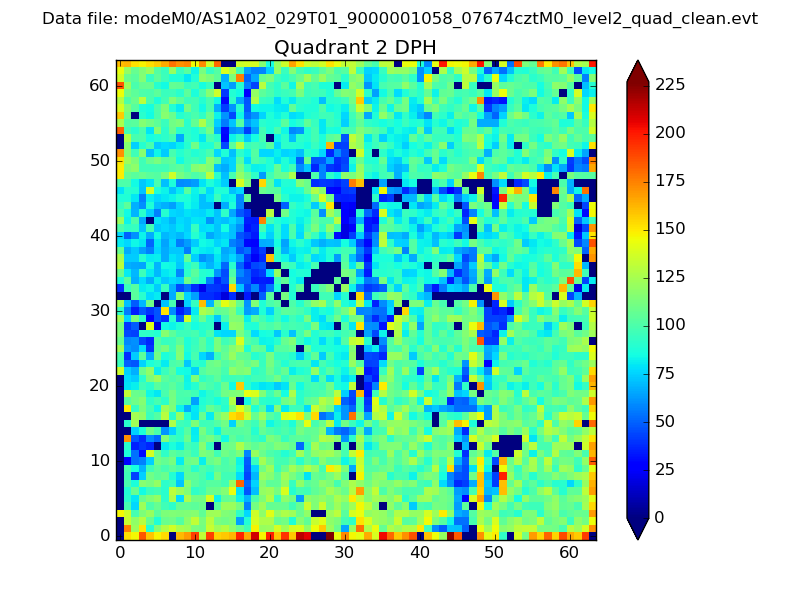
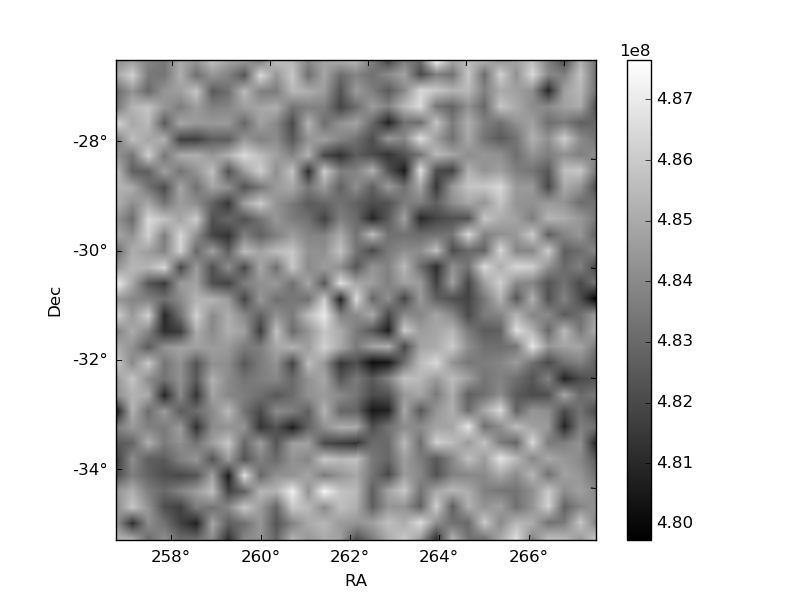
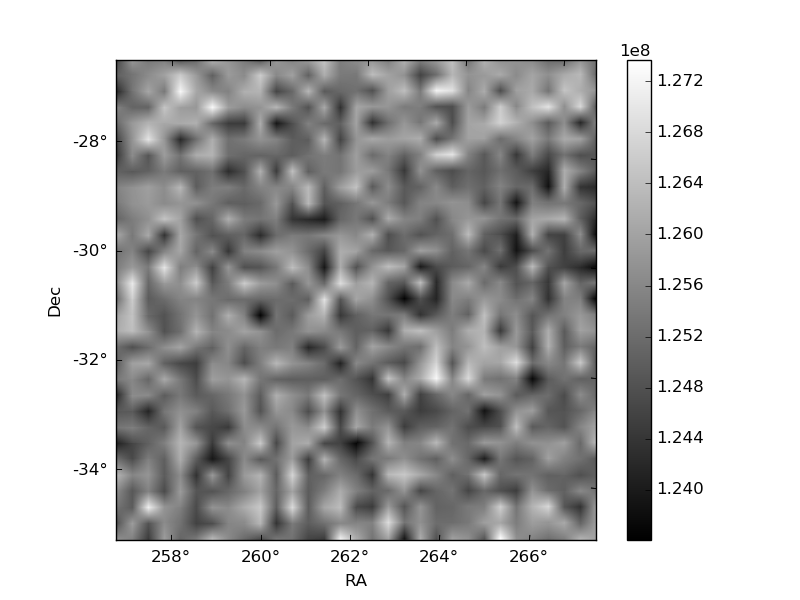
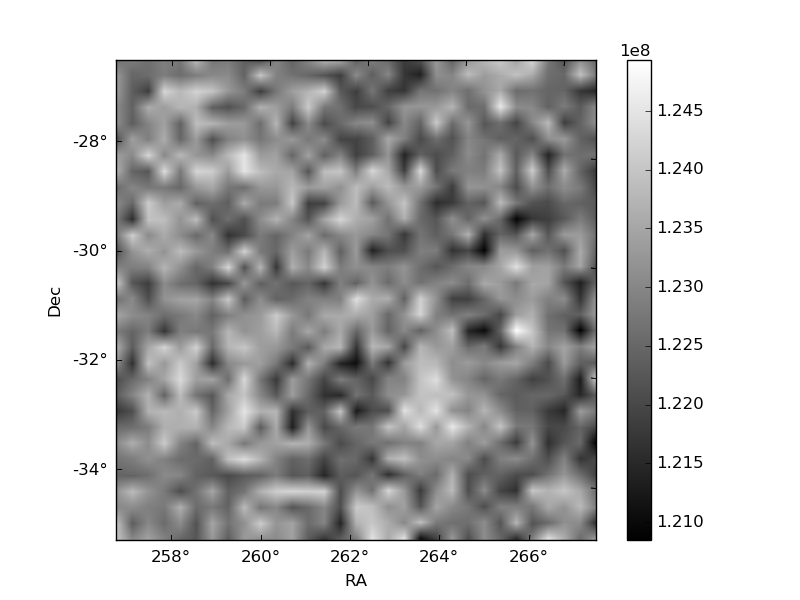
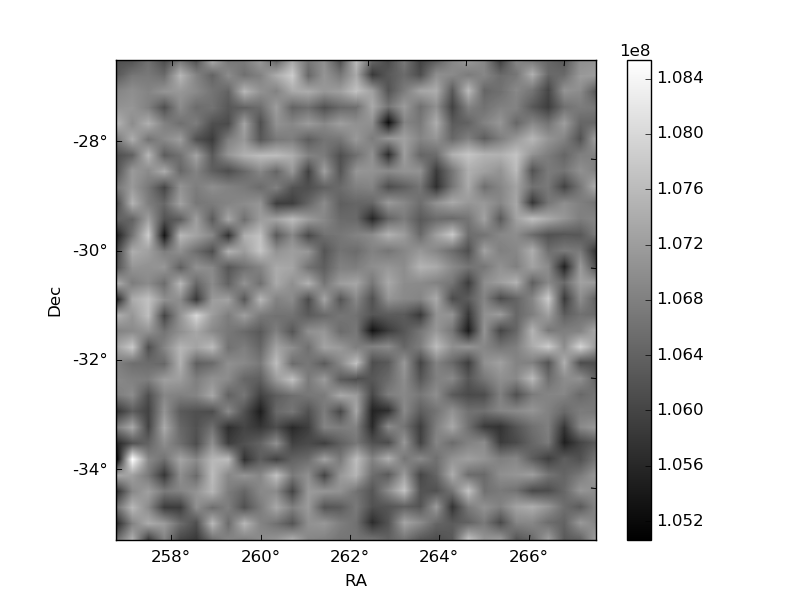
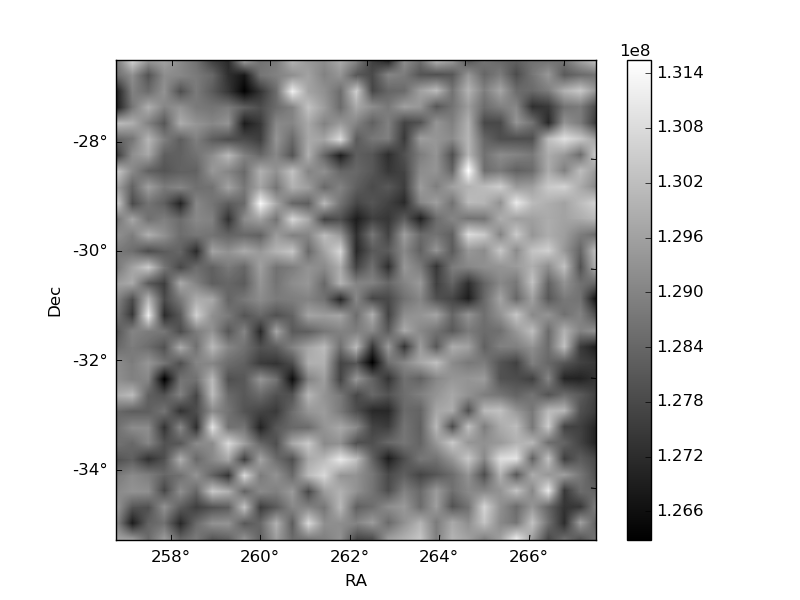
Histogram calculated using DETX and DETY for each event in the final _common_clean file
| Quadrant A | 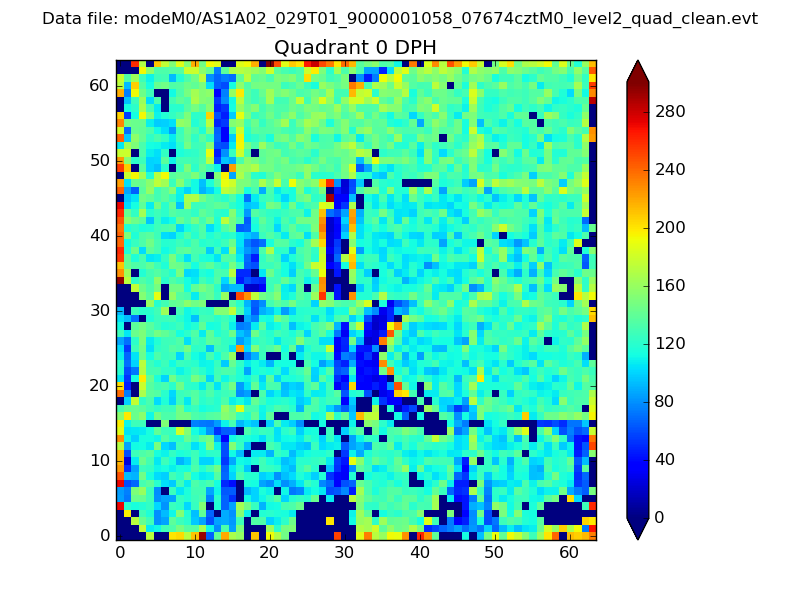 |
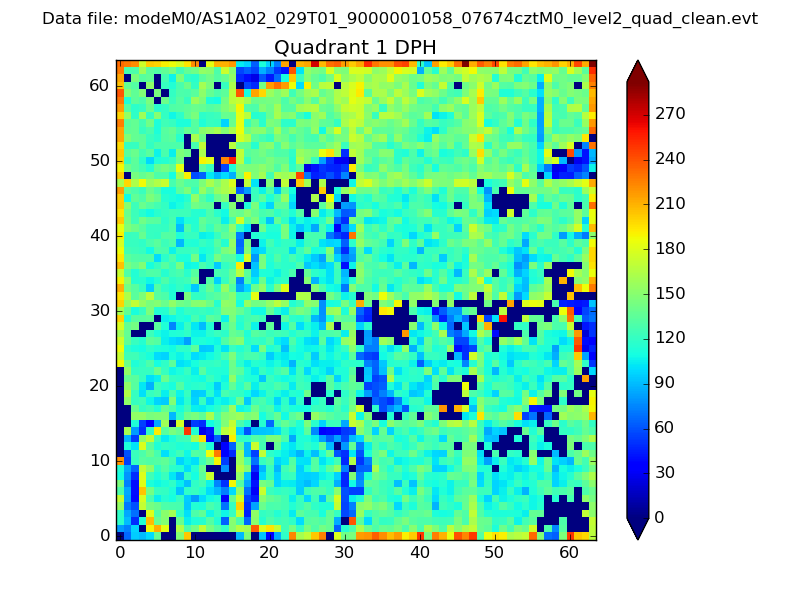 |
Quadrant B |
|---|---|---|---|
| Quadrant D | 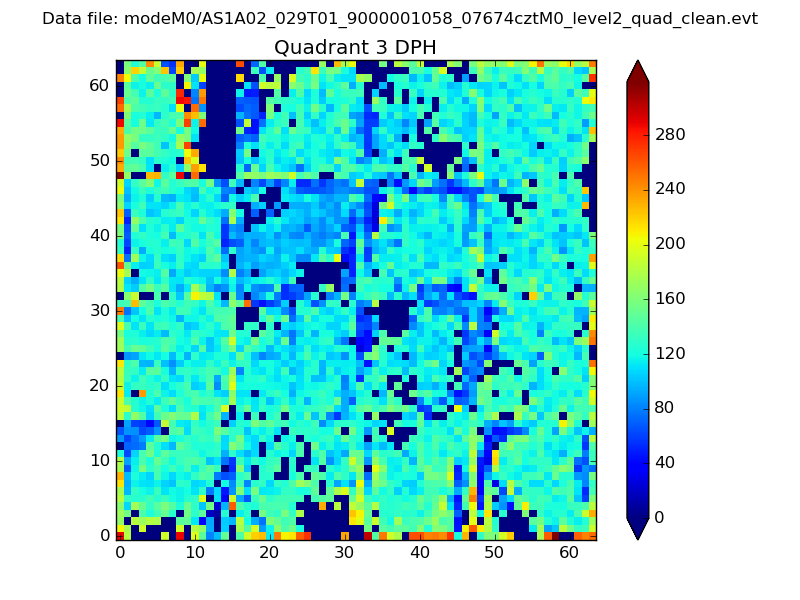 |
 |
Quadrant C |
| Plot type | Count rate plots | Images |
|---|---|---|
| Comparison with Poisson distribution Blue bars denote a histogram of data divided into 1 sec bins. Red curve is a Poisson curve with rate = median count rate of data. |
 |
 |
| Quadrant-wise count rates Data is divided into 100 sec bins |
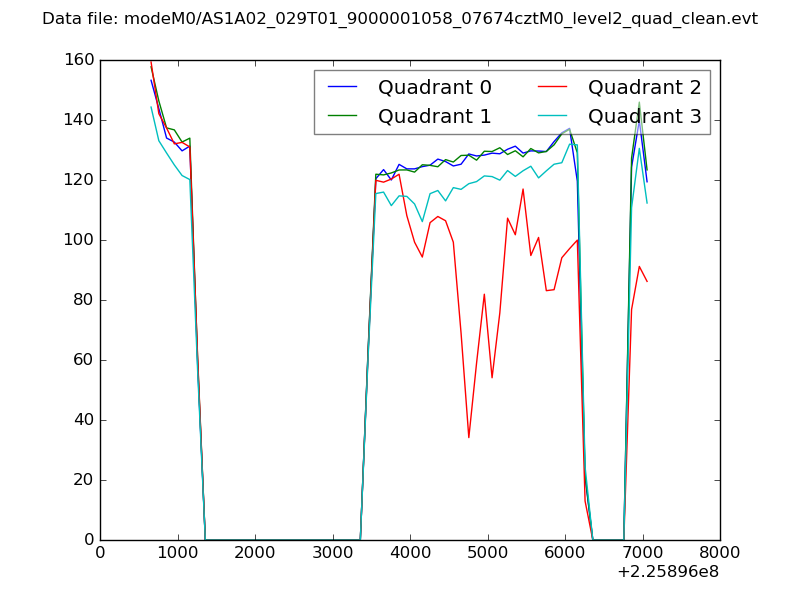 |
|
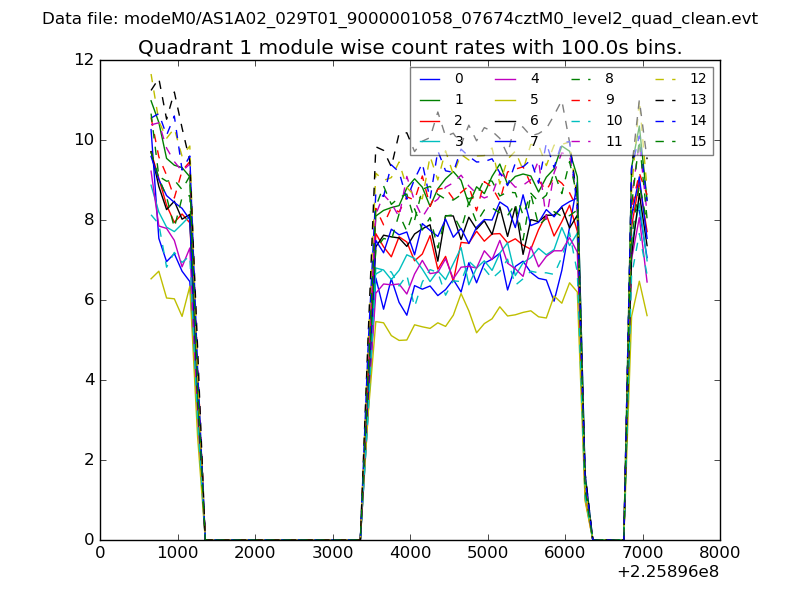
| Module-wise count rates for Quadrant A Data is divided into 100 sec bins |
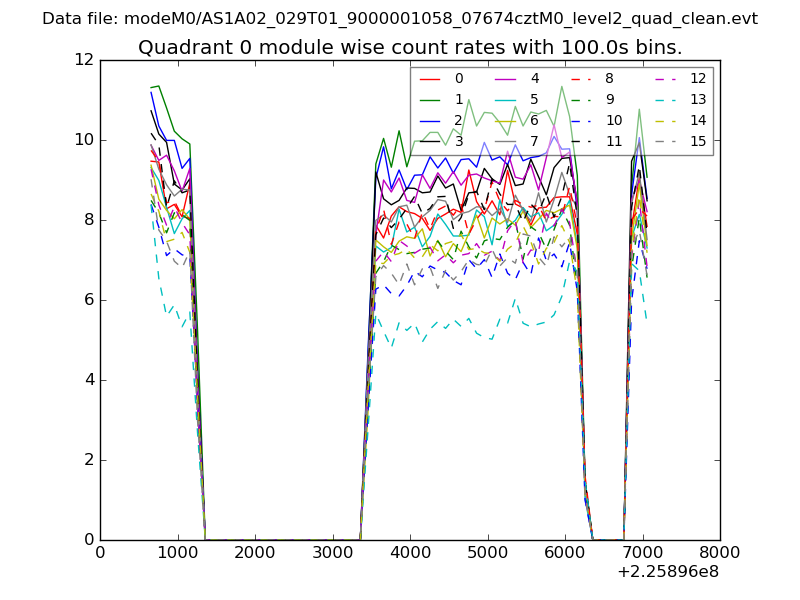 |
 |
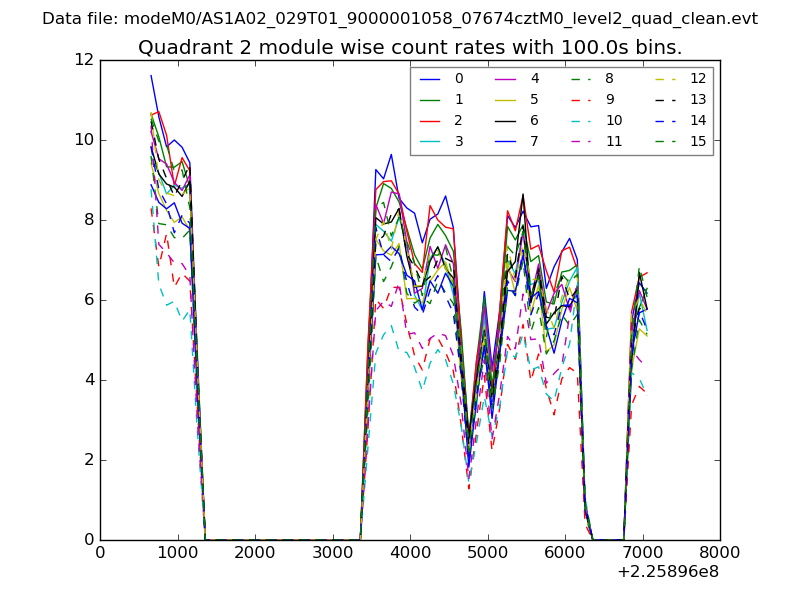
| Module-wise count rates for Quadrant B Data is divided into 100 sec bins |
 |
 |
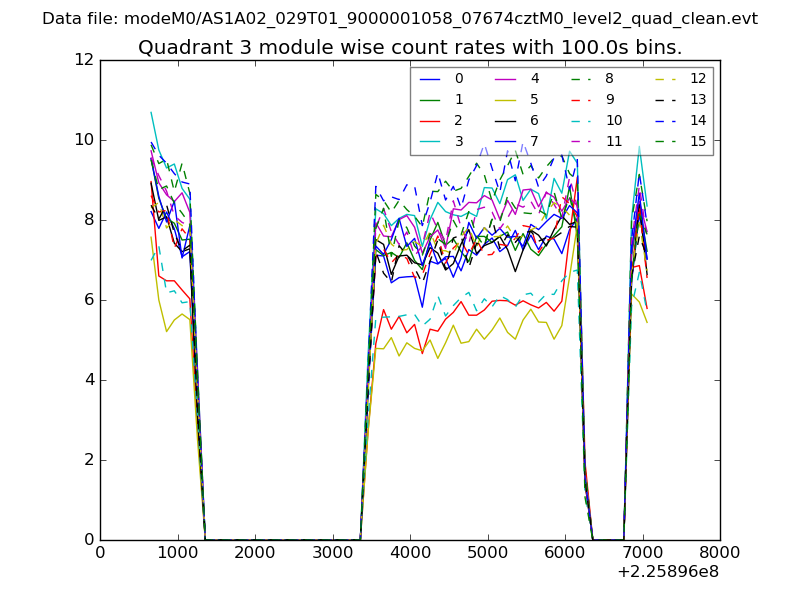
| Module-wise count rates for Quadrant C Data is divided into 100 sec bins |
 |
 |
| Module-wise count rates for Quadrant D Data is divided into 100 sec bins |
 |
 |
| Parameter | Plot |
|---|---|
| CZT HV Monitor | 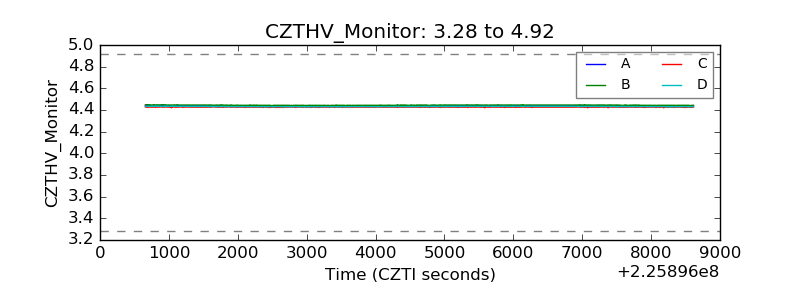 |
| D_VDD | 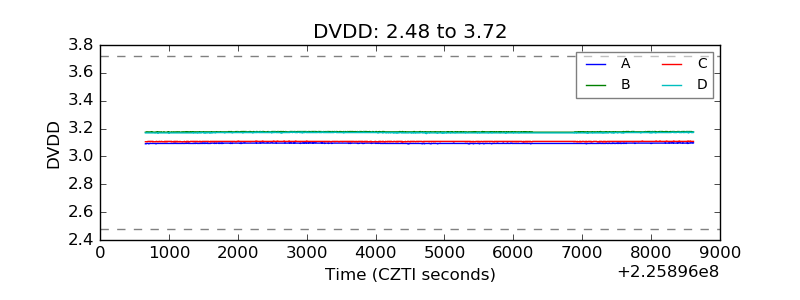 |
| Temperature 1 |  |
| Veto HV Monitor | 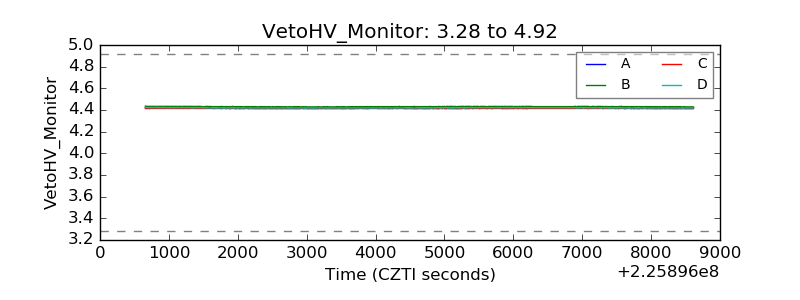 |
| Veto LLD | 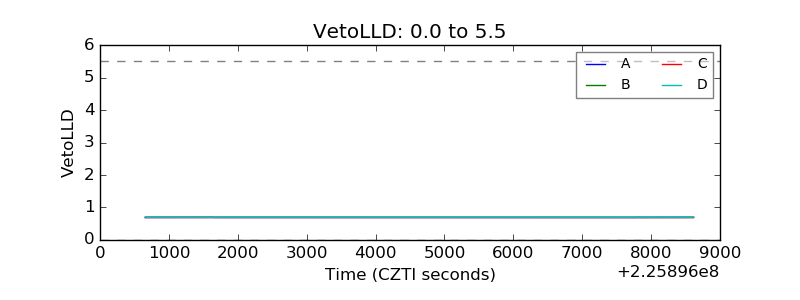 |
| Alpha Counter | 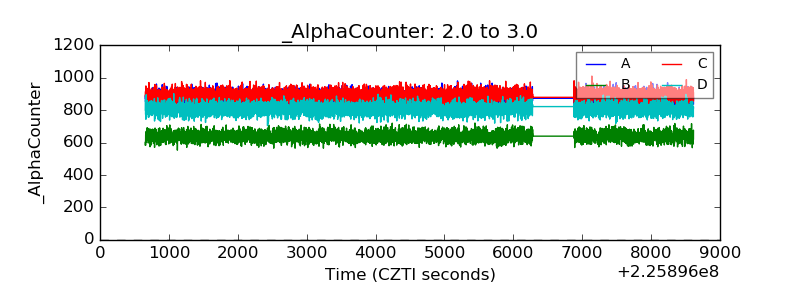 |
| _CPM_Rate | 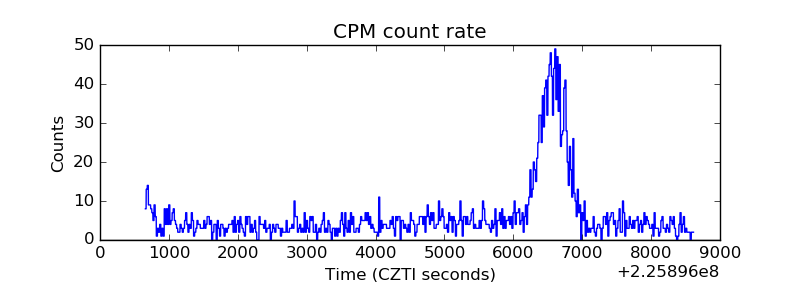 |
| CZT Counter | 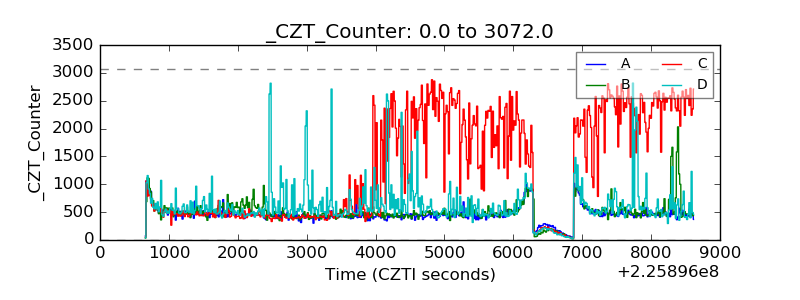 |
| +2.5 Volts monitor |  |
| +5 Volts monitor |  |
| _ROLL_ROT | 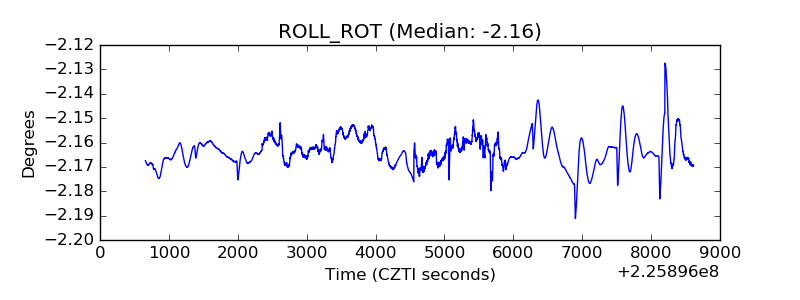 |
| _Roll_DEC |  |
| _Roll_RA | 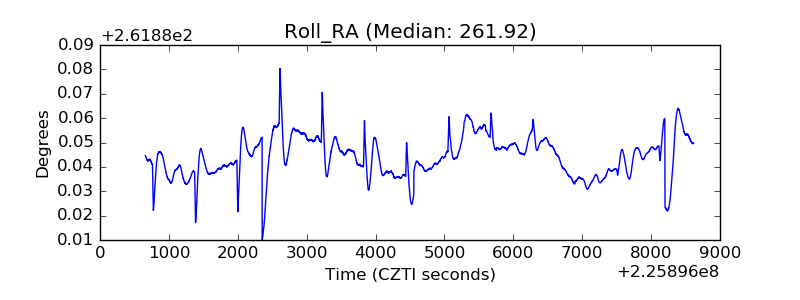 |
| Veto Counter | 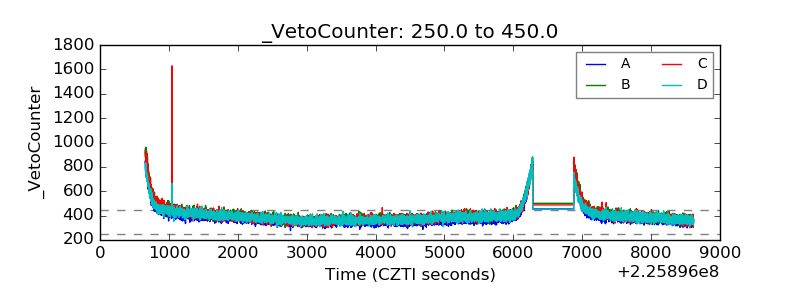 |