| Param | Original file | Final file |
|---|---|---|
| Filename | modeM0/AS1A02_029T01_9000001058_07675cztM0_level2.evt | modeM0/AS1A02_029T01_9000001058_07675cztM0_level2_quad_clean.evt |
| Size (bytes) | 945,293,760 | 75,208,320 |
| Size | 901.5 MB | 71.7 MB |
| Events in quadrant A | 3,666,923 | 477,653 |
| Events in quadrant B | 3,976,733 | 484,271 |
| Events in quadrant C | 15,760,417 | 326,456 |
| Events in quadrant D | 4,702,714 | 451,306 |
| Mode M9 | |||
|---|---|---|---|
| Quadrant | BADHDUFLAG | Total packets | Discarded packets |
| A | 0 | 2 | 0 |
| B | 0 | 2 | 0 |
| C | 0 | 2 | 0 |
| D | 0 | 2 | 0 |
| Mode M0 | |||
|---|---|---|---|
| Quadrant | BADHDUFLAG | Total packets | Discarded packets |
| A | 0 | 16120 | 3 |
| B | 0 | 16847 | 2 |
| C | 0 | 51985 | 2 |
| D | 0 | 19138 | 2 |
| Mode SS | |||
|---|---|---|---|
| Quadrant | BADHDUFLAG | Total packets | Discarded packets |
| A | 0 | 158 | 0 |
| B | 0 | 158 | 0 |
| C | 0 | 158 | 0 |
| D | 0 | 158 | 0 |
| Quadrant | Total seconds | Saturated seconds | Saturation percentage |
|---|---|---|---|
| A | 7701 | 187 | 2.428256% |
| B | 7701 | 248 | 3.220361% |
| C | 7701 | 5762 | 74.821452% |
| D | 7702 | 287 | 3.726305% |
Noise dominated data is calculated using 1-second bins in cleaned event files. If a bin has >2000 counts, and if more than 50% of those come from <1% of pixels, then it is considered to be noise-dominated and hence unusable.
| Quadrant | # 1 sec bins | Bins with >0 counts | Bins with >2000 counts | High rate bins dominated by noise | Noise dominated (total time) | Noise dominated (detector-on time) | Marked lightcurve |
|---|---|---|---|---|---|---|---|
| A | 7926 | 7702 | 0 | 0 | 0.00% | 0.00% | 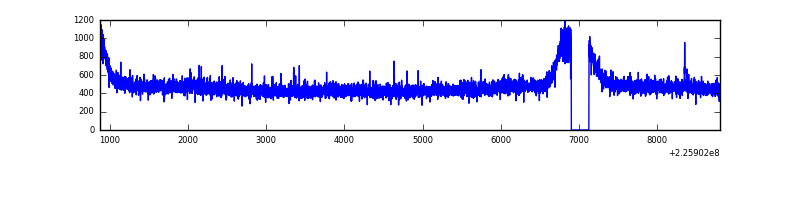 |
| B | 7926 | 7702 | 33 | 33 | 0.42% | 0.43% | 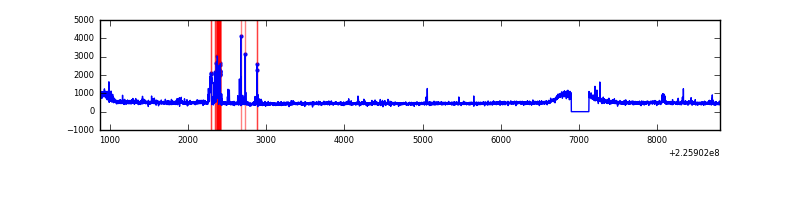 |
| C | 7926 | 7701 | 4810 | 4810 | 60.69% | 62.46% | 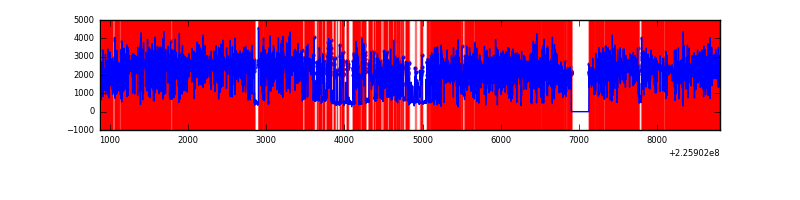 |
| D | 7927 | 7703 | 134 | 134 | 1.69% | 1.74% | 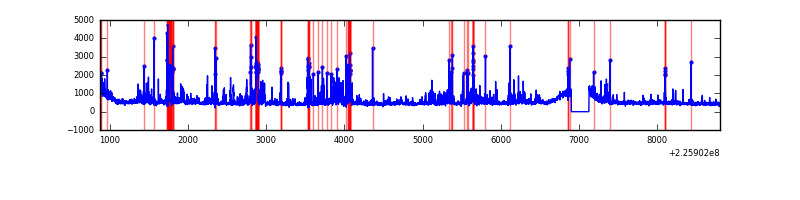 |
Top three noisy pixels from each quadrant. If the there are fewer than three noisy pixels in the level2.evt file, extra rows are filled as -1
| Pixel properties | Quadrant properties | ||||||
|---|---|---|---|---|---|---|---|
| Quadrant | DetID | PixID | Counts | Sigma | Mean | Median | Sigma |
| A | 0 | 226 | 9111 | 41.87 | 947 | 926 | 195.5 |
| A | 12 | 194 | 8441 | 38.45 | 947 | 926 | 195.5 |
| A | 3 | 1 | 7743 | 34.88 | 947 | 926 | 195.5 |
| B | 4 | 173 | 190546 | 1029.17 | 949 | 925 | 184.2 |
| B | 0 | 219 | 37969 | 201.06 | 949 | 925 | 184.2 |
| B | 0 | 214 | 33997 | 179.5 | 949 | 925 | 184.2 |
| C | 9 | 68 | 13389089 | 96860.49 | 590 | 593 | 138.2 |
| C | 8 | 208 | 62919 | 450.9 | 590 | 593 | 138.2 |
| C | 13 | 61 | 4475 | 28.08 | 590 | 593 | 138.2 |
| D | 2 | 152 | 618796 | 2756.96 | 914 | 888 | 224.1 |
| D | 12 | 0 | 168641 | 748.47 | 914 | 888 | 224.1 |
| D | 12 | 233 | 138945 | 615.98 | 914 | 888 | 224.1 |
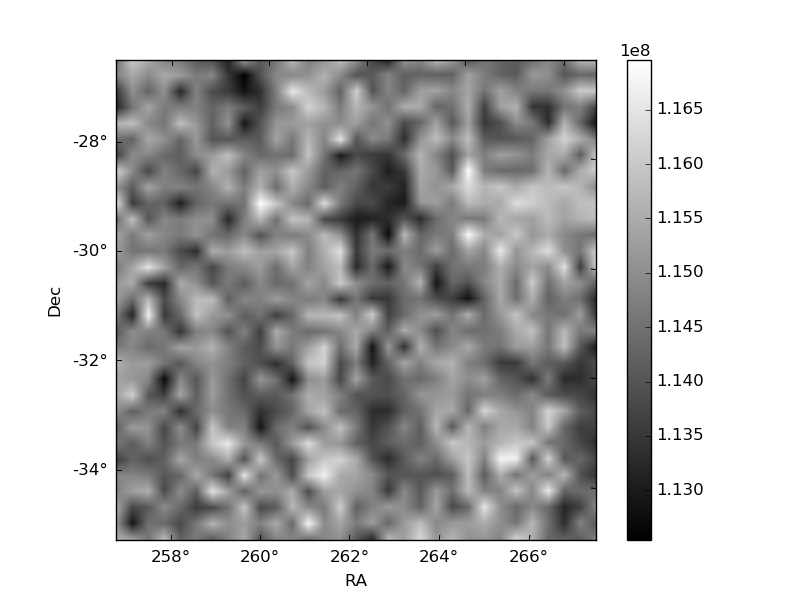
Histogram calculated using DETX and DETY for each event in the final _common_clean file
| Quadrant A | 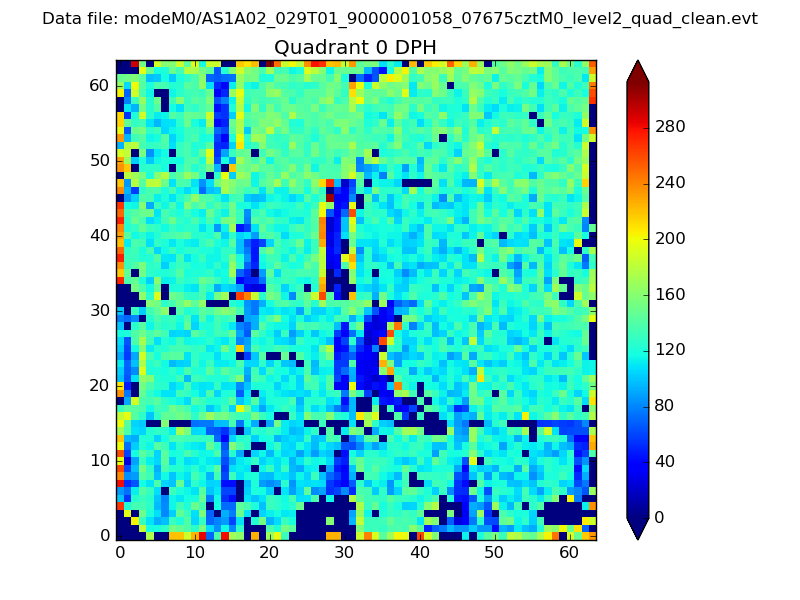 |
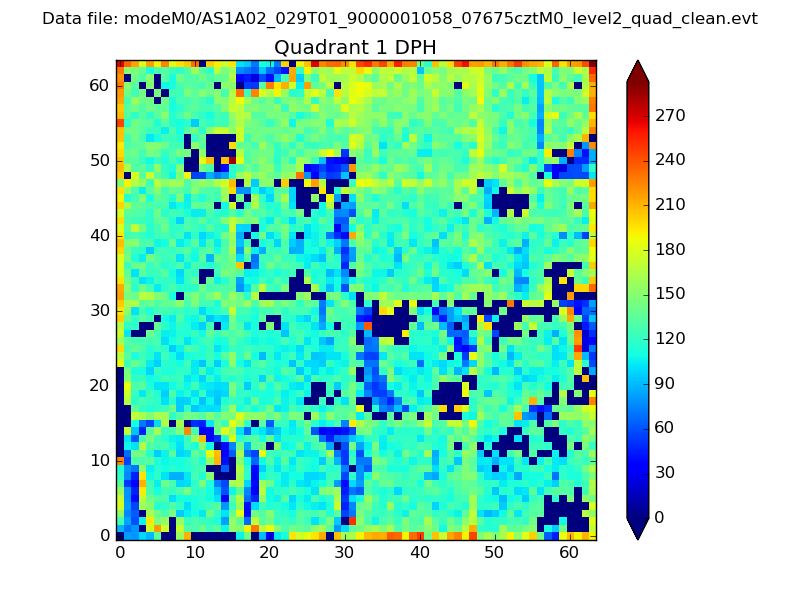 |
Quadrant B |
|---|---|---|---|
| Quadrant D | 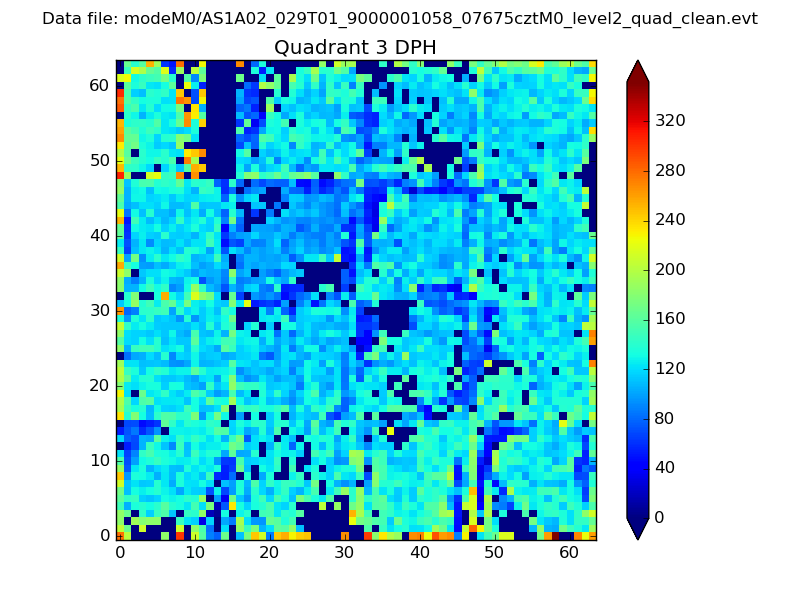 |
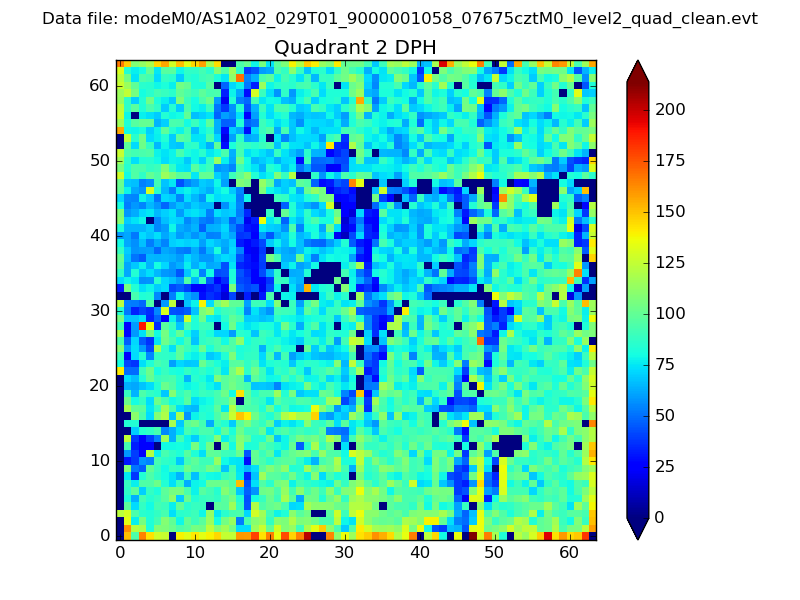 |
Quadrant C |
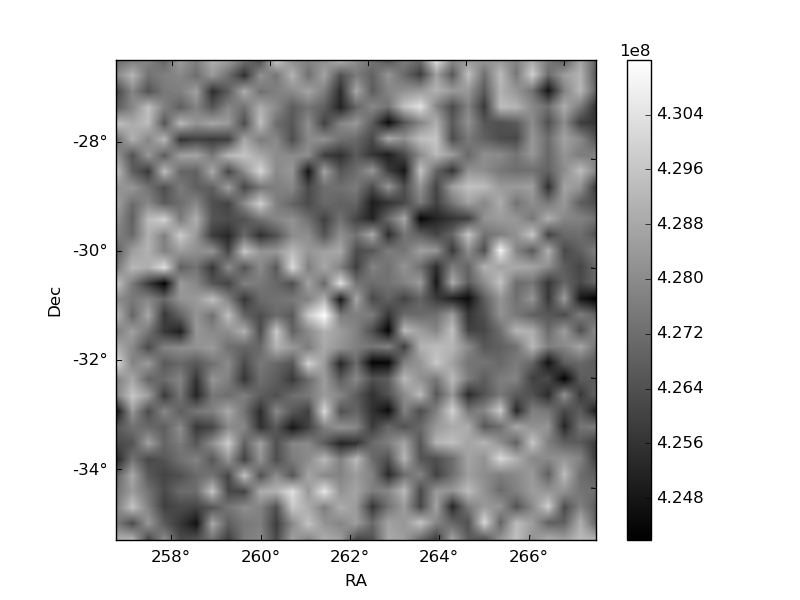
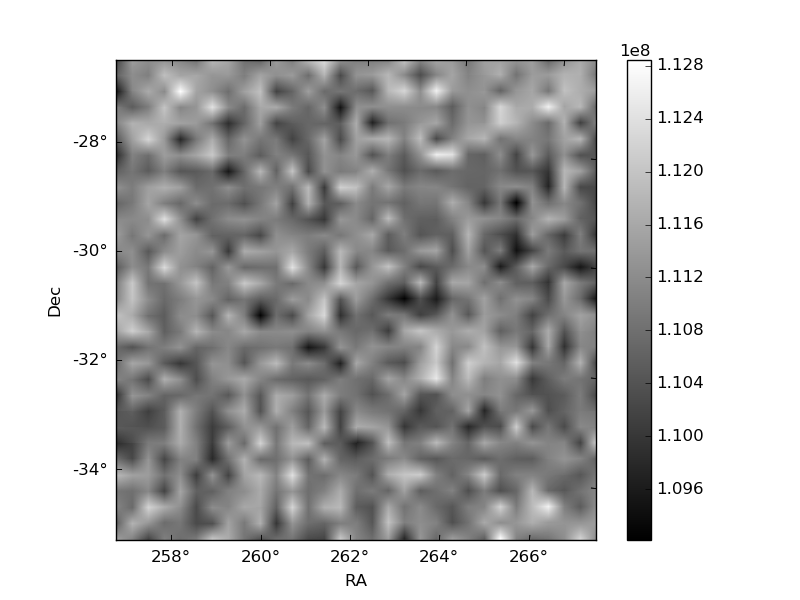
| Plot type | Count rate plots | Images |
|---|---|---|
| Comparison with Poisson distribution Blue bars denote a histogram of data divided into 1 sec bins. Red curve is a Poisson curve with rate = median count rate of data. |
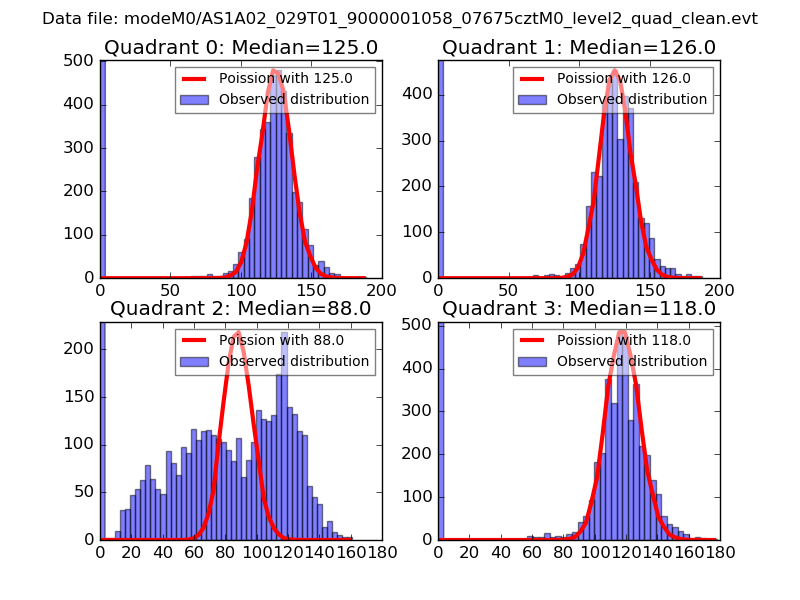 |
 |
| Quadrant-wise count rates Data is divided into 100 sec bins |
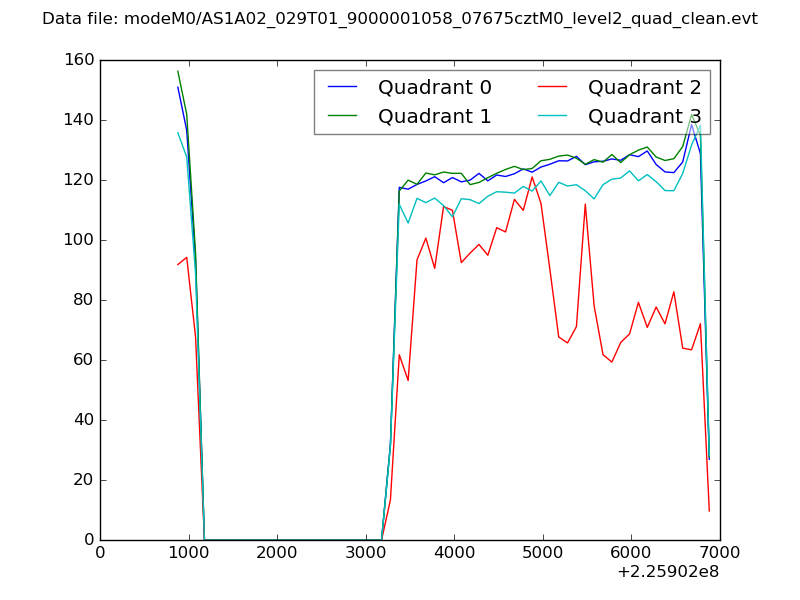 |
|
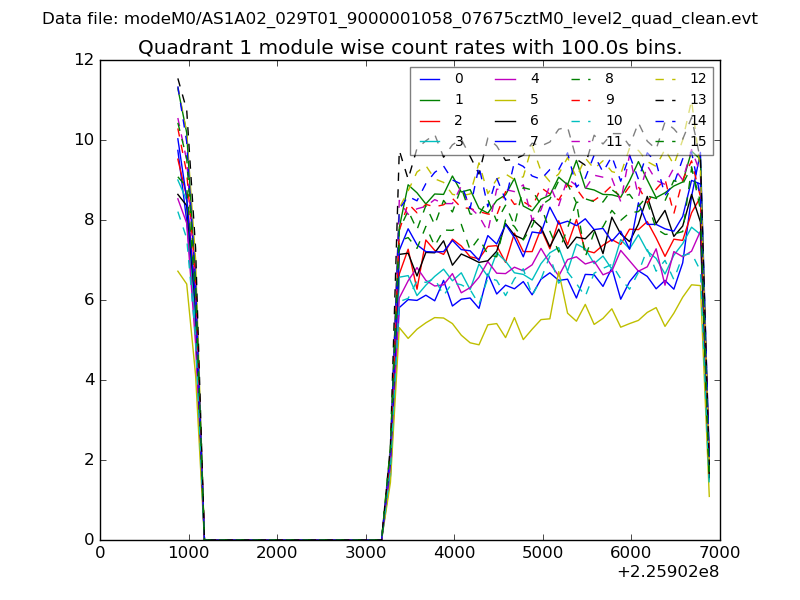
| Module-wise count rates for Quadrant A Data is divided into 100 sec bins |
 |
 |
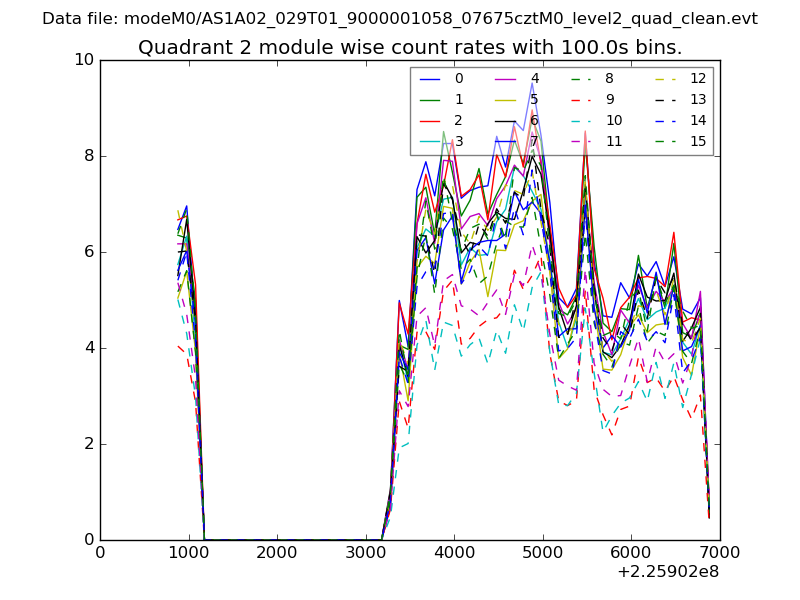
| Module-wise count rates for Quadrant B Data is divided into 100 sec bins |
 |
 |
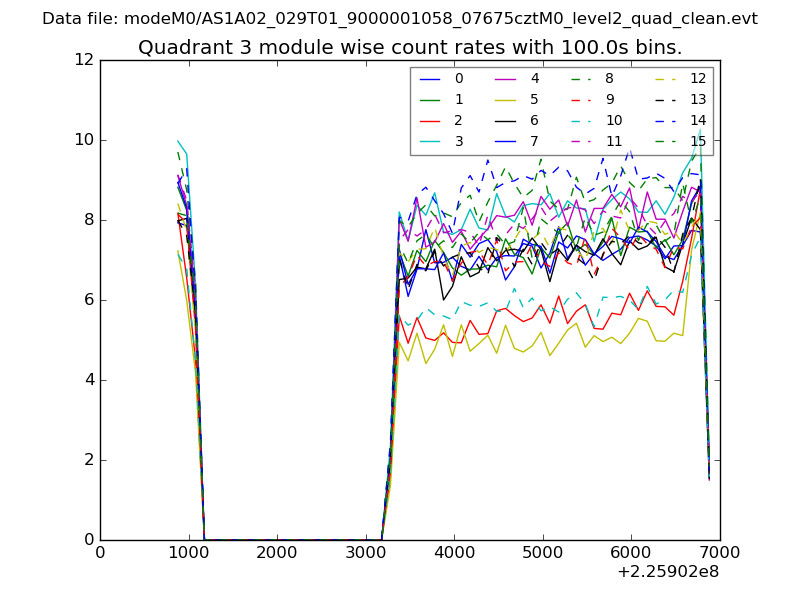
| Module-wise count rates for Quadrant C Data is divided into 100 sec bins |
 |
 |
| Module-wise count rates for Quadrant D Data is divided into 100 sec bins |
 |
 |
| Parameter | Plot |
|---|---|
| CZT HV Monitor | 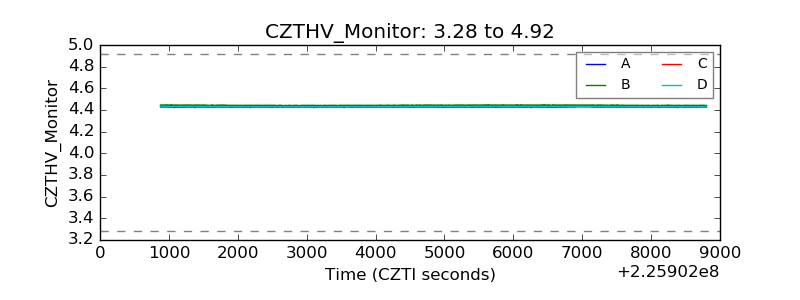 |
| D_VDD |  |
| Temperature 1 |  |
| Veto HV Monitor | 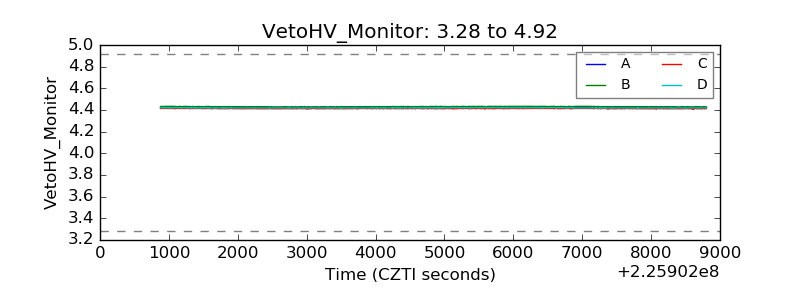 |
| Veto LLD | 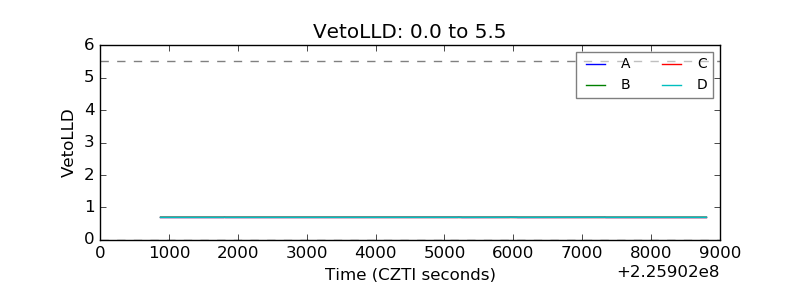 |
| Alpha Counter | 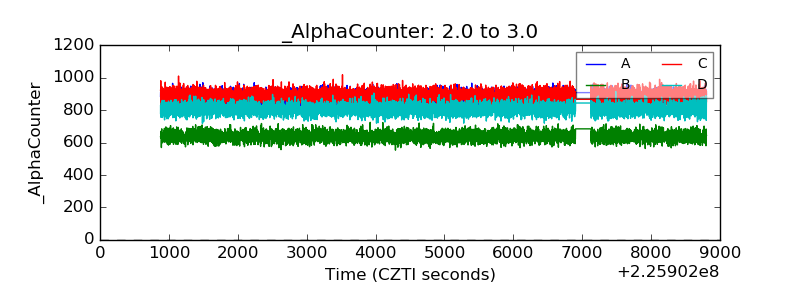 |
| _CPM_Rate | 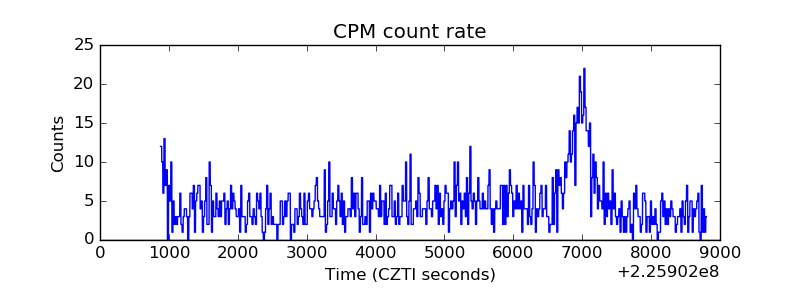 |
| CZT Counter | 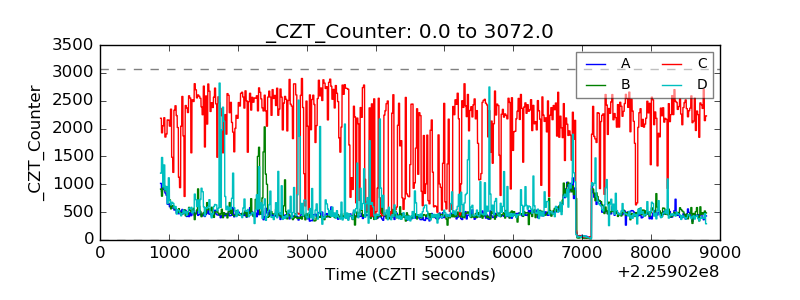 |
| +2.5 Volts monitor |  |
| +5 Volts monitor |  |
| _ROLL_ROT | 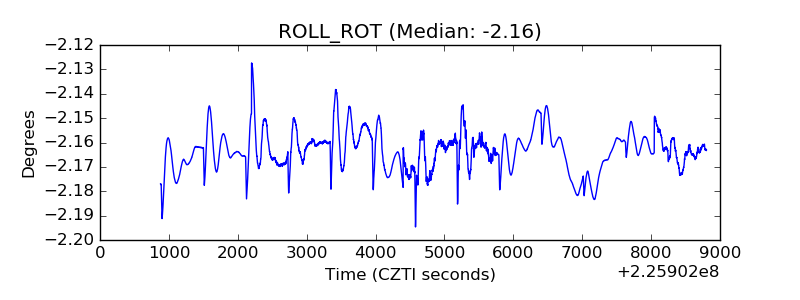 |
| _Roll_DEC | 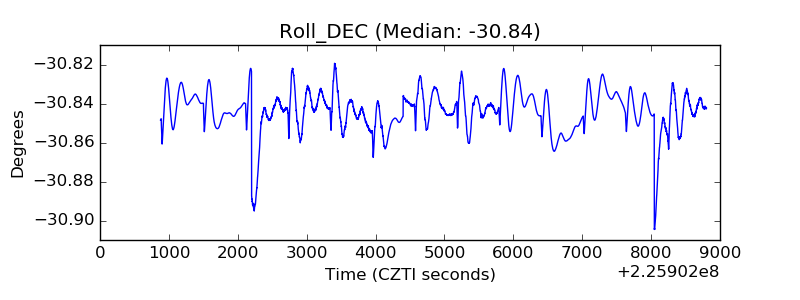 |
| _Roll_RA | 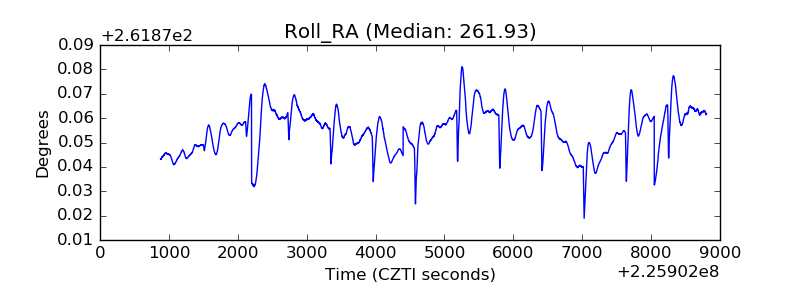 |
| Veto Counter | 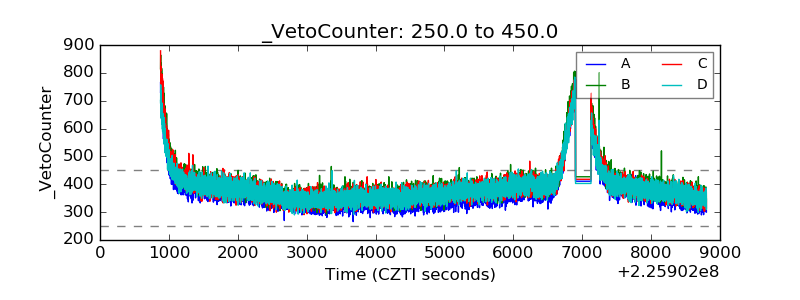 |