| Param | Original file | Final file |
|---|---|---|
| Filename | modeM0/AS1A02_029T01_9000001058_07676cztM0_level2.evt | modeM0/AS1A02_029T01_9000001058_07676cztM0_level2_quad_clean.evt |
| Size (bytes) | 907,974,720 | 69,776,640 |
| Size | 865.9 MB | 66.5 MB |
| Events in quadrant A | 3,385,088 | 442,087 |
| Events in quadrant B | 3,678,447 | 447,249 |
| Events in quadrant C | 14,747,232 | 301,033 |
| Events in quadrant D | 5,194,210 | 413,353 |
| Mode M9 | |||
|---|---|---|---|
| Quadrant | BADHDUFLAG | Total packets | Discarded packets |
| A | 0 | 2 | 0 |
| B | 0 | 2 | 0 |
| C | 0 | 2 | 0 |
| D | 0 | 2 | 0 |
| Mode M0 | |||
|---|---|---|---|
| Quadrant | BADHDUFLAG | Total packets | Discarded packets |
| A | 0 | 15036 | 2 |
| B | 0 | 15746 | 1 |
| C | 0 | 48817 | 1 |
| D | 0 | 20499 | 1 |
| Mode SS | |||
|---|---|---|---|
| Quadrant | BADHDUFLAG | Total packets | Discarded packets |
| A | 0 | 148 | 0 |
| B | 0 | 148 | 0 |
| C | 0 | 148 | 0 |
| D | 0 | 148 | 0 |
| Quadrant | Total seconds | Saturated seconds | Saturation percentage |
|---|---|---|---|
| A | 7297 | 118 | 1.617103% |
| B | 7297 | 212 | 2.905304% |
| C | 7297 | 5120 | 70.165822% |
| D | 7297 | 504 | 6.906948% |
Noise dominated data is calculated using 1-second bins in cleaned event files. If a bin has >2000 counts, and if more than 50% of those come from <1% of pixels, then it is considered to be noise-dominated and hence unusable.
| Quadrant | # 1 sec bins | Bins with >0 counts | Bins with >2000 counts | High rate bins dominated by noise | Noise dominated (total time) | Noise dominated (detector-on time) | Marked lightcurve |
|---|---|---|---|---|---|---|---|
| A | 7462 | 7299 | 0 | 0 | 0.00% | 0.00% | 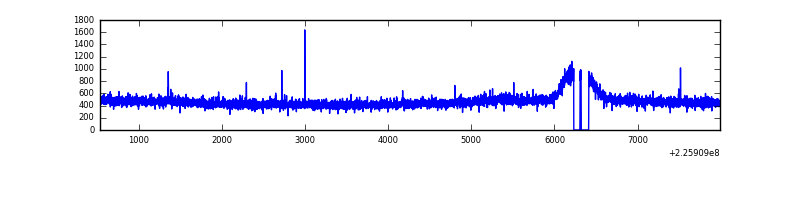 |
| B | 7462 | 7299 | 38 | 38 | 0.51% | 0.52% | 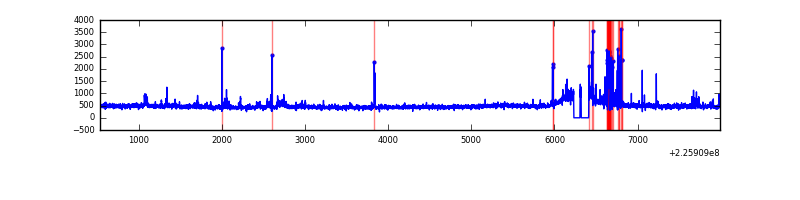 |
| C | 7461 | 7297 | 4162 | 4162 | 55.78% | 57.04% | 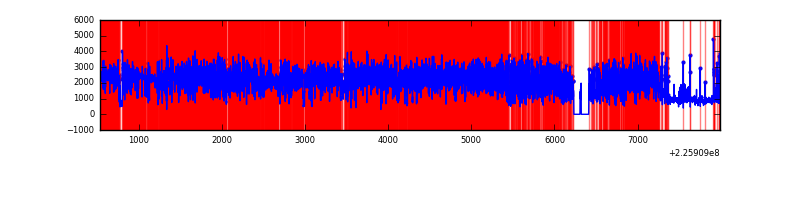 |
| D | 7462 | 7299 | 308 | 308 | 4.13% | 4.22% | 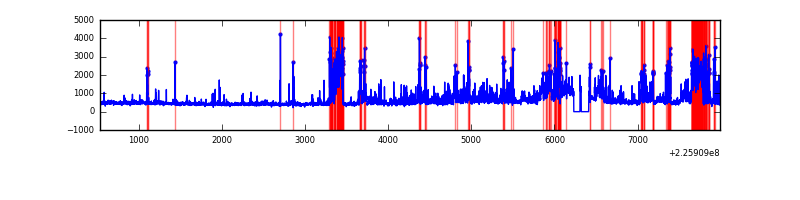 |
Top three noisy pixels from each quadrant. If the there are fewer than three noisy pixels in the level2.evt file, extra rows are filled as -1
| Pixel properties | Quadrant properties | ||||||
|---|---|---|---|---|---|---|---|
| Quadrant | DetID | PixID | Counts | Sigma | Mean | Median | Sigma |
| A | 0 | 226 | 8620 | 43.36 | 873 | 852 | 179.2 |
| A | 15 | 174 | 8344 | 41.82 | 873 | 852 | 179.2 |
| A | 12 | 194 | 7958 | 39.66 | 873 | 852 | 179.2 |
| B | 4 | 239 | 166381 | 987.83 | 870 | 848 | 167.6 |
| B | 4 | 173 | 69486 | 409.6 | 870 | 848 | 167.6 |
| B | 0 | 219 | 27311 | 157.92 | 870 | 848 | 167.6 |
| C | 9 | 68 | 12287075 | 84057.14 | 624 | 627 | 146.2 |
| C | 8 | 208 | 8139 | 51.39 | 624 | 627 | 146.2 |
| C | 12 | 4 | 6825 | 42.4 | 624 | 627 | 146.2 |
| D | 2 | 152 | 867866 | 4198.47 | 833 | 805 | 206.5 |
| D | 1 | 83 | 487128 | 2354.87 | 833 | 805 | 206.5 |
| D | 13 | 104 | 261511 | 1262.39 | 833 | 805 | 206.5 |
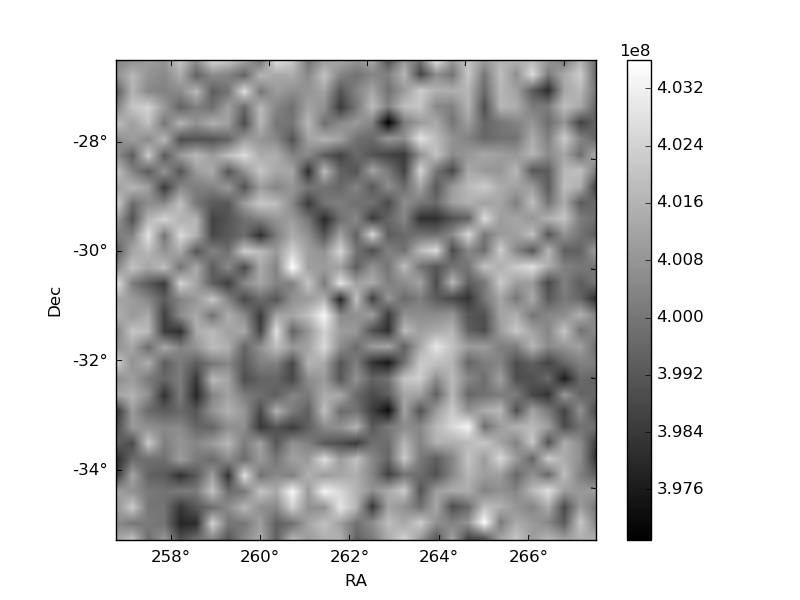
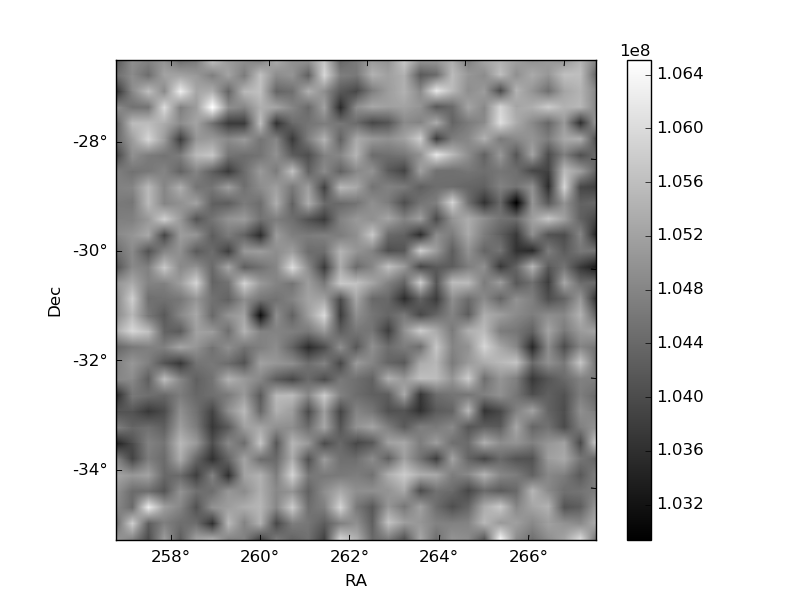
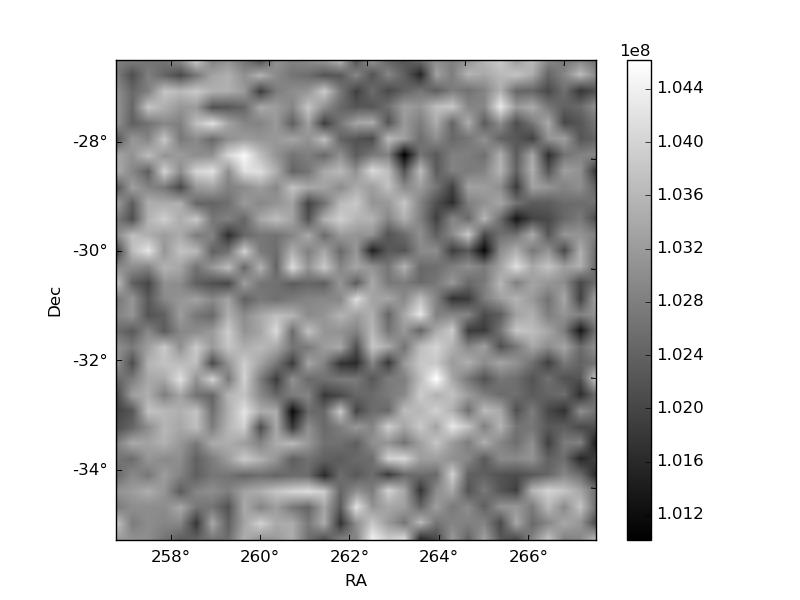
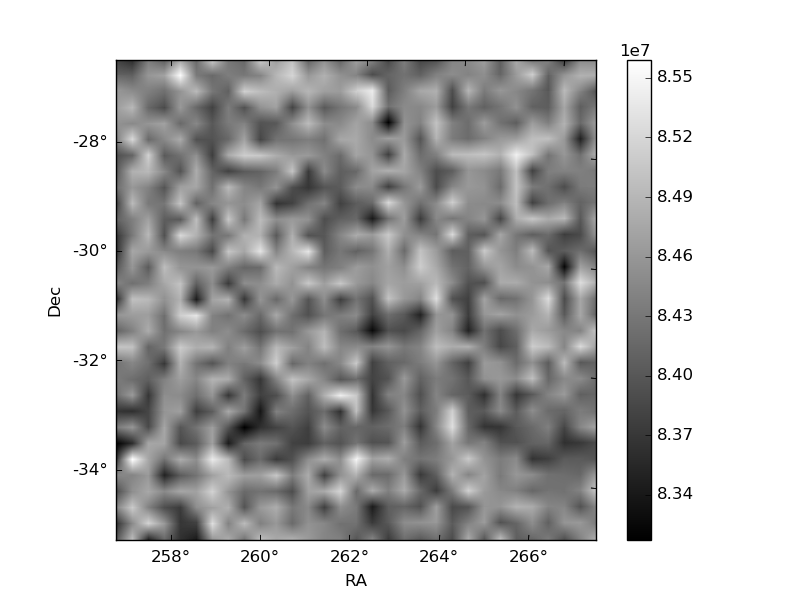
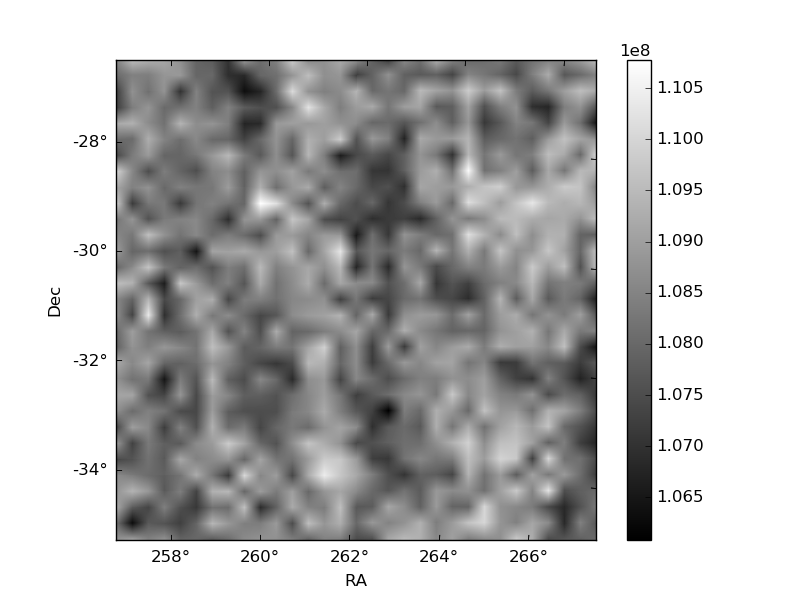
Histogram calculated using DETX and DETY for each event in the final _common_clean file
| Quadrant A | 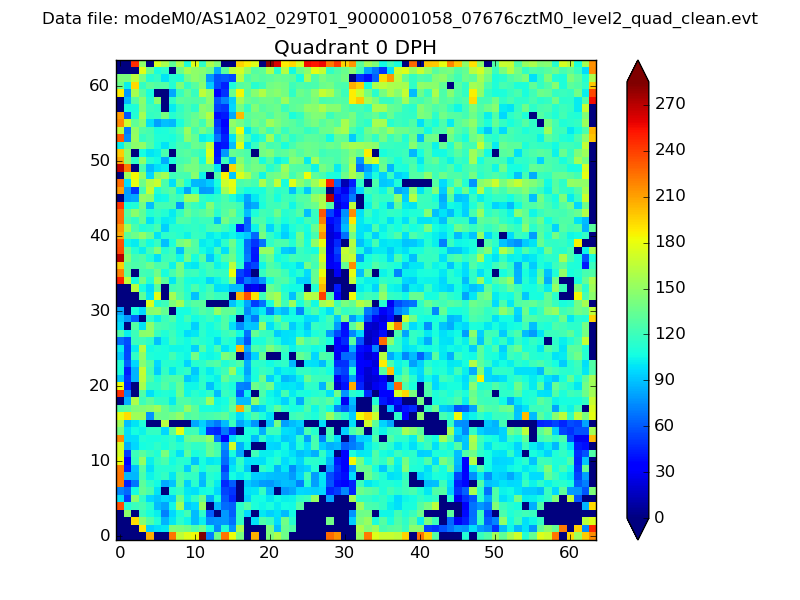 |
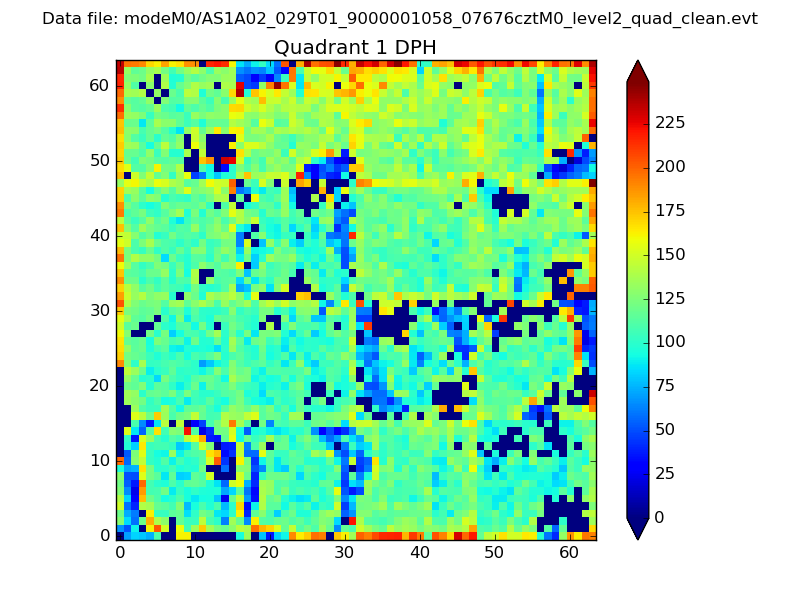 |
Quadrant B |
|---|---|---|---|
| Quadrant D | 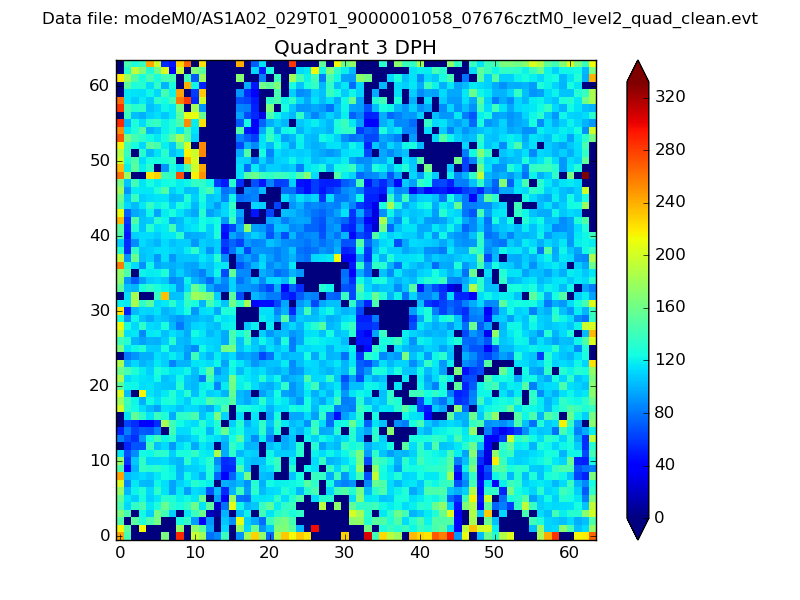 |
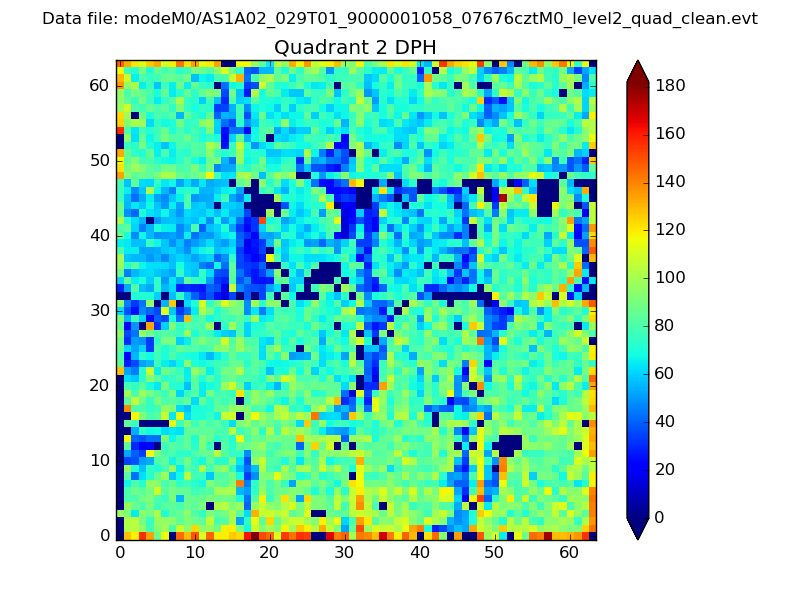 |
Quadrant C |
| Plot type | Count rate plots | Images |
|---|---|---|
| Comparison with Poisson distribution Blue bars denote a histogram of data divided into 1 sec bins. Red curve is a Poisson curve with rate = median count rate of data. |
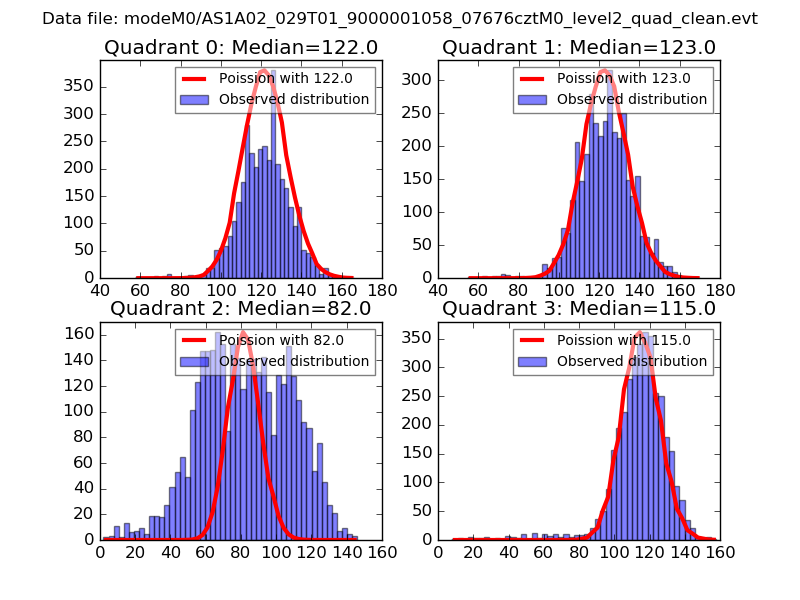 |
 |
| Quadrant-wise count rates Data is divided into 100 sec bins |
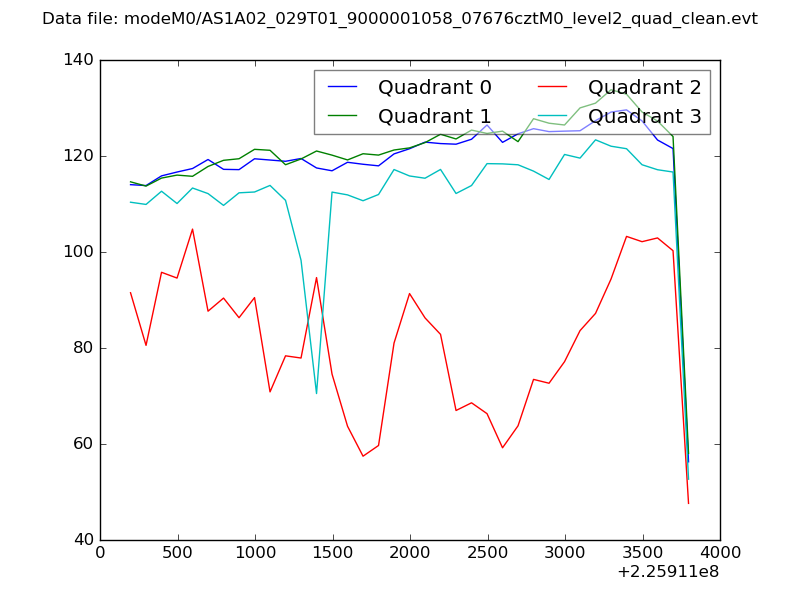 |
|
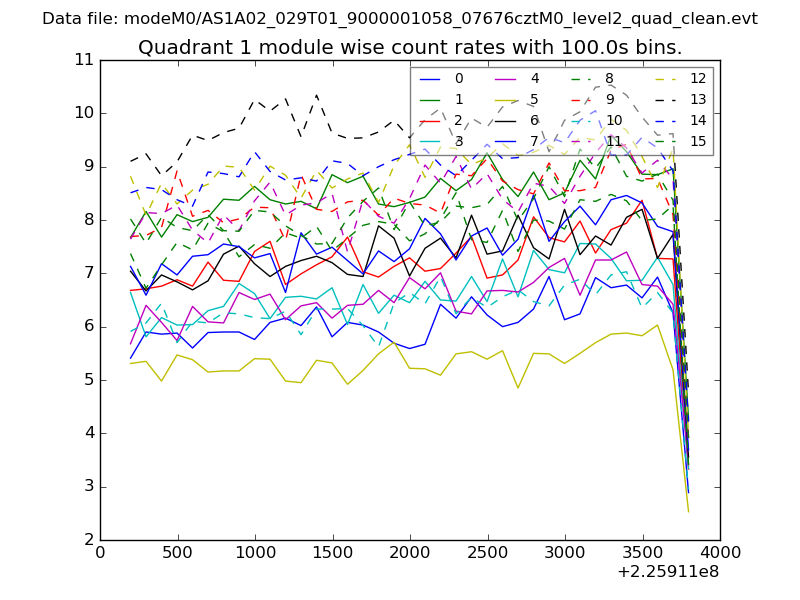
| Module-wise count rates for Quadrant A Data is divided into 100 sec bins |
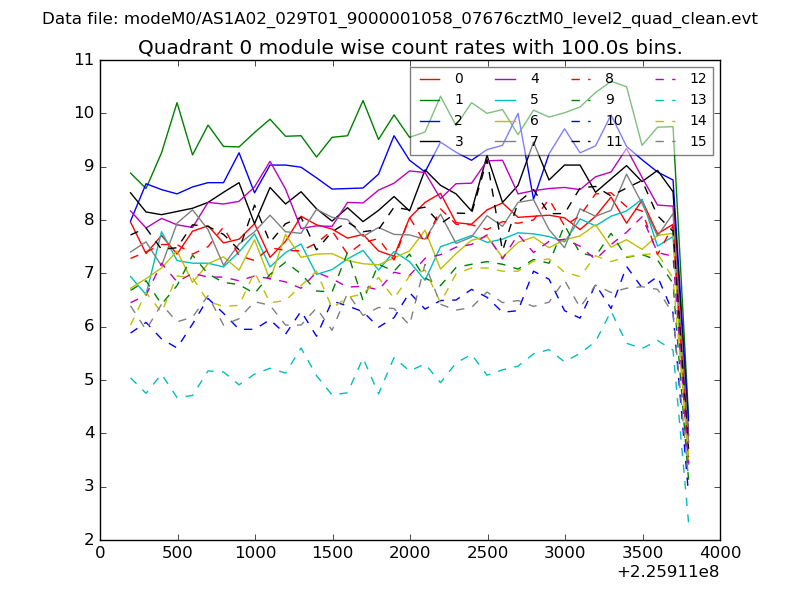 |
 |
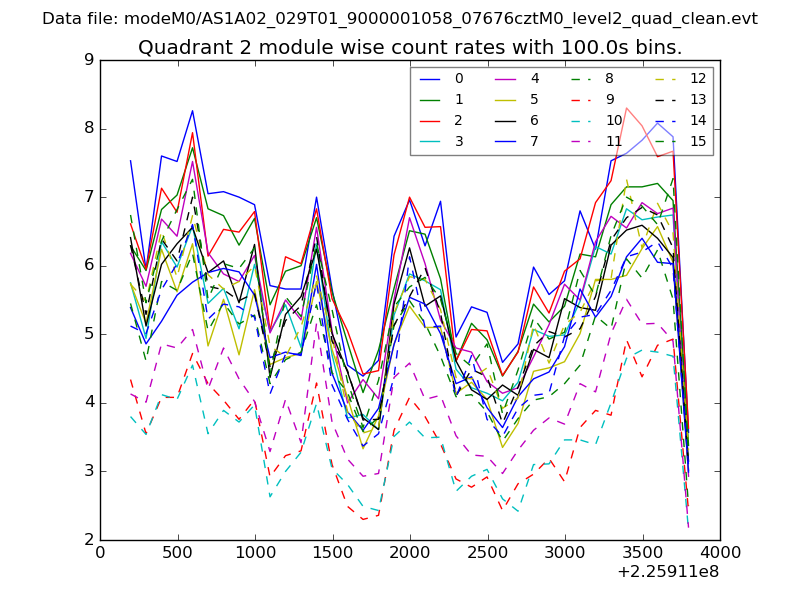
| Module-wise count rates for Quadrant B Data is divided into 100 sec bins |
 |
 |
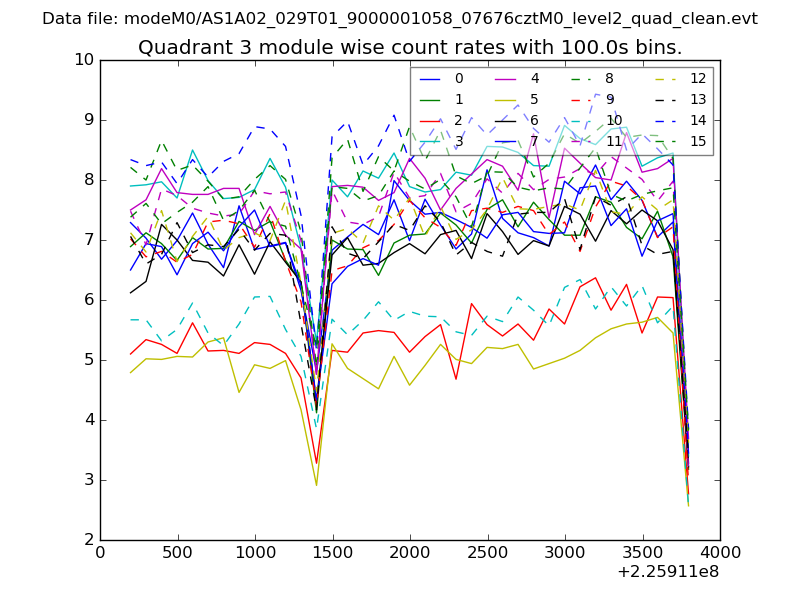
| Module-wise count rates for Quadrant C Data is divided into 100 sec bins |
 |
 |
| Module-wise count rates for Quadrant D Data is divided into 100 sec bins |
 |
 |
| Parameter | Plot |
|---|---|
| CZT HV Monitor | 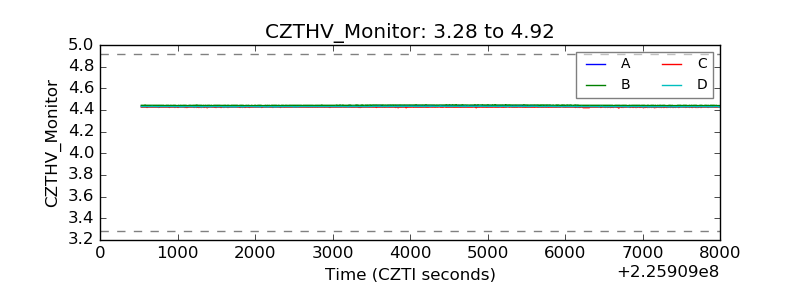 |
| D_VDD |  |
| Temperature 1 | 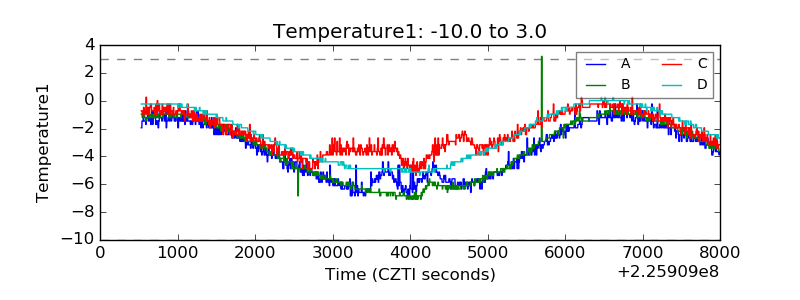 |
| Veto HV Monitor | 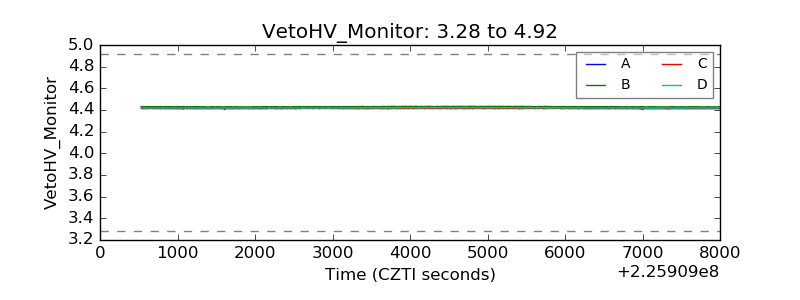 |
| Veto LLD | 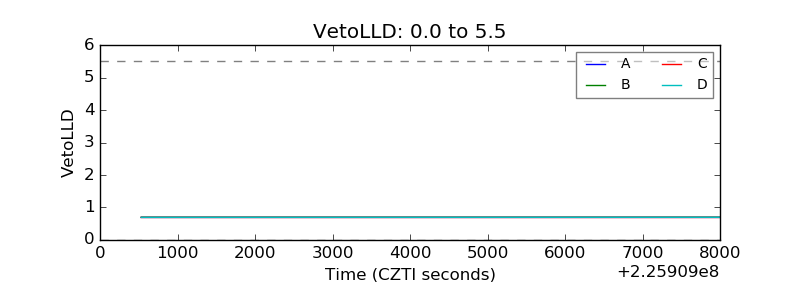 |
| Alpha Counter | 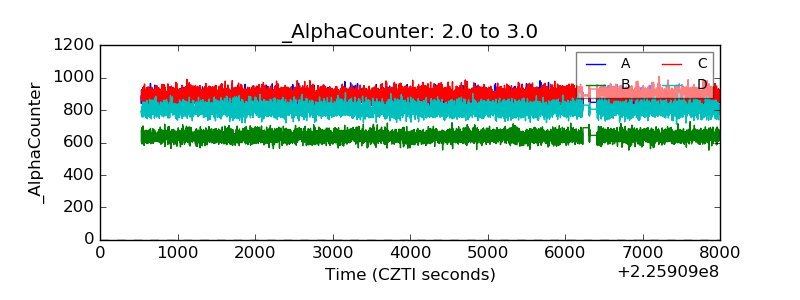 |
| _CPM_Rate | 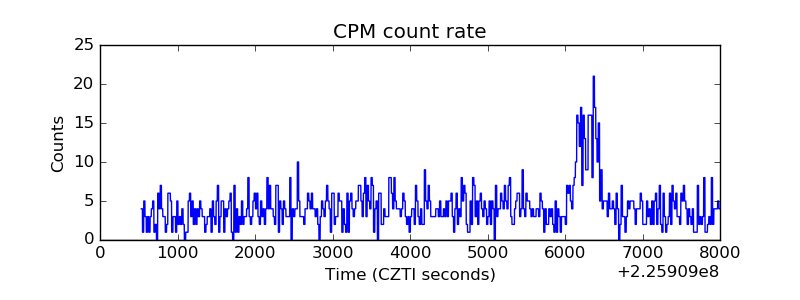 |
| CZT Counter | 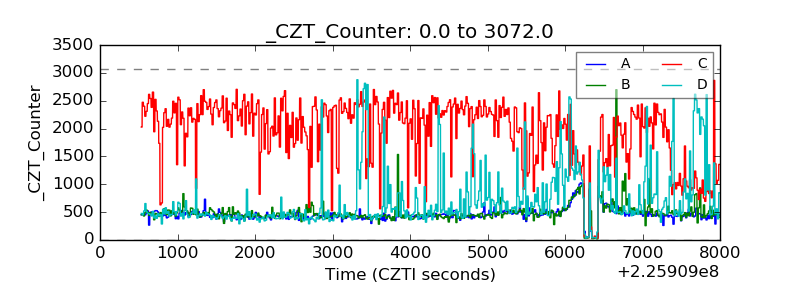 |
| +2.5 Volts monitor |  |
| +5 Volts monitor |  |
| _ROLL_ROT | 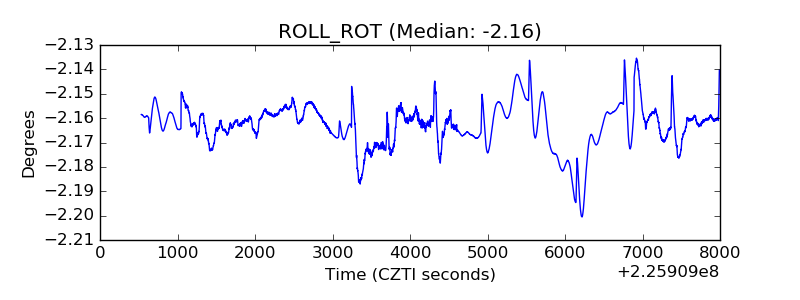 |
| _Roll_DEC | 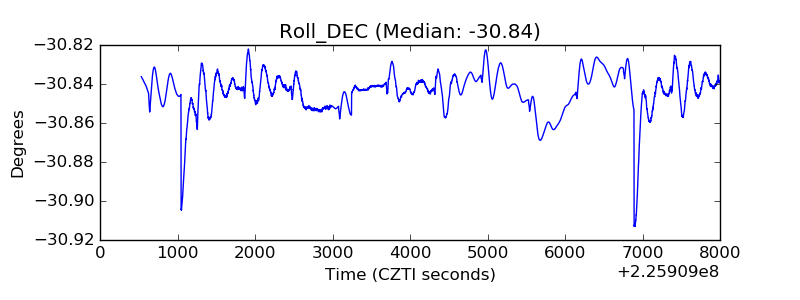 |
| _Roll_RA |  |
| Veto Counter | 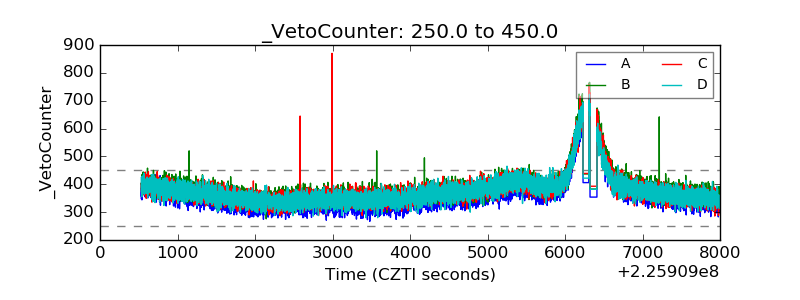 |