| Param | Original file | Final file |
|---|---|---|
| Filename | modeM0/AS1A02_029T01_9000001058_07677cztM0_level2.evt | modeM0/AS1A02_029T01_9000001058_07677cztM0_level2_quad_clean.evt |
| Size (bytes) | 936,155,520 | 81,276,480 |
| Size | 892.8 MB | 77.5 MB |
| Events in quadrant A | 3,882,075 | 508,461 |
| Events in quadrant B | 4,360,713 | 512,496 |
| Events in quadrant C | 14,026,971 | 390,568 |
| Events in quadrant D | 5,530,666 | 481,255 |
| Mode M9 | |||
|---|---|---|---|
| Quadrant | BADHDUFLAG | Total packets | Discarded packets |
| A | 0 | 6 | 0 |
| B | 0 | 6 | 0 |
| C | 0 | 6 | 0 |
| D | 0 | 6 | 0 |
| Mode M0 | |||
|---|---|---|---|
| Quadrant | BADHDUFLAG | Total packets | Discarded packets |
| A | 0 | 17050 | 3 |
| B | 0 | 18272 | 2 |
| C | 0 | 47295 | 2 |
| D | 0 | 21960 | 2 |
| Mode SS | |||
|---|---|---|---|
| Quadrant | BADHDUFLAG | Total packets | Discarded packets |
| A | 0 | 168 | 0 |
| B | 0 | 168 | 0 |
| C | 0 | 168 | 0 |
| D | 0 | 168 | 0 |
| Quadrant | Total seconds | Saturated seconds | Saturation percentage |
|---|---|---|---|
| A | 8165 | 191 | 2.339253% |
| B | 8165 | 345 | 4.225352% |
| C | 8165 | 3733 | 45.719535% |
| D | 8165 | 489 | 5.988977% |
Noise dominated data is calculated using 1-second bins in cleaned event files. If a bin has >2000 counts, and if more than 50% of those come from <1% of pixels, then it is considered to be noise-dominated and hence unusable.
| Quadrant | # 1 sec bins | Bins with >0 counts | Bins with >2000 counts | High rate bins dominated by noise | Noise dominated (total time) | Noise dominated (detector-on time) | Marked lightcurve |
|---|---|---|---|---|---|---|---|
| A | 8660 | 8169 | 0 | 0 | 0.00% | 0.00% | 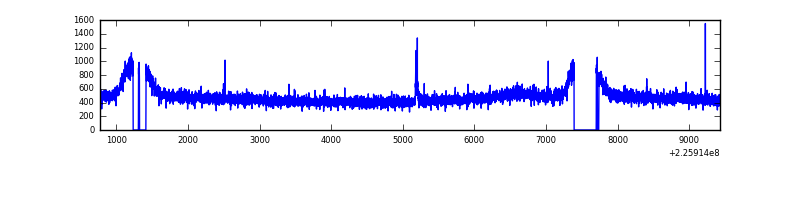 |
| B | 8660 | 8168 | 62 | 62 | 0.72% | 0.76% | 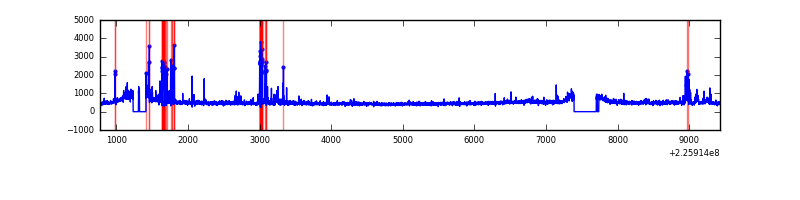 |
| C | 8660 | 8168 | 2926 | 2926 | 33.79% | 35.82% | 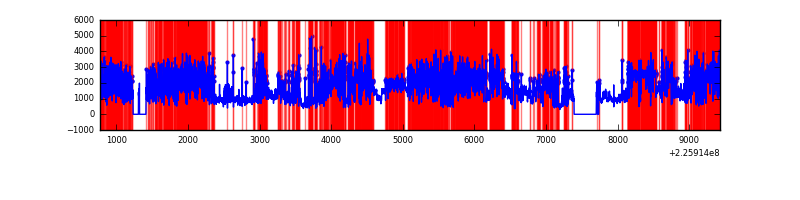 |
| D | 8660 | 8169 | 228 | 228 | 2.63% | 2.79% | 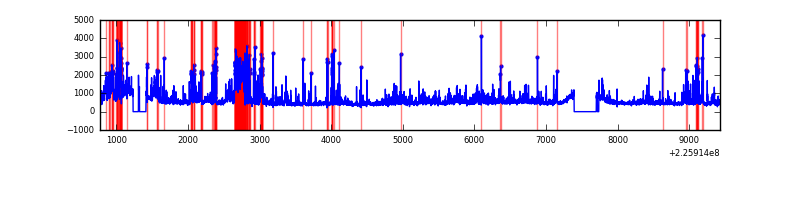 |
Top three noisy pixels from each quadrant. If the there are fewer than three noisy pixels in the level2.evt file, extra rows are filled as -1
| Pixel properties | Quadrant properties | ||||||
|---|---|---|---|---|---|---|---|
| Quadrant | DetID | PixID | Counts | Sigma | Mean | Median | Sigma |
| A | 13 | 248 | 14064 | 63.16 | 1000 | 973 | 207.3 |
| A | 0 | 226 | 10062 | 43.85 | 1000 | 973 | 207.3 |
| A | 12 | 194 | 8951 | 38.49 | 1000 | 973 | 207.3 |
| B | 4 | 239 | 281694 | 1455.19 | 996 | 970 | 192.9 |
| B | 0 | 219 | 111005 | 570.39 | 996 | 970 | 192.9 |
| B | 0 | 214 | 31754 | 159.57 | 996 | 970 | 192.9 |
| C | 9 | 68 | 10892588 | 58224.96 | 797 | 800 | 187.1 |
| C | 8 | 208 | 14619 | 73.87 | 797 | 800 | 187.1 |
| C | 13 | 61 | 6217 | 28.96 | 797 | 800 | 187.1 |
| D | 2 | 152 | 953602 | 3990.43 | 960 | 929 | 238.7 |
| D | 13 | 104 | 315512 | 1317.68 | 960 | 929 | 238.7 |
| D | 12 | 0 | 229345 | 956.76 | 960 | 929 | 238.7 |
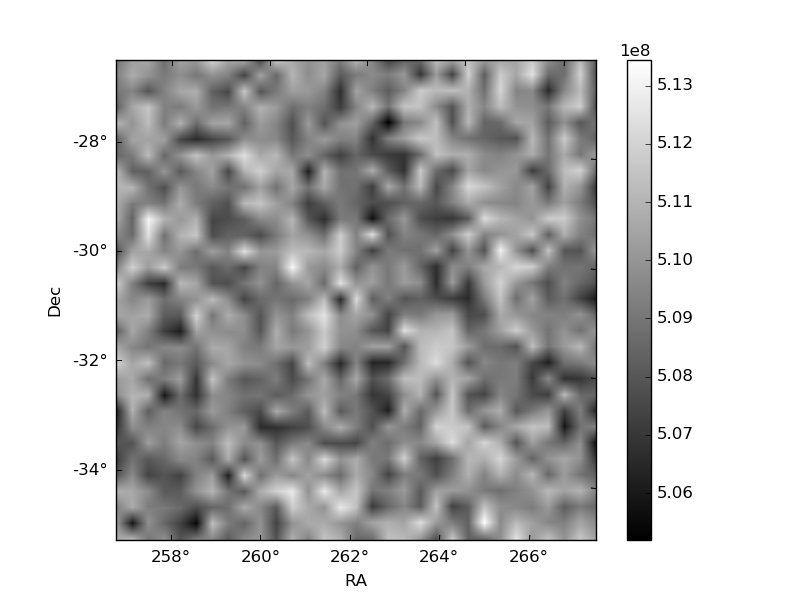
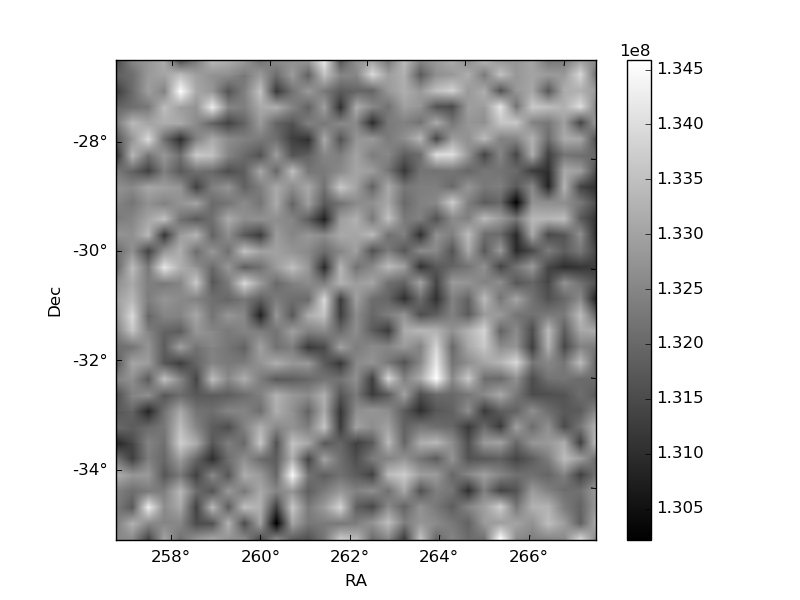
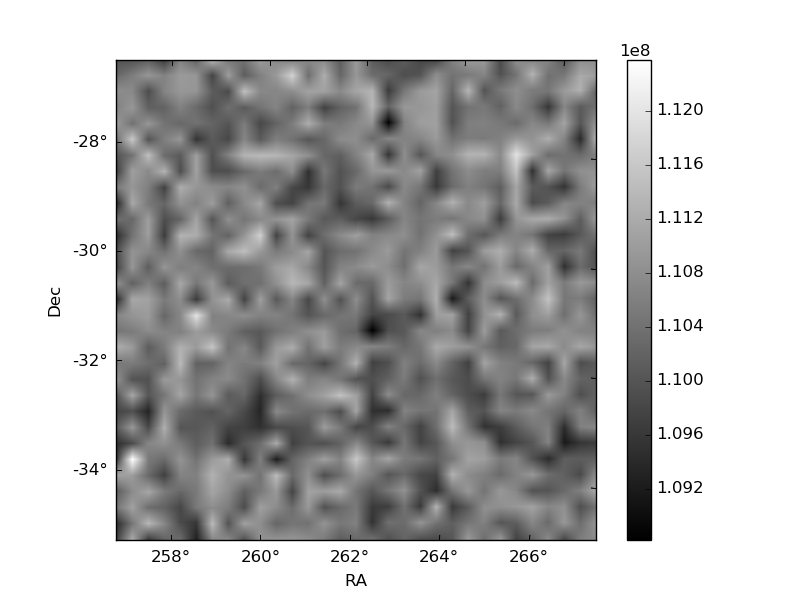
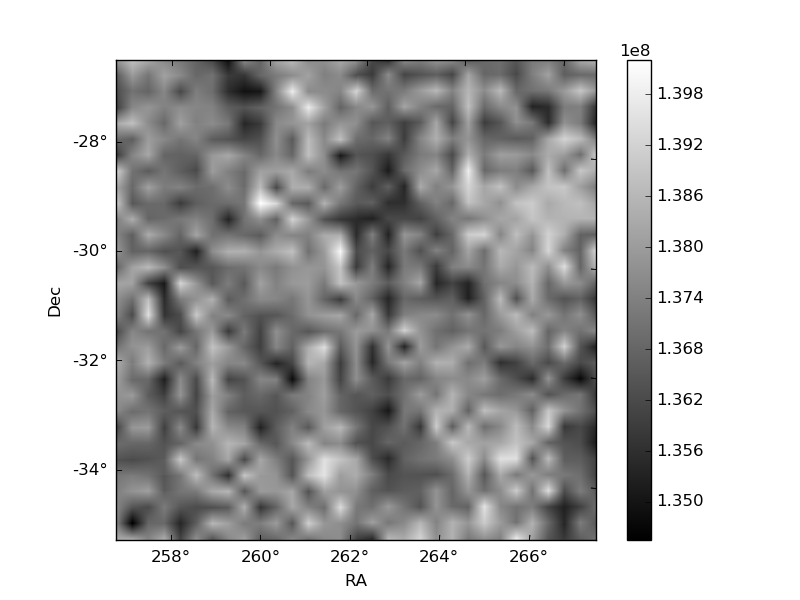
Histogram calculated using DETX and DETY for each event in the final _common_clean file
| Quadrant A | 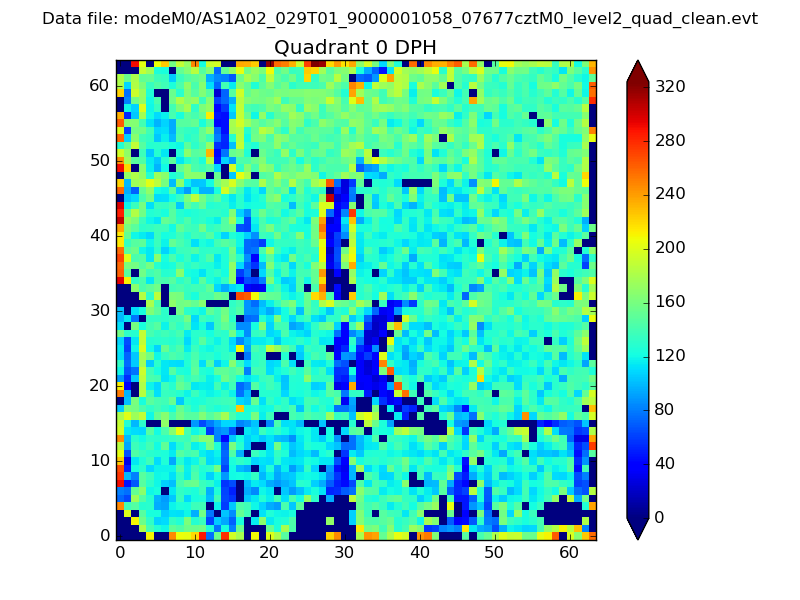 |
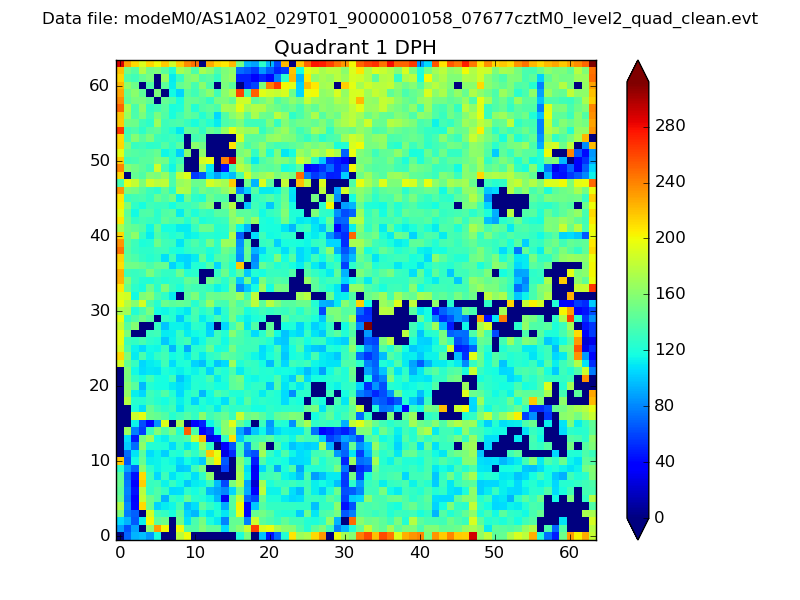 |
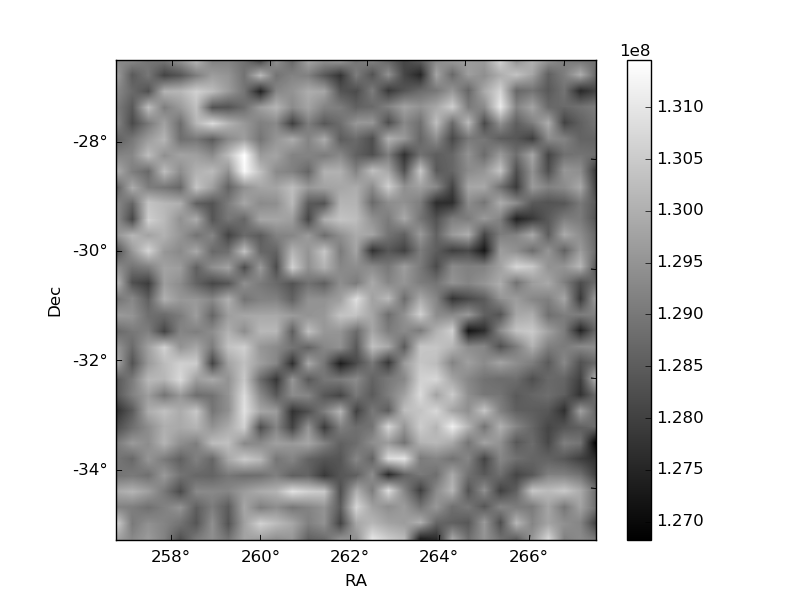
Quadrant B |
|---|---|---|---|
| Quadrant D | 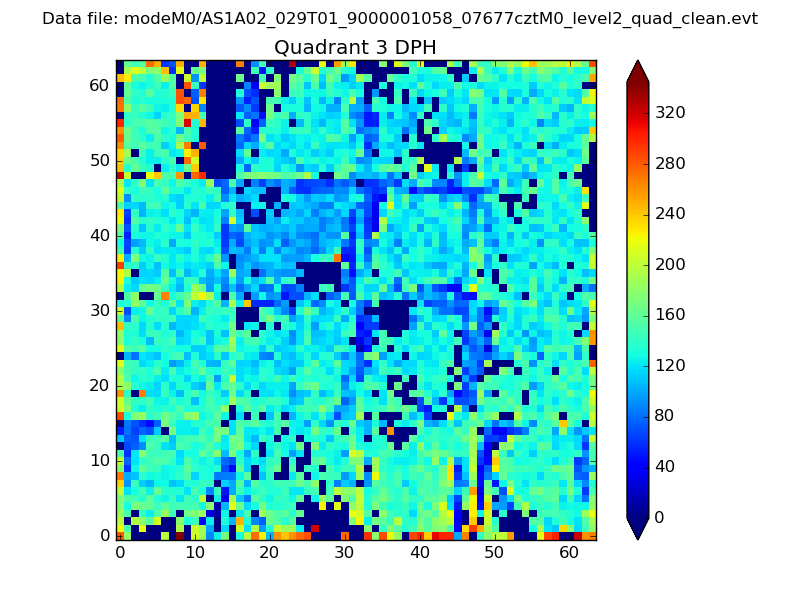 |
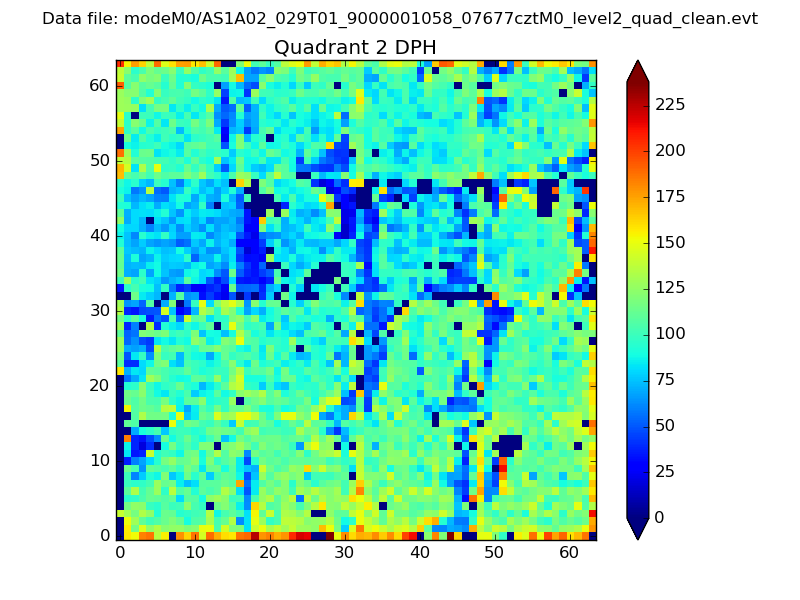 |
Quadrant C |
| Plot type | Count rate plots | Images |
|---|---|---|
| Comparison with Poisson distribution Blue bars denote a histogram of data divided into 1 sec bins. Red curve is a Poisson curve with rate = median count rate of data. |
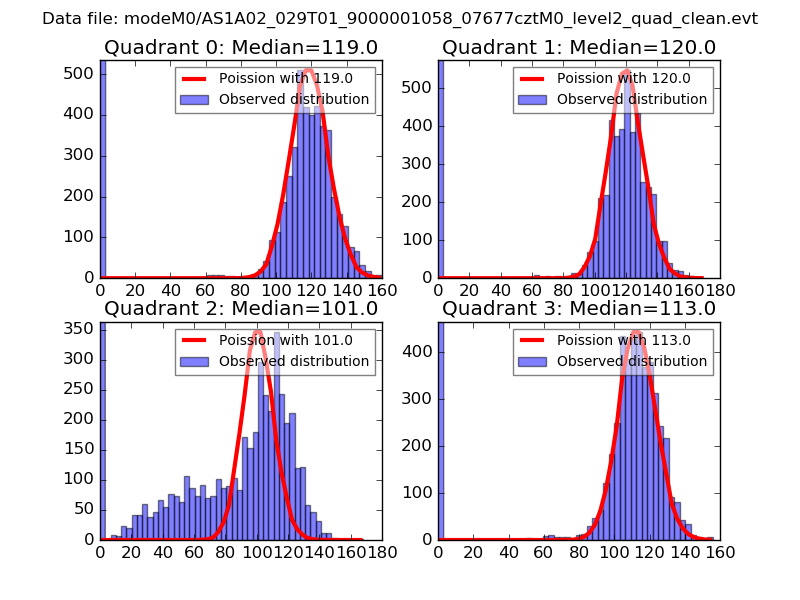 |
 |
| Quadrant-wise count rates Data is divided into 100 sec bins |
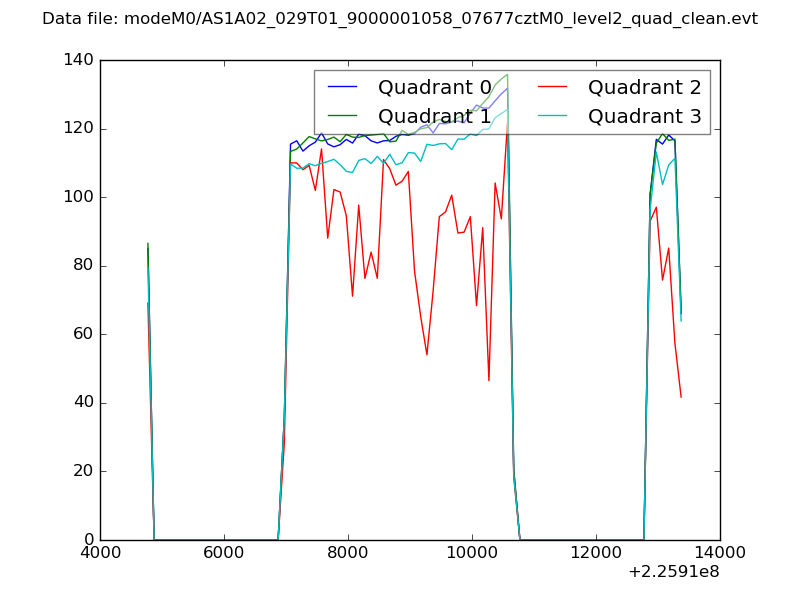 |
|
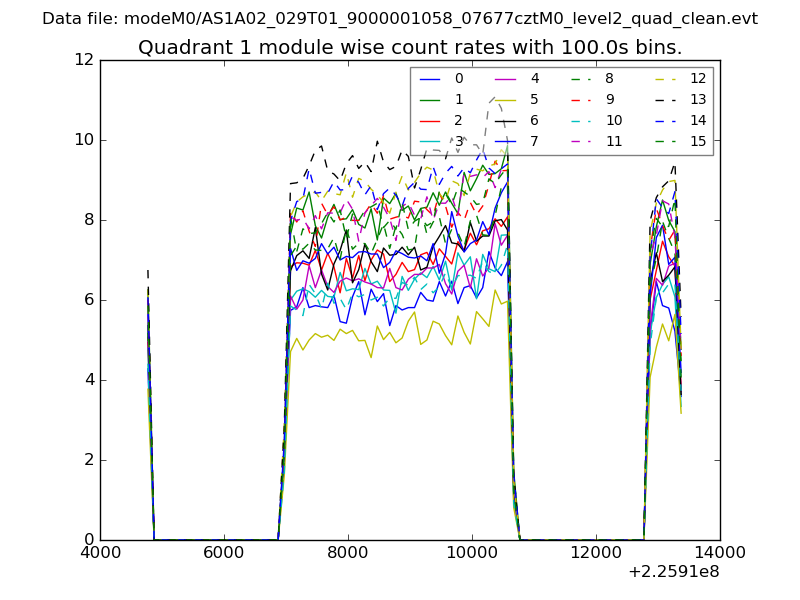
| Module-wise count rates for Quadrant A Data is divided into 100 sec bins |
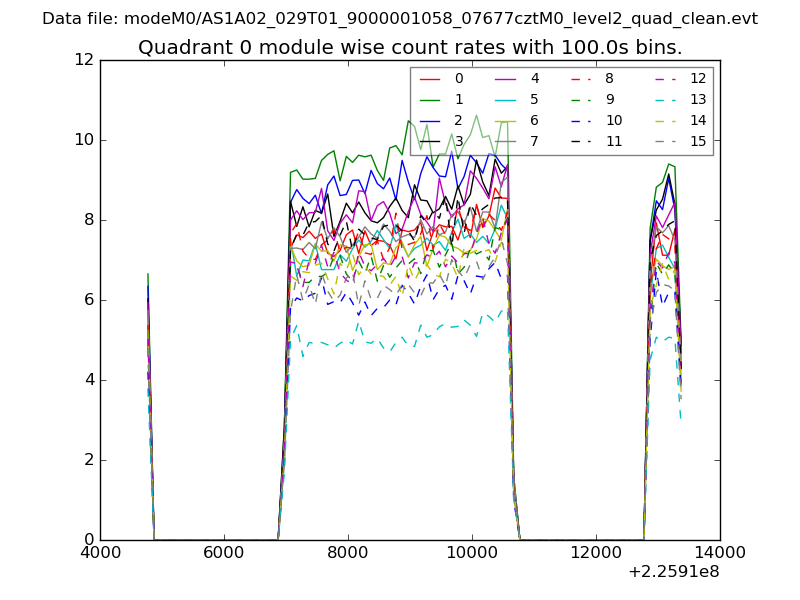 |
 |
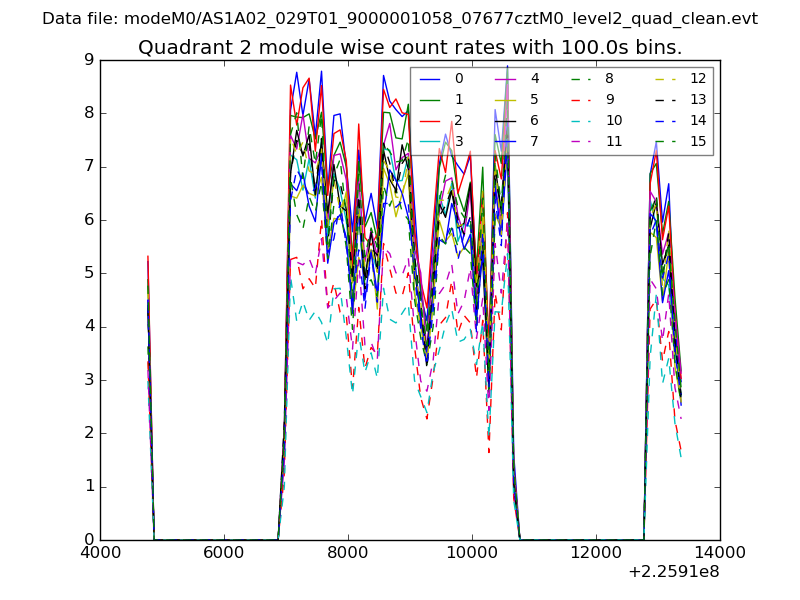
| Module-wise count rates for Quadrant B Data is divided into 100 sec bins |
 |
 |
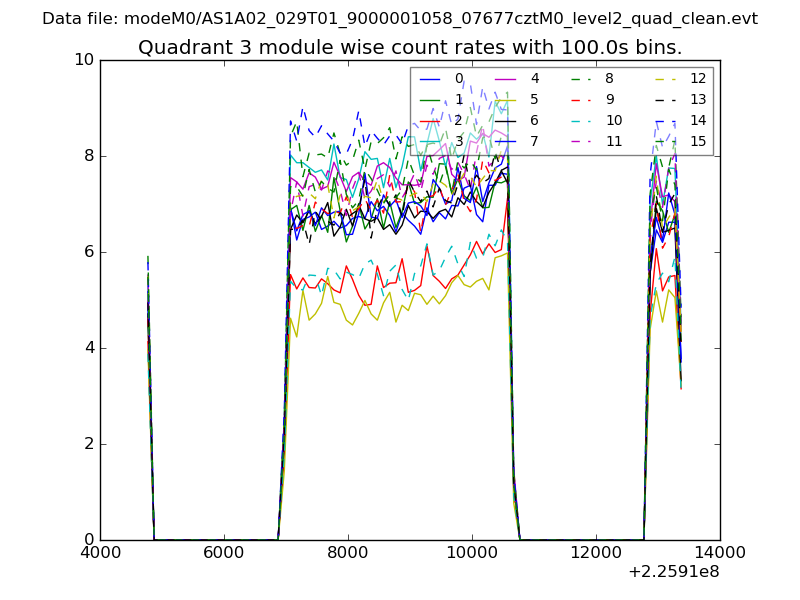
| Module-wise count rates for Quadrant C Data is divided into 100 sec bins |
 |
 |
| Module-wise count rates for Quadrant D Data is divided into 100 sec bins |
 |
 |
| Parameter | Plot |
|---|---|
| CZT HV Monitor | 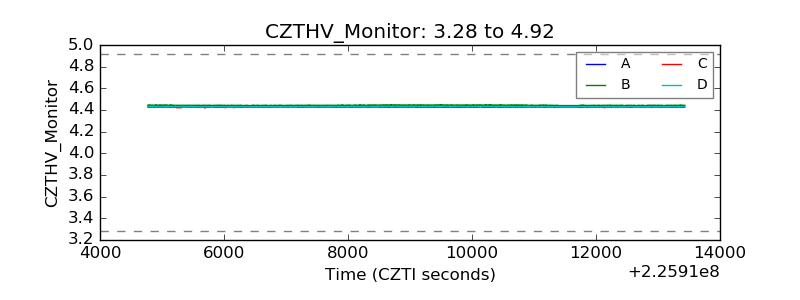 |
| D_VDD |  |
| Temperature 1 | 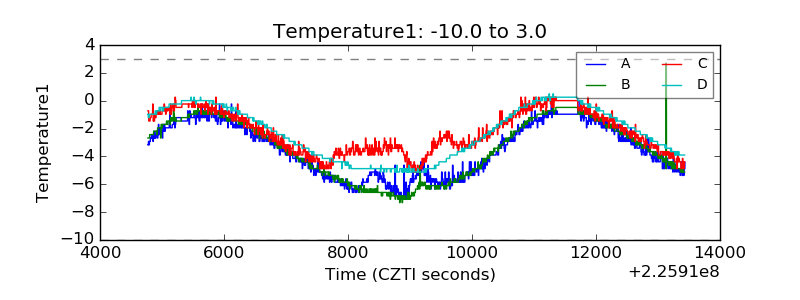 |
| Veto HV Monitor | 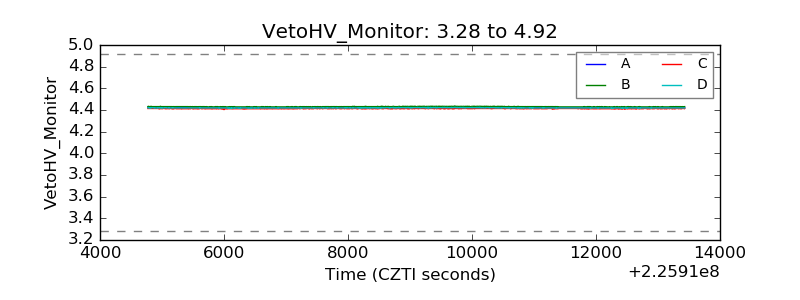 |
| Veto LLD | 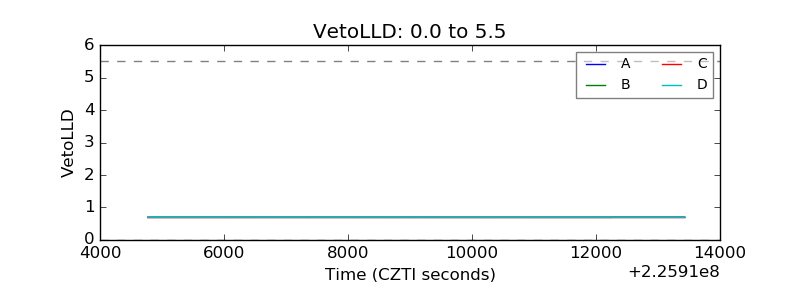 |
| Alpha Counter | 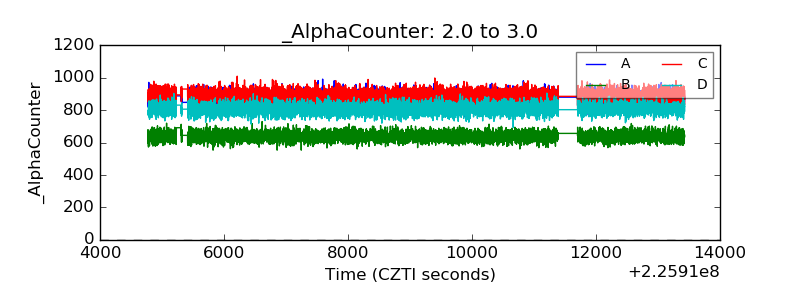 |
| _CPM_Rate | 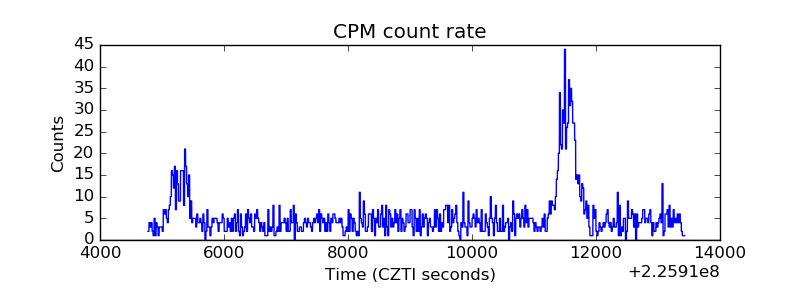 |
| CZT Counter | 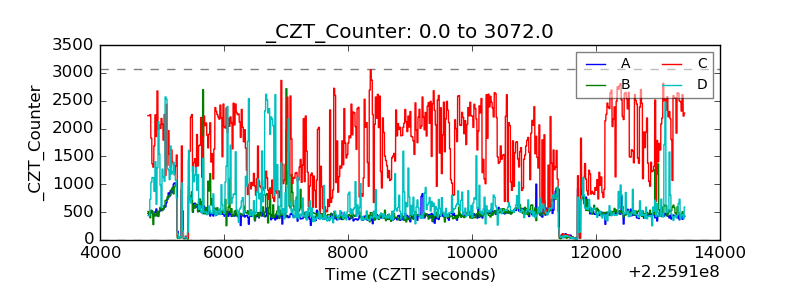 |
| +2.5 Volts monitor |  |
| +5 Volts monitor |  |
| _ROLL_ROT | 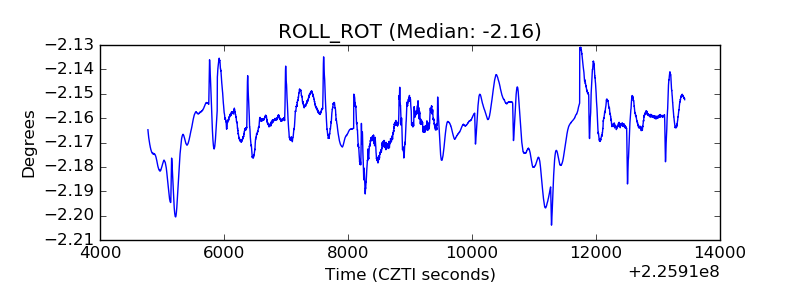 |
| _Roll_DEC |  |
| _Roll_RA | 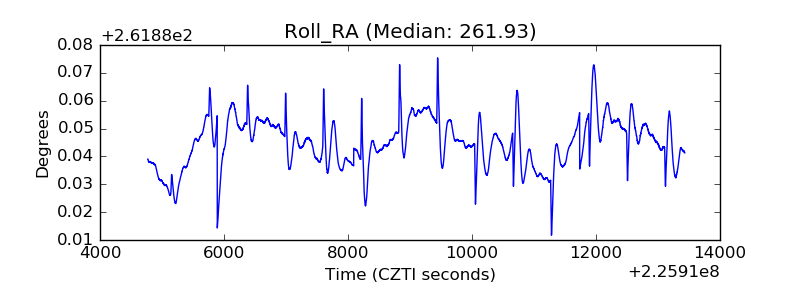 |
| Veto Counter | 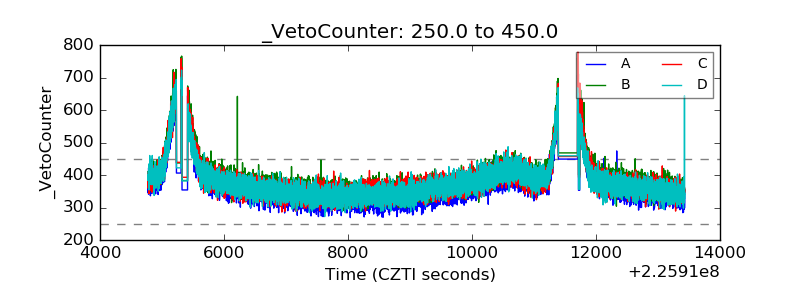 |